Impact Factor ISSN: 1449-1907

 Global reach, higher impact
Int J Med Sci 2017; 14(7):668-674. doi:10.7150/ijms.17865 This issue Cite
Research Paper
Diagnostic Value of Gadoxetic Acid-Enhanced MR Imaging to Distinguish HCA and Its Subtype from FNH: A Systematic Review
Yongfei Guo1, 2*, Wenjuan Li1*, Wenli Cai3, Yi Zhang1, Yijie Fang1, Guobin Hong1, 3 ![]()
1. Department of Radiology, The Fifth Affiliated Hospital of Sun Yat-sen University, Zhuhai 519000, P. R. China;
2. Department of Radiology, Zhongshan Affiliated Hospital, Guangzhou University of Chinese Medicine, Zhongshan 528400, P. R. China;
3. Department of Radiology, Massachusetts General Hospital and Harvard Medical School, Boston, 02114, USA.
* These authors contributed equally to this work.
Received 2016-10-10; Accepted 2017-4-21; Published 2017-6-23
Abstract
Objective: The purpose of this study was to systematically review the diagnostic performance of gadoxetic acid-enhanced magnetic resonance imaging (Gd-EOB-DTPA-MRI) for differentiation of hepatocellular adenoma (HCA) and focal nodular hyperplasia (FNH), as well as HCA classification by using the low signal intensity (SI) in the hepatobiliary phase (HBP).
Methods: A systematic process was used to review all published data in MEDLINE database about Gd-EOB-DTPA-MRI applied to differentiation of HCA and FNH, and classification of HCA by using low SI in the HBP. The pooled sensitivity and specificity were calculated to assess the diagnostic value of low SI in the HBP.
Results: A review of 45 articles identified 10 eligible studies with a total of 288 HCA lesions. The pooled proportion of low SI in the HBP of HCA were 91% (95% CI: 0.81-0.97). In specific, the subtypes of HCA were 75% (95% CI: 0.64-0.85) for I-HCA, 100% (95% CI: 0.95-1.00) for H-HCA, 92% (95% CI: 0.70-1.00) for U-HCA, and 59% (95% CI: 0.00-1.00) for b-HCA, respectively. The pooled specificity and sensitivity of low SI in the HBP for distinguishing FNH from HCA were 95% (95% CI: 0.92-0.98) and 92% (95% CI: 0.87-0.96), respectively.
Conclusion: Low SI in the HBP of Gd-EOB-DTPA-MRI is associated with higher accuracy for distinguishing HCA from FNH. However, the diagnostic accuracy may be overvalued, especially for the diagnosis of subtypes of b-HCA and I-HCA. Therefore, the risk factors and conventional imaging findings should be take into account simultaneously.
Keywords: Hepatic adenoma, Focal nodular hyperplasia, Gd-EOB-DTPA.
Introduction
Hepatocellular adenoma (HCA), also known as hepatic adenoma, is a relatively uncommon benign hepatic lesion that occurs predominantly in woman of child-bearing age. Although the etiology and pathogenesis of HCA are still not clear, studies show that HCA is commonly seen in women who have been using oral contraceptive or steroid drug, diagnosed of glycogen storage disease, obesity and iron overload in thalassemia patients [1]. Malignant transformation and the risk of bleeding were 4.2% and 15.8% for patients with HCA, respectively [2-3]. The clinical symptoms of HCA are generally non-specific and most patients are asymptomatic. However, some patients might with abdominal pains due to the tumor oppression against neighboring organs or hemorrhage within the tumor [4].
The lack of typical finding in MRI makes it difficult to differentiate HCA from other intrahepatic diseases, especially focal nodular hyperplasia (FNH), because both of them showed marked enhancement at arterial phase and complicated signal at portal phase. The differential diagnosis mostly relies on additional lesion characteristics such as bleeding, fatty degeneration, and central scar.
Gadoxetic acid (Gd-EOB-DTPA) is a new liver-specific hepatobiliary contrast agent for MRI that could be taken up via an organic anion transport system by normal hepatocytes. It is mainly used in the diagnosis and treatment evaluation of hepatocellular carcinoma, and differential diagnosis of hypervascular intrahepatic tumors. Several studies have proposed that Gd-EOB-DTPA can be applied as a new contrast agent for diagnosis of HCA [4-13]. However, the use of Gd-EOB-DTPA-MRI was still very limited. Only few studies had been published due to the low incidence of HCA. Additional investigation is needed for the diagnosis of HCA using Gd-EOB-DTPA-MRI
Pathologically, HCA is classified into four subtypes: HNF1-α mutated adenomas (H-HCA), inflammatory adenomas (I-HCA), unclassified adenomas (U-HCA) and β-catenin activated adenomas (b-HCA) [1,14]. Each HCA subtype may have different imaging findings. It is indispensable to distinguish among different subtypes for treatment decision-making. Blanc JF et al [15] thought that when the lesion of H-HCA, I-HCA, or U-HCA was less than 5 cm in diameter and has no rupture bleeding tendency, follow-up is recommended. However, b-HCA, regardless of the size, should be removed by surgery. MRI was proved to be an effective imaging method to distinguish the different subtypes of HCA [16-17].
In this study, we systematically reviewed all the published studies to assess the diagnostic performance of the low SI in the HBP in Gd-EOB-DTPA-MRI for differentiation of HCA from FNH, and the classification of HCA.
Methods
Search strategy
We searched for all published articles in the MEDLINE database, restricting to English language articles published from January 2004 to June 2016. The following key words were used: (Hepatocellular adenoma OR HCA OR HA) AND MRI AND (Gd-EOB-DTPA OR Primovist OR Gadoxetate disodium OR Gadoxetic acid OR eovist).
Inclusion criteria
Studies or subsets of studies were included if they met the following criteria: 1) prospective or retrospective human studies, the number of lesions >5, and the number of patients >3; 2) the separation of pathological subtypes; 3) imaged using Gd-EOB-DTPA-MRI including HBP; and 4) complete raw data were available to evaluate imaging findings.
Exclusion criteria
The exclusion criteria were: 1) Review articles, case reports, editorial material, letters, meeting abstract, and conference proceedings; and 2) Studies with incomplete data.
Two investigators (Yf Guo and Wj Li) reviewed the studies independently. Disagreements were resolved by consensus. All data were evaluated three times. For each study, we extracted the following information: the name and country of the first author, the number of patients, the year of publication, the total number of lesions, the number of lesions that confirmed by pathology, and the number of each HCA subtype.
Date extraction
The pooled sensitivity and specificity were calculated in terms of the true-positive(TP), true-negative(TN), false-negative(FN) and false-positive(FP) in the HBP using the reference standards below: TP-HCA with hypointensity in the HBP; TN-FNH with iso- or hyperintensity in the HBP; FN-HCA with iso- or hyperintensity in the HBP; FP-FNH with hypointensity in the HBP.
Study quality assessment and statistical analysis
The revised Quality Assessment of Diagnostic Accuracy Studies-2 (QUADAS-2) was used to assess the methodological quality of the included studies.
Q test and I2 test (DeSimonian-Laird method) were used to assess publication heterogeneity. An I2 value greater than 50% indicated heterogeneity among the studies. The effect size was analyzed using the random model in I2≥50% and fixed model was used in I2<50%. Meta-analysis for the rates of low SI in the HBP of HCA in Gd-EOB-DTPA-MRI was performed by using the R software.
Results
Search findings
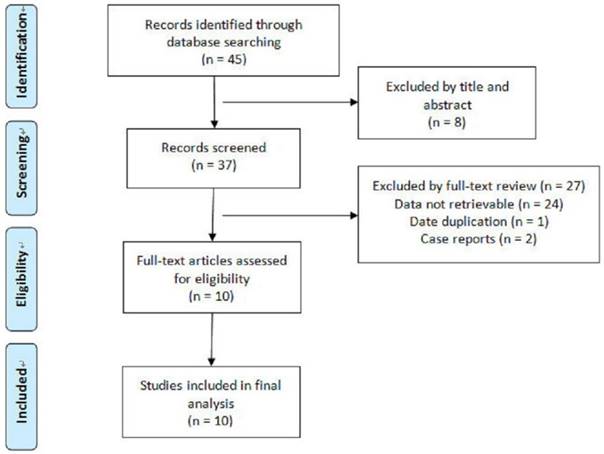
Our search process was described in Fig.1. The included studies were characterized in Table 1. Ten eligible studies with a total of 288 HCA lesions and 233 FNH lesions were included for analysis according to the inclusion and exclusion criteria (Table 1).
Flowchart of articles retrieved from the search of databases and reasons Flowchart of articles retrieved from the search of databases and reasons for exclusion.
General characteristic of the included studies
| Author | Country | Publication time | No. of Patient | Mean age | Comparison Group | No. of HCA | No. of FNH | Pathology proved(HCA/FNH) | HCA Subtype(I/H/U/b) |
|---|---|---|---|---|---|---|---|---|---|
| Bieze [3] | Netherlands | 2012 | 52 | 39 | HCA VS FNH | 24 | 28 | 24/28 | 0/0/0/0 |
| Grazioli[4] | Italy | 2012 | 82 | 42 | HCA VS FNH | 43 | 68 | 24/24 | 12/23/8/0 |
| Purysko [5] | USA | 2012 | 47 | 42 | HCA VS FNH | 12 | 35 | 18/8 | 0/0/0/0 |
| Mohajer [6] | USA | 2012 | 28 | 35 | HCA VS FNH | 6 | 34 | 6/2 | 0/0/0/0 |
| Grieser [7] | Germany | 2014 | 68 | 41 | HCA VS FNH | 71 | 44 | 71/43 | 6/15/7/1 |
| Ba-Ssalamah [8] | Austria | 2015 | 29 | 43 | HCA | 43 | 0 | 43/0 | 21/10/6/6 |
| Portilha [9] | Portugal | 2011 | 32 | 35 | HCA VS FNH | 8 | 24 | 6/3 | 0/0/0/0 |
| Thomeer [10] | Netherlands | 2014 | 7 | 38 | HCA | 8 | 0 | 8/0 | 5/0/0/0 |
| Agarwal [11] | Canada | 2014 | 7 | 45 | HCA | 24 | 0 | 7/0 | 24/0/0/0 |
| Tse [12] | USA | 2016 | 21 | 39 | HCA | 49 | 0 | 49/0 | 14/20/14/1 |
Abbreviations: FNH=focal nodular hyperplasia; HCA= hepatocellular adenoma; No=number; I=I-HCA; H=H-HCA; U=U-HCA; b=b-HCA.
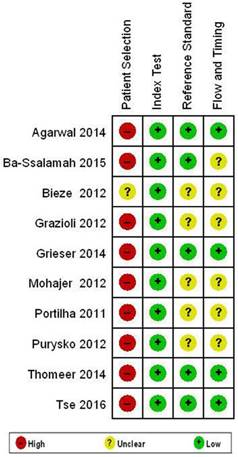
Study quality assessment
The Quality Assessment of Diagnostic Studies-2(QUADAS-2) criterion was used to assess the methodological quality of the included 10 studies. Fig.2 shows the risk of bias. The risks of bias in “Patient Selection” were generally high in our study. Most of the included studies had a case-control type of design. Studies were restricted to the artificial scenario of comparing only FNH and HCA, which is known to result in overestimation of diagnostic accuracy. Nine (9) studies (90%) had high risk of bias. The applicability of test in terms of “Reference Standard” and “Flow and Timing” is mainly unclear. 5 studies (50%) and 6 studies (60%) had unclear risk of bias. The reference standards used were not uniform, parts of patients and lesions had clinical or imaging reference standards rather than a histological reference standard, mainly for FNH, in which clinical and imaging reference standards were applied. This could represent incorporation bias.
Results of QUADAS-2 assessment for risk of bias in included studies.
Heterogeneity test
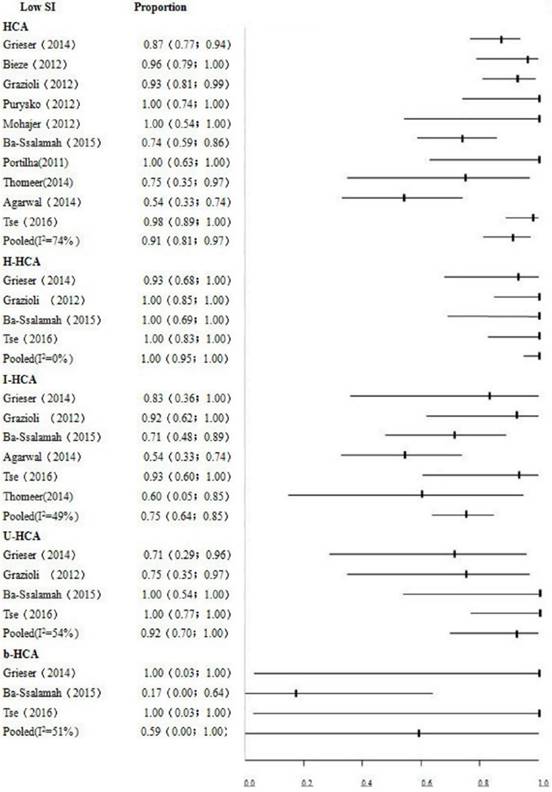
Pooled proportions of low SI in the HBP indicated significantly heterogeneity with the HCA, U-HCA and b-HCA (P<0.01, I2=74%; P=0.09, I2=54%; P=0.13, I2=51%, respectively). This may be caused by the pathological subtypes in the incurred in HCA.
Date analysis
Pooled proportion of low SI in the HBP of HCA was high (91%; 95% CI, 0.81-0.97; P<0.01, I2=74%). Data analysis indicated that HCA mainly showed low signals in the HBP in Gd-EOB-DTPA-MRI. This study showed higher pooled specificity of 95% (95% CI: 0.92-0.98) and sensitivity of 92% (95% CI: 0.87-0.96). Low SI in the HBP had higher accuracy in diagnosing HCA. The detailed data are shown in Table 2. Fig.3 depicts the results of different signal intensity in subtypes HCA in the HBP. The pooled proportions were 75% (95% CI: 0.64-0.85) for I-HCA, 100% (95% CI: 0.95-1.00) for H-HCA, 92% (95% CI: 0.70-1.00) for U-HCA, 59% (95% CI: 0.00-1.00) for b-HCA, respectively.
Summary of the bivariate indices of diagnostic accuracy of low SI in the HBP.
| REFERENCE | N | TP | TN | FP | FN | Sen | Spe | LR+ | LR- |
|---|---|---|---|---|---|---|---|---|---|
| Bieze M | 52 | 23 | 27 | 1 | 1 | 0.958 | 0.964 | 20.833 | 0.043 |
| Grazioli L | 111 | 40 | 62 | 6 | 3 | 0.930 | 0.912 | 10.543 | 0.077 |
| Mohazjer K | 40 | 6 | 34 | 0 | 0 | 1.000 | 1.000 | 65.000 | 0.072 |
| Purysko AS | 47 | 12 | 32 | 3 | 0 | 1.000 | 0.914 | 9.890 | 0.043 |
| Grieser C | 115 | 62 | 44 | 0 | 9 | 0.873 | 1.000 | 78.125 | 0.133 |
| Portilha | 32 | 8 | 23 | 1 | 0 | 1.000 | 0.958 | 15.741 | 0.059 |
| POOLED RESULT | 0.921 | 0.953 | 13.827 | 0.103 | |||||
| 95% CI | (0.868-0.957) | (0.917-0.976) | (7.811-24.479) | (0.064-0.167) | |||||
| P* | 0.237 | 0.059 | 0.366 | 0.691 | |||||
| I2 %§ | 26.3% | 53.0% | 7.8% | 0.0% |
*p value use the Cochran-Q method to test the heterogeneity of the pooled data. Values <0.05 indicate substantial heterogeneity. §I2 is the Higgin′s index for heterogeneity and values greater than 50 % indicate substantial heterogeneity.
Abbreviations: TP=true positive; TN=true negative; FP=false positive; FN=false negative; Spe=specificity; Sen=sensitivity; LR+=positive likelihood ratio; LR-=negative likelihood ratio.
Forest plot to show the proportions of iso- or high signals of HCA and its pathological subtype in the HBP. For each study, the proportion of hypo-SI and its corresponding 95% CI were plotted with black short of the ordinate and a horizontal line.
Discussion
HCA and FNH occur predominantly in the same patient populations, i.e. the child-bearing age women, who have no characteristic clinical manifestations, test index and have overlapping imaging findings [18].
Some conventional imaging findings play an important role for the differential diagnosis of HCA from FNH, such as bleeding, central scar and fatty degeneration. Fatty degeneration is a typical imaging feature which could assist the diagnose of HCA. This imaging feature exists only in H-HCA subtype [13]. However, some intrahepatic diseases may present fatty tissues, such as hepatic angiomyolipoma (HAML) and HCC, and fatty tissues were also found in FNH [5-6]. Thus, we cannot differentiate HCA from FNH and other tumors merely according to the presence of fatty tissues in tumors [19-20]. FNH regardless of its size rarely presents its internal hemorrhage, whereas bleeding often occurs in HCA for lesions > 5 cm large [2]. Therefore, bleeding in lesions is very helpful for the differential diagnosis between FNH and HCA for lesion > 5 cm large. However, the percentage of HCA lesions with bleeding is high; generally less than 10% [8-9, 13]. The central scar is recognized as a differential diagnosis of FNH from HCA and other lesions. More than half of FNH lesions are seen central scar signs, but almost all lesions in greater than 3 cm, less than 3 cm lesions rarely see scar signs [21-25]. So, for lesions >3 cm, the central scar could provide some information biomarkers for the differential diagnosis between HCA and FNH. However, HCA lesions can also appear central scar signs, and some HCA subtypes were with high rates, like I-HCA [9, 13]. So, if we find the sign of central scar, we should combine other imaging signs such as bleeding or fatty degeneration and the signal characteristics in the HBP.
The present study showed that the pooled proportions of low SI in the HBP of HCA was higher (91%). These findings suggested that most HCA showed low SI in the HBP, which has very high specificity (95%; 95% CI, 0.92-0.98) and sensitivity (92%; 95% CI, 0.87-0.96). Low SI in the HBP in Gd-EOB-DTPA-MRI is rather specific, especially when HCA could not be differentiated from FNH by routine imaging. The image appearance in the HBP in Gd-EOB-DTPA-MRI will greatly increase clinician confidence level for diagnosis, which may substantially improve HCA diagnosis accuracy. A small proportion of HCA showed iso- or high SI in the HBP, and it is hardly differentiated from FNH only according to imaging presentations in the HBP. Therefore, HCA presentations in routine imaging and the risk factors should also be considered for a comprehensive analysis to improve diagnosis accuracy.
Multiple studies have demonstrated a substantial difference in percentages of different pathological subtypes of HCA, and the proportion of low SI in the HBP is also overtly different among various subtypes. The accuracy of diagnosing HCA with low SI in the HBP in Gd-EOB-DTPA-MRI varies greatly among studies [5, 8-9, 11-13]. These could be associated with differences in lifestyle, diet, and exposure to risk factors of HCA, which induce different pathological HCA subtypes.
H-HCA is a less aggressive pathologic subtype which is associated with oral contraceptive use and that may rarely undergo malignant transformation [26]. In our study, H-HCA pooled proportion of low SI was 100% (95% CI: 0.95-1.00), which indicates H-HCA displays primarily low SI in the HBP. The lesion shows not only low SI in the HBP, but also containing fat tissue, has a very high sensitivity and accuracy for the diagnosis of H-HCA [13]. The mechanism of I-HCA is believed to have high associations with contraceptives, obesity and alcoholism. In our group, I-HCA pooled proportion of low SI was 75% (95% CI: 0.64-0.85), which means most of I-HCA displays low SI, but compared with other pathological subtypes, I-HCA displayed more odds with iso- or high signals in the HBP. Sometimes, it is difficult to differentiate atypical I-HCA from FNH. The two entities may share the same imaging features, even the same enhancement patterns. However, the signal intensity of I-HCA may be heterogeneous caused by hemorrhage and necrosis [4-5, 12]. Some I-HCA were with “fatty liver”, the lesions demonstrated marked T2 hyperintensity compared with surrounding liver [12-13]. The incidence of U-HCA accounts for less than 10% of HCA, the etiology and pathogenesis of which are still unknown. In our study, the pooled proportion of low SI was 92% (95% CI: 0.70-1.00), which indicates most of U-HCA showing a classic signal intensity of HCA in the HBP. b-HCA has been considered as a borderline tumor between HCA and HCC which is commonly occurred in males and is associated with androgen steroids, glycogen storage disease, and familial adenomatous polyposis syndrome. 4.2% of HCA has a tendency to undergo malignant transformation to HCC, and of which 46% are b-HCA [3]. In our cases, 59% (95% CI: 0.00-1.00) of b-HCA displayed low SI in the HBP, which means most of b-HCA displayed iso- or high SI in the HBP. b-HCA may enhance severely during arterial phase, and then wash out very quickly or slowly, the enhancement pattern may be difficult to differentiate HCC from FNH [27]. Therefore, the role of Gd-EOB-DTPA-MRI in diagnosis of b-HCA is very limited. The low SI in the HBP has the highest diagnosis accuracy of H-HCA and lowest diagnosis accuracy of b-HCA. Otherwise, it is easy to confuse with I-HCA and FNH because of their conventional imaging and the SI in the HBP, and the diagnosis accuracy of I-HCA may be improved by combining risk factors of liver diseases.
The low SI of HCA in the HBP may be related to the tumor itself and liver background: HCA tumor cells express OATP1B1/3 and MRP3 levels different, which respectively affect Gd-EOB-DTPA uptake and excretion [9]. Chronic inflammation and fatty liver may cause HCA to iso-or high signal on the HBP [5, 27]. Iso- or high SI of FNH in the HBP rarely occur. FNH revealed stronger OATP8 expression, large central scar or abundant fat component within the lesion that may contribute to a reduction in gadoxetic acid enhancement or signal loss on fat-saturated images [4-6, 8, 28].
Our study has some limitations: First, the number of samples was small. Especially the number of U-HCA and b-HCA was relatively small. Second, our study only assessed the diagnostic performance of Gd-EOB-DTPA-MRI to differentiate the HCA from FNH, as well as the classification of HCA. HCA needs to be differentiated from some other hypervascular tumors in the liver. Third, parts of lesions had clinical or imaging reference standards rather than histological reference standards.This may result in an incorporated bias in the study and may overestimate the diagnostic accuracy of the index test. Forth, the inclusion of individual HCA pathological subtypes may result in heterogeneity of the results.
Conclusion
Low SI in the HBP of Gd-EOB-DTPA-MRI is associated with higher accuracy for distinguishing HCA from FNH, but it was overvalued to distinguish HCA and FNH. The low SI in the HBP has the highest accuracy for classification H-HCA and has the lowest accuracy for b-HCA. It was also know that some of I-HCA and b-HCA may be misdiagnosed as FNH or HCC. A combination of Gd-EOB-DTPA in conventional MRI images and risk factors of liver diseases may substantially improve the diagnostic value of HCA and HCA classification.
Abbreviations
Gd-EOB-DTPA-MRI: gadoxetic acid-enhanced magnetic resonance imaging;
HCA: hepatocellular adenoma;
SI: signal intensity,
HBP: hepatocyte-phase;
FNH: focal nodular hyperplasia;
H-HCA: HNF1-α mutated adenomas;
I-HCA: inflammatory adenomas;
U-HCA: unclassified adenomas;
b-HCA: β-catenin activated adenomas;
95%CI: 95% confidence interval;
QUADAS-2: Quality Assessment of Diagnostic Studies-2.
Acknowledgements
This work was partly supported by the National Natural Science Foundation of China (81271561) and the Natural Science Foundation of Guangdong Province, China (2015A030313173). This work was partly supported by the Science and Technology Project of Zhongshan, Guangdong Province, China (2016B1048).
Competing Interests
The authors have declared that no competing interest exists.
References
1. Bioulac-Sage P, Laumonier H, Couchy G. et al. Hepatocellular adenoma management and phenotypic classification: the Bordeaux experience. Hepatology. 2009;50:481-489
2. Van Aalten SM, de Man RA, IJzemans JN. et al. Systematic review of haemorrhage and rupture of hepatocellular adenomas. Br Surg. 2012;99:991-996
3. Stoot JH, Coelen RJ, Jonq MC. et al. Malignant transformation of hepatocellular adenomas into hepatocellular carcinomas: a systematic review including more than 1600 adenoma cases. HPB. 2010;12:509-522
4. Bieze M, van den Esschert JW, Nio CY. et al. Diagnostic accuracy of MRI in differentiating hepatocellular adenoma from focal nodular hyperplasia: prospective study of the additional value of gadoxetate disodium. AJR Am J Roentgenol. 2012;199:26-34
5. Grazioli L, Bondioni MP, Haradome H. et al. Hepatocellular adenoma and focal nodular hyperplasia: value of gadoxetic acid-enhanced MR imaging in differential diagnosis. Radiology. 2012;262:520-529
6. Purysko AS, Remer EM, Coppa CP. et al. Characteristics and distinguishing features of hepatocellular adenoma and focal nodular hyperplasia on gadoxetate disodium-enhanced MRI. AJR Am J Roentgenol. 2012;198:115-123
7. Mohajer K, Frydrychowicz A, Robbins JB. et al. Characterization of hepatic adenoma and focal nodular hyperplasia with gadoxetic acid. J Magn Reson. Imaging. 2012;36:686-696
8. Gsieser C, Steffen IG, Kramme IB. et al. Gadoxetic acid enhanced MRI for differentiation of FNH and HCA: a single centre experience. Eur Radiol. 2014;24:1339-1348
9. Ba-Ssalamah A, Antunes C, Feier D. et al. Morphologic and Molecular Features of Hepatocellular Adenoma with Gadoxetic Acid-enhanced MR Imaging. Radiology. 2015;277:104-113
10. Portilha MA, Pedro MT, Ruivo C. et al. Gd-EOB-DTPA-enhanced magnetic resonance imaging: differentiation between focal nodular hyperplasia and hepatocellular adenoma. Acta Med Port. 2011;24(Suppl 2):531-538
11. Thomeer MG, E Bröker ME, de Lussanet Q. et al. Genotype-phenotype correlations in hepatocellular adenoma: an update of MRI findings. Diagn Interv Radiol. 2014;20:193-199
12. Agarwal S, Fuentes-Orrego JM, Arnason T. et al. Inflammatory hepatocellular adenomas can mimic nodular hyperplasia on gadoxetic acid-enhanced MRI. AJR Am J Roentgenol. 2014;203:408-414
13. Tse JR, Naini BV, Lu DS. et al. Qualitative and Quantitative Gadoxetic Acid-enhanced MRI Imaging Helps Subtype Hepatocellular Adenomas. Radiology. 2016;279:118-127
14. Zucman-Rossi J, Jeannot E, Nhieu JT. et al. Genotype-phenotype correlation in hepatocellular adenoma: new classification and relationship with HCC. Hepatology. 2006;43:515-524
15. Blanc JF, Frulio N, Chiche L. et al. Hepatocellular adenoma management: Call for shared guidelines and multidisciplinary approach. Clin Res Hepatol Gastroenterol. 2015;39:180-187
16. Ronot M, Bahrami S, Calderaro J. et al. Hepatocellular adenomas: accuracy of magnetic resonance imaging and liver biopsy in subtype classification. Hepatology. 2011;53:1182-1191
17. Laumonier H, Bioulac-Sage P, Laurent C. et al. Hepatocellular adenomas: magnetic resonance imaging features as a function of molecular pathological classification. Hepatology. 2008;48:808-818
18. Bioulac-Sage P, Balabaud C, Wanless IR. Diagnosis of focal nodular hyperplasia: not so easy. Am J Surg Pathol. 2001;25:1322-1325
19. Stanley G, Jeffrey Jr RB, Feliz B. CT findings and mistopathology of intratumoral steatosis in focal nodular hyperplasia: case report and review of the literature. J Comput Assist Tomogr. 2002;26:815-817
20. Mortelé KJ, Stubbe J, Praet M. et al. Intratumoral steatosis in focal nodular hyperplasia coinciding with diffuse hepatic steatosis: CT and MRI findings with histologic correlation. Abdom Imaging. 2000;25:179-181
21. Grazioli L, Morana G, Kirchin MA. et al. Accurate differentiation of focal nodular hyperplasia from hepatic adenoma at gadobenate dimeglumine-enhanced MR imaging: prospective study. Radiology. 2005;236:166-177
22. Van Aalten SM, Thomeer MG, Terkivatan T. et al. Hepatocellular Adenomas: Correlation of MR Imaging Findings with Pathologic Subtype Classification. Radiology. 2011;261:172-181
23. Mathieu D, Vilgrain V, Mahfouz AE. et al. Benign liver tumors. Magn Reson Imaging Clin N Am. 1997;5:255-288
24. Shirkhoda A, Farah MC, Bernacki E. et al. Hepatic focal nodular hyperplasia: CT and sonographic spectrum. Abdom Imaging. 1994;19:34-38
25. Shamsi K, De Schepper A, Degryse H. et al. Focal nodular hyperplasia of the liver: radiologic findings. Abdom Imaging. 1993;18:32-38
26. Bacq Y, Jacquemin E, Balabaud C. et al. Familial liver adenomatosis associated with hepatocyte nuclear factor 1alpha inactivation. Gastroenterology. 2003;125:1470-1475
27. Shanbhogue A, Shah SN, Zaheer A. et al. Hepatocellular adenomas: current update on genetics, taxonomy, and management. J Comput Assist Tomogr. 2011;35:159-166
28. Rebouissou S, Bioulac-Sage P, Zucman-Rossi J. Molecular pathogenesis of focal nodular hyperplasia and hepatocellular adenoma. J Hepatol. 2008;48:163-170
Author contact
![]() Corresponding author: Guobin Hong, Department of Radiology, the Fifth Affiliated Hospital, Sun Yat-Sen University, Zhuhai 519000, China. Phone: +86 756 2528666; Email: honggbsysu.edu.cn
Corresponding author: Guobin Hong, Department of Radiology, the Fifth Affiliated Hospital, Sun Yat-Sen University, Zhuhai 519000, China. Phone: +86 756 2528666; Email: honggbsysu.edu.cn