Impact Factor ISSN: 1449-1907

 Global reach, higher impact
Int J Med Sci 2017; 14(7):629-638. doi:10.7150/ijms.17641 This issue Cite
Research Paper
Involvement of Ornithine Carbamoyltransferase in the Progression of Chronic Hepatitis C and Liver Cirrhosis
Masahiko Ohnishi1, Akihisa Higuchi1, Hiroshi Matsumura1, Yasuo Arakawa1, Hitomi Nakamura1, Kazushige Nirei1, Toshiki Yamamoto1, Hiroaki Yamagami1, Masahiro Ogawa1, Takuji Gotoda1, Shunichi Matsuoka1, Noriko Nakajima1, Masahiko Sugitani2, Mitsuhiko Moriyama1 ![]() , Hiroshi Murayama3
, Hiroshi Murayama3
1. Division of Gastroenterology and Hepatology, Department of Medicine, Nihon University School of Medicine. 30-1 Oyaguchi kamimachi, Itabashi-ku, Tokyo 173-8610, Japan;
2. Division of Morphological and Functional Pathology, Nihon University School of Medicine;
3. Yamasa Corporation, Yamasa Corporation, 2-10-1 Araoi-cho, Choshi, Chiba 288-0056, Japan.
Received 2016-9-20; Accepted 2016-12-28; Published 2017-6-14
Abstract
Background: The involvement of serum ornithine carbamoyltransferase (OCT) in the progression of chronic hepatitis and liver cirrhosis is unclear.
Methods: A total 256 patients with chronic hepatitis C and 5 healthy controls were examined. Serum OCT concentrations were measured by enzyme-linked immunosorbent assay. Serum OCT concentrations were compared with serum cytokine and chemokine levels, and with disease severity and development of hepatocellular carcinoma (HCC).
Results: The median OCT concentrations were 21.8 ng/ml for healthy controls, 36.7 ng/ml for F0 stage disease, 48.7 ng/ml for F1 stage, 77.9 ng/ml for F2 stage, 104.8 ng/ml for F3 stage, and 121.4 ng/ml for F4 stage. OCT concentrations were correlated with aspartate aminotransferase, alanine aminotransferase, γ-glutamyl transpeptidase, platelet counts, indocyanine green retention rate at 15 min, prothrombin times, the molar ratio of branched chain amino acids to tyrosine, and tyrosine. Furthermore, there were significant correlations among OCT concentrations and IP10 and IL18 levels. There were weak correlations between serum OCT concentrations and liver histology. The cumulative incidence of HCC in the high-OCT concentration group (≥75.3 ng/ml) was higher than that in the low-OCT concentration group.
Conclusion: The measurement of serum OCT concentration may provide a useful marker of disease severity, and thus could be a useful marker for a high risk of HCC occurrence.
Keywords: Ornithine carbamoyltransferase (OCT), hepatocellular carcinoma, chronic hepatitis C, liver cirrhosis, Bio-plex suspension array.
Introduction
Ornithine carbamoyltransferase (OCT) is an enzyme that produces citrulline and phosphoric acid from carbamoyl phosphoric acid and ornithine. OCT is located at mitochondria in humans, where it participates in the urea cycle, and it is almost exclusively specific to the liver [1, 2]. Therefore, blood concentrations of OCT could indicate a hepatocyte disorder and thus be a good index of the extent of liver damage [3]. OCT down-regulation reduces the activity of the urea cycle and thereby protracts hyperammonemia, leading to liver failure [4, 5, 6]. Regarding the correlation between serum OCT concentrations and clinical status in liver disease patients, it has been reported that OCT concentrations are related to disease activity and progression of non-alcoholic steatohepatitis (NASH) and alcoholic liver damage [3, 7, 8]. It has also been reported that OCT concentrations are increased in patients with hepatocellular carcinoma (HCC) [6, 9].
In this study, we examined serum OCT concentrations in patients with hepatitis C virus (HCV) RNA-positive chronic hepatitis C (CH-C) and liver cirrhosis (LC), and in healthy individuals. OCT concentrations, liver histology, and results of blood and biochemical tests of patient samples were then compared. In order to further examine associations between OCT concentrations and serum cytokine/chemokine levels, we measured the latter using a Bio-plex suspension array system (Bio-Rad Laboratories, Berkeley, CA, USA). We also examined the role of OCT in development of HCC in patients with CH and LC. Finally, we analyzed whether the serum concentrations of OCT in patients with CH and LC could be used for screening groups at high risk for HCC.
Materials and Methods
Patients
The study population included 256 HCV RNA-positive patients who received a liver biopsy at the Nihon University Itabashi hospital between 2000 and 2008. All subjects gave informed consent for their participation in this study. Among these subjects, 2 (2 male, median age 66.3 y) were classified as F0 stage, 124 (70 male, median age 54.0 y) were F1 stage, 66 (27 male, median age 66.2 y) were F2 stage, 37 (28 male, median age 61.6 y) were F3 stage, and 27 (13 male, median age 65.6 y) were F4 stage. Table 1 shows the clinical profiles of the CH and LC patients in this study.
Clinical profiles of subjects (n=256)
| Chronic hepatitis (F0 to F3) | Liver ciorrhosis (F4) | |
|---|---|---|
| Number | 229 | 27 |
| Observation periods (yrs) | 5.9±3.4 | 6.9±4.4 |
| Age (yrs) | 59.5±11.6 | 65.3±10.7 |
| Gender (males) | 55.6% | 41.3% |
| AST (U/L) | 55.6±38.1 | 82.0±35.1 |
| ALT (U/L) | 75.5±60.7 | 99.4±55.2 |
| r-GT (U/L) | 59.6±61.3 | 62.7±41.5 |
| ALP (U/L) | 265.5±99.3 | 322.1±132.9 |
| Total bilirubin (mg/dl) | 0.64±0.27 | 0.71±0.23 |
| Platelet counts(x104) | 18.1±5.9 | 13.2±3.9 |
| Total protein (g/dl) | 7.25±0.63 | 7.40±0.56 |
| Albumin (g/dl) | 4.07±0.39 | 4.03±0.77 |
| Prothrombin time (%) | 96.7±6.6 | 7.40±0.56 |
| BTR | ||
| BCAA | ||
| Tyrosine | ||
| Ammonia (µg/dl) | 54.4±22.1 | 41.6±16.8 |
| ICGR15 (%) | 8.0±5.2 | 15.8±8.5 |
| Zinc concetration (µg/dl) | 75.6±13.5 | 71.4±13.8 |
| F stages | ||
| F0 | F0: 2 (0.9%) | |
| F1 | F1: 124 (54.1%) | |
| F2 | F2: 66 (28.8%) | |
| F3 | F3: 37 (16.2%) | |
| F4 | 27 | |
| HCV RNA | ||
| High | 87.7% | 91.1% |
| Low | 12.3% | 8.9% |
| Serotype | ||
| 1 | 87% | 89.3% |
| 2 | 13% | 10.7% |
p was calculated by ANOVA, CH, chronic hepatitis; LC, liver cirrhosis; AST, aspartate amino transferase; ALT, Alanin aminotransferase; ALP, Alkaline Phosphatase; Γ-GT, γ-glutamyltransferase; ICGR15, the retention rate of indocyanine green 15 min; HCV RNA high, ≧106 copy/ml; HCV RNA low, <105 copy/ml.
Clinical and laboratory assessments
Serum was collected at the time of liver biopsy and stored at -80 °C until analysis. Blood samples were obtained only from patients who gave informed consent to have their serum samples stored for subsequent laboratory analysis. A total of 5 subjects (all male, median age 40.1 y) with normal serum sedimentation rates, C reactive protein (CRP), and liver function tests were examined as healthy controls. Exclusion criteria included age less than 18 years, habitual alcohol intake (more than 30 g ethanol/day), the presence of hepatitis B surface antigen (enzyme-linked immunosorbent assay; EIA, Abbott Tokyo, Japan), the presence of anti-smooth muscle antibody (fluorescence antibody method; FA), the presence of anti-mitochondria M2 antibody (EIA), and current intravenous drug use. All of the patients were positive for serum HCV RNA and were observed for more than 1 year. A definitive diagnosis of HCC was made following abdominal angiography or tumor biopsy of the liver, carried out when an HCC nodule was suspected following abdominal ultrasonography or computed tomography (CT).
Patients who enrolled in this study agreed to cooperate with the study procedures and to have the results published in a poster. This study was also approved by the clinical study screening committee of Nihon University Itabashi Hospital.
Measurement of serum OCT concentrations
Serum OCT concentrations were measured using an EIA method as previously reported [7, 8]. First, 50 μL of a horseradish peroxidase-conjugated F (ab') fragment of a monoclonal anti-OCT IgG antibody (Mo5B11) and 50 μL of a standard solution or sample diluted 10 fold in buffer with 250 nM glycine buffer, 0.1% bovine serum albumin (BSA), 50 nM NaCl and 0.1% ProClin 950 were added to wells of an antibody-coated microplate (Mo3B11). After mixing, the plates were incubated for 2 hours and then washed with 10 nM phosphate buffer (pH 7.4) containing 0.1% BSA, 150 nM NaCl and 0.1% ProClin 950. Next, a substrate solution with 200 μg/mL 3,3',5,5'-teramethylbenzidine with 0.001% H2O2 was added. Finally, the reaction was terminated after 20 minutes by adding a stop solution with 0.5 M H2SO4 H2SO4. The absorbance at 450 nm was measured using a microplate reader.
Measurement of serum cytokine and chemokine levels
Cytokine and chemokine levels in the serum of 95 subjects were measured using a Bio-plex suspension array system (Bio-Rad Laboratories) according to the manufacturer's instructions. These subjects (55 male and 40 female) all had CH (n=64) or LC (n=31). The following cytokines and chemokines were measured: cutaneous T-cell-attracting chemokine (CTACK), growth-regulated alpha protein (GROa), Interleukin (IL)-1α, IL-2 receptor α(Rα), IL-3, IL-12p40, IL-16, IL-18, leukemia Inhibitory Factor (LIF), monocyte-specific chemokine 3 (MCP-3), macrophage colonystimulating factor (M-CSF), macrophage migration inhibitory factor (MIF), Hu migration inducing gene (MIG), b-nerve growth factor (NGF), c-Kit receptor present on mast cells and stem cell factor (SCF), stem cell growth factor β(SCGF)-β, stromal cell-derived factor 1 α (SDF-1α), tumor necrosis factor (TNF)-β, tumor necrosis factor-related apoptosis-inducing ligand (TRAIL), hepatocyte growth factor (HGF), Hu interferon α2 (IFN-α2), platelet-derived growth factor receptor (PDGF)- ββ, IL-1b, IL-1ra, IL-2 , IL-4, IL-5, IL-6, IL-7, IL-8 , IL-9, IL-10, IL-12(p70), IL-13, IL-15, IL-17, eotaxin, FGF basic, granulocyte-colony stimulating factor (G-CSF), granulocyte macrophage-colony stimulating factor (GM-CSF), interferon gamma (IFN-γ), interferon gamma-induced protein-10 (IP-10), monocyte chemoattractant protein-1 (MCP-1)(MCAF), macrophage inflammatory protein 1 (MIP-1α), MIP-1β, regulated on activation, normal T-cell expressed and secreted (RANTES), TNF-α, and vascular endothelial growth factor (VEGF).
Measurements of HCV RNA levels
Serum HCV RNA levels were determined using the Amplicor HCV Monitor (Roche Diagnostic K.K., Tokyo, Japan) or Taqman PCR methods (Cobas TaqMan HCV [auto] v2.0 Roche Diagnostic K.K., Tokyo, Japan). The serum HCV RNA level of each patient was classified as high (≥100 kilo copy/ml or 5.0 logU/ml) or low (<100 kilo copy/ml or 5.0 logU/ml). The HCV serotype was determined with an EIA kit (Imucheck F-HCV Gr1 and Gr2 reagent, International Reagent Corporation, Tokyo, Japan) according to the manufacturer's instructions.
Comparison of hematological and biochemical examinations
Serum concentrations of aspartate aminotransferase (AST), alanine aminotransferase (ALT), alanine phosphatase (ALP), γ-glutamyl transpeptidase (γ-GT), total bilirubin, total protein (TP), albumin (Alb), and zinc were determined, as well as the molar ratio of branched-chain amino acids to tyrosine (BTR), prothrombin times (PT), and platelet counts. In addition, serum concentrations of AFP were determined by EIA as a tumor marker. Furthermore, we compared Indocyanine green retention rate at 15 minutes (ICGR15) levels and OCT concentrations. The correlations between OCT concentrations and the above measurements were then analyzed. Serum zinc concentrations were evaluated by conventional atomic absorption spectrophotometry using a Z-6100 polarized Zeeman atomic absorption spectrophotometer (Hitachi, Tokyo, Japan).
Histological analysis of liver section
Liver biopsy specimens were obtained from the CH and LC patients by percutaneous needle biopsy (Tru-Cut soft tissue biopsy needles, 14 G, Baxter, Deerfield, IL, USA; or Hard monopty, 14 G, Medicon, Tokyo, Japan). The specimens were fixed in 10% to 20% buffered formalin and embedded in paraffin. The paraffin-embedded specimens were sliced into 3- to 4-µm sections and stained with haematoxylin and eosin (HE). Each liver biopsy specimen was analyzed semi-quantitatively by assigning a score to the following features: (1) degree of inflammatory cell infiltration (0 for none, 1 for minimal, 2 for mild, 3 for moderate, and 4 for severe) in the periportal, parenchymal, and portal areas; (2) severity (F stage) of fibrosis (0 for F0, 1 for F1, 2 for F2, 3 for F3, 4 for F4); (3) degree of lymphoid aggregates in the portal area (0 for none, 1 for mild, 2 for scattered, 3 for cluster, 4 for lymph follicle without germinal center, and 5 for lymph follicle with germinal center); (4) severity of portal sclerotic change, perivenular fibrosis, pericellular fibrosis, steatosis, and glycogen nuclei (each scored on a scale of 0-4 with 0 for none to 4 for severe); (5) severity of damage to the bile duct (on a scale of 0-4 with 0 for none to 4 for disappearance); (6) existence of bridging necrosis (0 for none, 1 for existence); (7) severity of irregular regeneration (IR) of hepatocytes (0 for none; 1 for <25% of the hepatocytes in the sample affected by anisocytosis and pleiomorphism of hepatocytes, bulging of the regenerated hepatocytes, map-like distribution, proliferation of atypical hepatocytes or oncocytes; 2 for 25-50% of the hepatocytes so affected; 3 for 50-75% of the hepatocytes so affected; 4 for all hepatocytes diffusely affected) as described by Ueno et al. [10].
Patients were diagnosed as having chronic hepatitis if they had been classified according to the new Inuyama system as F0 to F3 stage, and they were diagnosed as having LC if they had been classified as having F4 stage disease. All biopsy specimens were examined by the first author without knowledge of the patients' characteristics.
Long-term outcomes in patients
We compared the long-term outcomes for patients with CH or LC by the cumulative probability of occurrence of HCC according to whether their OCT concentrations placed them in the high (> 73.9 ng/ml) or low (< 73.9 ng/ml) groups. The high group consisted of patients with an OCT concentration above the median for all patients, and the low group consisted of those with an OCT concentration below the median.
Statistical analysis
Gender, blood and biochemical test results, liver histology, and serum OCT concentrations were compared using the chi-square test for independence. Cumulative incidence curves were determined using the Kaplan-Meier method, and the differences between groups were assessed using the log-rank test. The remaining parameters were compared using analysis of variance and Fisher's protected least significant difference post hoc test with Statview 4.5 software (Abacus Concepts, Berkeley, CA, USA). A p value of less than 0.05 was considered significant.
Results
Measurement of serum OCT concentrations
The median serum concentration of OCT in the 5 healthy control subjects was 21.8 ng/ml (median 10.88-61.18 ng/ml). The median OCT concentrations were 73.9 (3.20-489.36) ng/ml in all patients, and the median serum OCT concentrations in male and female subjects were 82.5 and 69.3 ng/ml (P=0.0578), respectively. In the clinical profiles, the median serum OCT concentrations showed no relationship to the patients' ages (>65 y, 72.5 ng/ml; <65 y, 76.5 ng/ml, P=0.4492). Furthermore, the median serum OCT concentration in chronic liver disease patients (F0 to F4 stage) was significantly related to HCV serotypes (type 1: n=141, 70.8 ng/ml; type 2: n=114, 78.0 ng/ml; P=0.0091), but there was no correlation with HCV RNA levels (low: n=45, 62.1 ng/ml; high: n=205, 76.9 ng/ml; P=0.3289).
Correlations between histological findings and concentrations of serum OCT
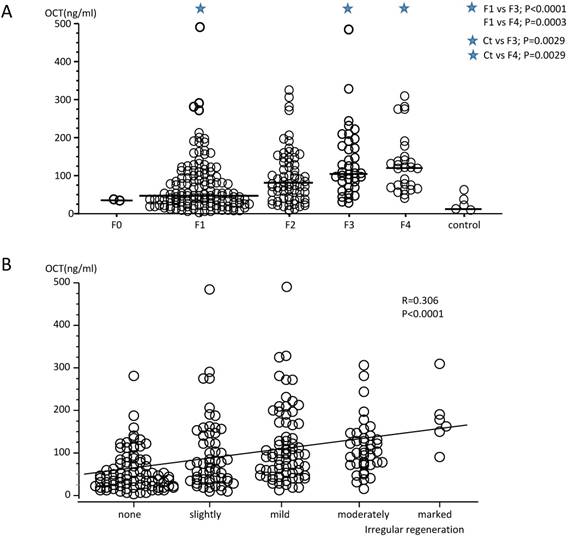
The median serum OCT concentrations in patients according to F stages were 36.7 (34.63-38.80 ng/ml for F0 stage, 48.7 (3.20-489.36) ng/ml for F1 stage, 77.9 (10.88-324.83) ng/ml for F2 stage, 104.8 (27.14-482.92) ng/ml for F3 stage, and 121.4 (41.59-309.0) ng/ml for F4 stage (Fig. 1). The median OCT concentrations in patients with F3 and F4 stages were statistically higher than those for patients with F1 stage, and OCT concentrations for F3 and F4 stages patients were also statistically higher than those for healthy control subjects. Therefore, the serum OCT concentrations increased significantly according to the progression of F stage (r=0.306, P<0.0001). The serum OCT concentrations in healthy control subjects did not differ from those measured in patients with F0 to F2 stage disease. There were significant but weak correlations between serum OCT concentrations and the degree of inflammatory cell infiltration in the periportal area (r=0.341, P<0.0001), the parenchymal area (r=0.341, P<0.0001), and the portal area (r=0.190,P=0.0022), and also with steatosis (r=265, P<0.0001), peri-cellular fibrosis (r=0.274, P<0.0001) and lymphoid aggregation (r=0.171, P=0.006, Table 2). Furthermore, there was a significant correlation between serum OCT concentrations and the degree of IR (total score; r=0.345, P<0.0001, Fig. 2). Therefore, the degree of intrahepatic necro-inflammatory reaction and the degree of IR in patients with CH or LC whose OCT concentrations were higher tended to also be high. There was no correlation between serum OCT concentrations and the degree of bile duct damage, pericellular fibrosis, perivenular fibrosis, portal sclerotic change, bridging necrosis, or glycogen nuclei (Table 2). However, the degree of IR (total score) and OCT concentrations were significantly correlated with F stage progression (F0+F1 stage, r=0.244, P=0.0058; F2 stage, r=0.382, P=0.0014; F3+F4 stage, r=0.194, P=0.0459). There were weak correlations between serum OCT concentrations and IR parameters; i.e., degree of dysplastic change (r=0.332, P<0.0001), Map-like distribution (r=0.169, P=0.0066), oncocytes (r=0.289, P<0.0001), and atypical hepatocytes (r=0.166, P=0.0078) (Table 2).
(A) Measurement of serum ornithine carbamoyltransferase (OCT) concentrations in patients with hepatitis C virus (HCV) RNA-positive chronic hepatitis (F1 to F4 stages) and in healthy subjects. The serum OCT concentrations in patients with F1 stage chronic liver disease were significantly lower than those of patients in the F3 and F4 stages. Serum OCT concentrations in healthy control subjects did not differ from those in patients with F1 to F2 stage disease, but differed from patients with F3 and F4 stage disease. (B) The degree of irregular regeneration of hepatocytes (irregular regeneration; IR score, total) and OCT concentrations were significantly correlated with the progression of disease F stage (r=0.306, P<0.0001). Severe IR was prevalent at high serum OCT concentrations.
Relationships among serum OCT concentrations and liver histology in patients with F0 to F4 stages.
| Parameter | r | P | |
|---|---|---|---|
| Irregular regeneration(IR) | |||
| Dysplastic change | 0.332 | <0.0001 | |
| Bulging | 0.080 | 0.1994 | |
| Map-like distribution | 0.169 | 0.0066 | |
| Oncocytes | 0.289 | <0.0001 | |
| Nodular arrangement | 0.110 | 0.0777 | |
| Atypical hepatocytes | 0.166 | 0.0078 | |
| Inflammatory cell infiltration | |||
| Peri-portal | 0.341 | <0.0001 | |
| Parenchymal | 0.341 | <0.0001 | |
| Portal | 0.190 | 0.0022 | |
| Portal lymphoid aggregation | 0.171 | 0.0060 | |
| Bile duct damage | 0.073 | 0.2482 | |
| Portal sclerosis | 0.063 | 0.3151 | |
| Pre-venular fibrosis | 0.117 | 0.0617 | |
| Peri-cellular fibrosis | 0.274 | <0.0001 | |
| Bridging necrosis | 0.065 | 0.2971 | |
| Steatosis | 0.265 | <0.0001 | |
| Glycogen nuclei | -0.014 | 0.8288 | |
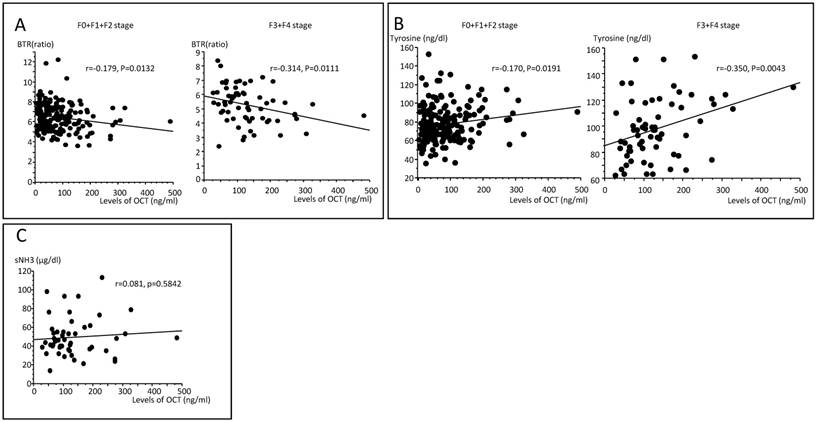
(A) Correlations between the molar ratio of branched-chain amino acids to tyrosine (BTR) and OCT concentrations in serum according to F0+F1+F2 and F3+F4 stages. A significant correlation was seen only for patients with F3+F4 disease (r=-0.314, P=0.0111). (B) Correlations between tyrosine and OCT concentrations in serum according to F0+F1+F2 stages and F3+F4 stages. A significant correlation was seen only for patients with F3+F4 stage disease (r=-0.350, P=0.0043). (C) There was no association between serum NH3 and OCT concentrations in patients with F3 and F4 stage disease (r=0.081, P=0.5842).
Correlation of serum OCT concentration with clinical profiles and results of blood and biochemical examinations
Serum OCT concentrations showed significant correlations with AST (r=0.808, P<0.0001), ALT (r=0.780, P<0.0001), γ-GT (r=0.390, P<0.0001), ALP (r=03.29, P<0.0001), platelet counts (r=-0.249, P=0.0001), PT (r=-0.239,P=0.0001), ICG15R (r=0.444,P<0.0001), and AFP (r=0.304, P=0.0001). There were no significant correlations between serum OCT concentrations and TP or albumin levels (Table 3).
Relationships among serum OCT concentrations and blood and biochemical examinations
| Parameter | r | P |
|---|---|---|
| Blood and Serological Examination. | ||
| AST | 0.808 | <0.0001 |
| ALT | 0.780 | <0.0001 |
| r-GT | 0.390 | <0.0001 |
| ALP | 0.329 | <0.0001 |
| Total bilirubin | 0.137 | 0.0285 |
| Platelet counts | -0.239 | 0.0001 |
| Total protein | 0.109 | 0.854 |
| Albumin | -0.093 | 0.2381 |
| Prothrombin time | -0.229 | 0.0003 |
| BTR | -0.295 | <0.0001 |
| BCAA | 0.027 | 0.6695 |
| Tyrosine | 0.315 | <0.0001 |
| Ammonia | 0.081 | 0.5842 |
| ICGR15 | 0.444 | <0.0001 |
| Alpha feto protein | 0.099 | 0.2358 |
| Zinc | -0.063 | 0.3262 |
AST; aspartate aminotransferase , ALT; alanine aminotransferase, alanine phosphatase (ALP), γ- GT; γ-glutamyl transpeptidase (γ-GT), BTR; branched chain amino acid to tyrosine molar ratio, BCAA; branched chain amino acids, ICGR15; indocyanine green retention rate 15min.
Next, we examined associations with OCT concentrations in patients at F0+F1+F2 stage versus F3+F4 stage. An R-value of 0.30 or more was used as the threshold for identifying positive correlations. Displastic change (r=0.3355, P<0.0001), atypical hepatocytes (r=0.3490, P=0.0009), the degree of inflammatory cell infiltration of the periportal area (r=0.3377, P<0.0001), and parenchyma area (r=0.3352, P0.0001) were identified as significantly correlated with OCT concentrations in the F0+F1+F2 stage group. Conversely, in the F3+F4 group, none of the factors were significantly associated with OCT concentrations.
Correlations between serum OCT concentrations and BTR
The serum concentrations of OCT and tyrosine were weakly correlated with early F stages (r=-0.170, P=0.0191, Fig. 1A) and more strongly correlated with more advanced F stages (r=-0.350, P=0.0043, Fig.1B). There were significant correlations between serum OCT concentrations and BTR (r=-0.295, P<0.0001) and tyrosine (R=0.315, P<0.0001) levels, but not between serum OCT and branched chain amino acids (BCAA; r=0.027, P=0.6695). Comparing early F stages (F0+F1) and more advanced F stages (F2+F3+F4), the serum concentrations of OCT and BTR were weakly correlated with early F stages (r=-0.179, P=0.0132) and more strongly correlated with more advanced F stages (r=-0.314, P=0.0111, Fig. 2A).
BCAA and tyrosine, showed no significant correlations between serum OCT concentrations and BCAA in either early or more developed F stages, but there were significant correlations between serum OCT concentrations and tyrosine in early (r=0.170, P=0.0191) and more developed F stages (r=0.350, P=0.0043, Fig. 2B). In addition, the association between serum NH3 and OCT concentrations was examined only for patients at F3+F4 stage disease. There were no correlations between serum NH33 and serum OCT concentrations in patients with F3+ F4 stage disease (Fig. 2C).
Correlations between serum cytokines/chemokines and serum OCT concentrations
There were significant correlations between serum OCT concentrations and levels of IP-10 (r=0.411, P<0.0001) and IL-18 (r=0.342, P=0.001). There were also weak correlations between serum OCT concentrations and HGF (r=0.276, P=0.0089) and MIG (r=0.241, P=0.0236) (Table 4).
Relationships among serum OCT concentrations and cytokines and chemokines levels
| R | P | |
|---|---|---|
| CTACK | -0.032 | 0.7660 |
| GROα | 0.011 | 0.9214 |
| IL-1α | 0.012 | 0.9143 |
| IL-2Rα | 0.066 | 0.5409 |
| IL-3 | 0.123 | 0.2537 |
| IL-12p40 | -0.017 | 0.8771 |
| IL-16 | 0.064 | 0.5525 |
| IL-18 | 0.342 | 0.0010 |
| LIF | -0.074 | 0.4921 |
| MCP-3 | 0.052 | 0.6289 |
| M-CSF | 0.080 | 0.4626 |
| MIF | 0.099 | 0.3574 |
| MIG | 0.241 | 0.0236 |
| b-NGF | 0.072 | 0.5080 |
| SCF | 0.014 | 0.8963 |
| SCGF-β | 0.208 | 0.0513 |
| SDF-1γ | -0.011 | 0.9166 |
| TNF-β | -0.014 | 0.8963 |
| TRAIL | -0.124 | 0.2509 |
| HGF | 0.276 | 0.0089 |
| IFN-α2 | 0.195 | 0.0692 |
| platelet-derived growth factor -bb | -0.204 | 0.0570 |
| IL-1β | -0.001 | 0.9938 |
| IL-1α | -0.025 | 0.8159 |
| IL-2 | -0.044 | 0.6853 |
| IL-4 | -0.019 | 0.8598 |
| IL-5 | -0.020 | 0.8557 |
| IL-6 | 0.041 | 0.7046 |
| IL-7 | -0.035 | 0.7435 |
| IL-8 | 0.043 | 0.6935 |
| IL-9 | -0.118 | 0.2752 |
| IL-10 | -0.013 | 0.9020 |
| IL-12(p70) | -0.126 | 0.2423 |
| IL-13 | -0.039 | 0.7215 |
| IL-15 | -0.114 | 0.2902 |
| IL-17 | -0.103 | 0.3423 |
| Eotaxin | -0.042 | 0.7011 |
| FGF basic | -0.043 | 0.6948 |
| G-CSF | -0.002 | 0.9881 |
| GM-CSF | -0.081 | 0.4540 |
| IFN-γ | -0.038 | 0.7246 |
| IP-10 | 0.411 | <0.0001 |
| MCP-1(MCAF) | 0.005 | 0.9652 |
| MIP-1α | -0.035 | 0.7484 |
| MIP-1β | 0.162 | 0.1324 |
| RANTES | -0.020 | 0.8550 |
| TNF-α | -0.037 | 0.7303 |
| VEGF. | -0.180 | 0.0941 |
We next examined the variables associated with serum OCT concentrations in the Low group and High group. The IP-10 level (r=0.3102, P=0.0456) was the only significantly correlated factor in the High group. There were significant correlations with IL-18 (r=0.3502, P=0.0311), MIG (0.3981, P=0.0133), and HGF (r=0.3835, P=0.0175) in the Low group.
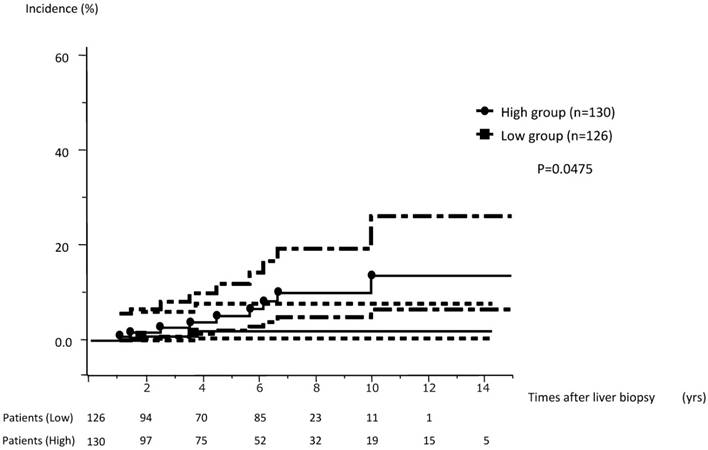
Relationship between OCT concentration and cumulative incidence of HCC
The cumulative incidence of HCC among 256 subjects who were available for more than 1 year of follow-up was analyzed. These 256 subjects were divided into a high concentration group and a low concentration group consisting of those with OTC concentrations above or below the median value, respectively. The cumulative incidence of HCC in the high-level group (serum OCT concentrations ≥73.9 ng/ml, range 1.033-14.049 y, median observation period 5.655 y) was significantly higher than that of the low level group (<73.9 ng/ml, range 1.030-13.066 y, median observation period 4.956 y) for subjects with F0-F4 stage disease (P=0.0475, Fig. 3).
The cumulative incidence of HCC in the high concentration group (≥73.9 ng/ml) was significantly higher than that seen for the low concentration group (<73.9 ng/ml).
Discussion
OCT is an important enzyme in the urea cycle. OCT is produced almost exclusively in the liver and it is localized in the mitochondria of hepatocytes. Therefore, deviations in blood concentrations of OCT can serve as a sensitive indicator of destruction of hepatocytes, hepatocyte disorders, and liver damage [1, 2]. We found that serum OCT concentrations were significantly correlated with ICGR15 and PT levels in the present study. The OCT concentration served as a useful index of liver disorders and liver preparatory ability in patients with CH and LC. Serum OCT concentrations increased in patients along with the progression to more severe F stages and reduced platelet counts. Furthermore, our results show that the serum OCT concentrations in F4 stage patients were higher than those in patients with F0 to F3 stages. Therefore, serum OCT concentrations accurately indicated the extent of liver fibrosis in CH and LC. Serum OCT concentrations were significantly lower in subjects who had higher BTR levels. Conversely, serum OCT concentrations were significantly higher in subjects who had higher tyrosine concentrations. In addition, serum OCT concentrations were significantly correlated with BTR levels and tyrosine concentrations. Since the serum OCT concentrations are directly associated with hepatocellular damage and liver dysfunction, this measurement could be used to detect liver disorders and to monitor long-term progression and outcomes of chronic liver diseases.
OCT is a zinc-associated enzyme and its presence is demonstrated by the existence of zinc. Therefore, the activity of OCT can be indicated by zinc metabolic states in the liver. As chronic liver disease progresses, the liver falls into a severely low zinc metabolism state that can proceed to hypoalbuminemia as well as an absorption disorder caused by the small intestine mucous membrane epithelium cell destruction, and so on. Therefore, a low zinc metabolism state reduces OCT activity, and this negatively impacts the urea cycle. Exacerbation and protraction of liver failure symptoms including hepatic encephalopathy due to hypometabolism of ammonia are closely related to OCT activity [4, 5]. Although the present study showed no correlation between serum ammonia and OCT concentrations, the serum OCT concentrations did correlate with levels of BTR and tyrosine. Serum OCT concentration showed no correlation with serum albumin, BCAA, or zinc. Furthermore, serum ammonia levels and OCT concentrations did not show a statistical correlation because we limited this examination to subjects who were at F3 or F4 disease stages and who were assigned a Child-Pugh classification of A. Furthermore, serum cytokine and chemokine levels were measured in order to examine their relationships to serum OCT concentrations. Serum OCT concentrations were significantly correlated with IP-10 and IL-18 levels. It was recently reported that changes in IP-10 levels mirror HCV RNA levels, suggesting that IP-10 is an indicator of innate immune viral recognition. Moreover, serum interferon-γ-inducible protein-10 (IP-10) is an independent predictive factor of sustained virological response (SVR) in CH-C [11, 12]. Thus IP-10 levels could indicate HCV or HBV infection. However, there have been no reports of correlations between OCT and IP-10 in CH-C. In addition, IP-10 is suggested to have an anti-tumor effect. Wang and colleagues [13] estimated that expression of IP-10 in patients with glioma was accompanied by inhibition of tumor angiogenesis and enhancement of cytotoxicity, thereby increasing the numbers of brain-infiltrating lymphocytes and prolonging the residence time of CTLs in the tumor. IL-18 is a factor that drives production of IFN-γ from T cells, and it is therefore grouped with the Th1 cytokines. IL-18 levels have also been associated with allergy and inflammatory diseases. One report indicated that IL-18 genotypes are associated with susceptibility to chronic hepatitis B infection and severity of liver injury [14]. However, there have been no reports of associations between IL-18 and either OCT or IP-10. IP-10 is produced by monocytes as part of the endothelial response to IFN-γ. On the other hand, since IL-18 also participates in production of IFN-γ, OCT may be able to activate IFN-γ production. Moreover, it has been reported that zinc increases Th1 cell differentiation by up-regulation of IFN-γ [15]. Associations between IP-10, IL-18, and OCT were not established in the present study. However, intracellular Zip6, which is a zinc transporter, affects both intracellular zinc concentrations and intracellular OCT; therefore, OCT levels may be related to production of IP-10 and IL-18 [16]. In addition, there seems to be an association between OCT and IFN-γ, since both IP-10 and IL-18 levels were associated with IFN-γ levels.
Next, we examined whether there were correlations between the liver histology results and serum OCT concentrations in patients with F1 to F4 stage disease. We found that serum OCT concentrations correlated with necro-inflammatory reactions in the liver, and that subjects with higher serum OCT concentrations tended to have stronger necro-inflammatory reactions. Serum OCT concentrations were also correlated with the degree of steatosis and with the degree of pericellular fibrosis, but these correlations were weak. Serum OCT concentrations increased with the degree of steatosis and pericellular fibrosis. Therefore, we confirmed that OCT concentrations reflected the histopathological findings in subjects with CH and LC. IR total scores and serum OCT concentrations were significantly but weakly correlated with the degree of dysplastic change and with the number of oncocytes and atypical hepatocytes.
We previously reported that the degree of IR in liver biopsy specimens is a good histological indicator of a highly carcinogenic state in the liver of subjects with CH and LC. Therefore, we expected that high serum OCT concentrations would also be indicative of a highly carcinogenic state in the liver. Serum OCT concentrations and the degree of IR correlated well in liver biopsy specimens, and the cumulative incidence of HCC in subjects with high serum OCT concentrations was increased compared to the incidence in subjects with CH and LC but low serum OCT concentrations. Therefore, the measurement of serum OCT concentrations may produce meaningful long-term outcome predictions for patients at high risk of developing HCC. There have not been any detailed published reports of correlations between serum OCT concentrations and a highly carcinogenic state in the liver of subjects with CH and LC. Examination of serum OCT concentrations may be useful to evaluate high-risk subjects with CH and LC who could progress to HCC, and this assay may serve as a new biomarker indicating the occurrence or an increased risk of HCC.
There have been many previous reports of OCT deficiency (OTCD). The relationship between single nucleotide polymorphisms and OTCD disease development has been pointed out in recent years (17, 18). A recent review of OCT deficiency and gene mutations revealed that early stage urea cycle disorders are associated with hepatocellular damage and liver dysfunction [19]. This relationship may contribute to a heightened risk of HCC incidence. An author of this review estimated that underlying urea cycle defects may have caused HCC in these patients [19-21]. Therefore, evaluation of the serum OCT concentrations in patients with CH-C and LC can be used to assay disease activity and to identify patients who are at increased risk for developing HCC. The measurement of serum OCT concentrations in patients with liver diseases thus may have important clinical implications.
In conclusion, measurement of serum OCT concentrations may provide a useful marker of disease activity and liver function. Furthermore, our results suggest that elevated serum OCT concentrations may indicate a highly carcinogenic state of the liver. The determination of serum OCT concentrations can be used to identify patients at high risk for developing HCC.
Our study shows that serum OCT concentrations were correlated with the degree of IR in patients with F0 to F4 stage disease. Our findings suggest that when the degree of IR is significant, CH-C and LC patients have an increased risk of developing HCC. The serum OCT concentrations were correlated with the degree of IR, indicative of a carcinogenic state in the liver. Therefore, serum OCT levels may reflect the carcinogenic state of the liver in patients with CH-C and LC. The availability of a serum marker that indicates the degree of IR should be useful for the early diagnosis and prevention of HCC development because a liver biopsy is difficult and risky for patients with type C chronic liver diseases.
Acknowledgements
Measurement of serum OCT concentration was performed by Yamasa Corporation. The author thanks Hiroshi Murayama who measured the serum OCT concentrations.
Competing Interests
The authors have declared that no competing interest exists.
References
1. Mizutani A. Cytochemical demonstration of ornithine carbamoyltransferase activity in liver mitochondria of rat and mouse. J Histochem Cytochem. 1968;16:172-80
2. Mizutani A, Fujita H. Significance of fixation in the cytochemical demonstration of ornithine carbamoyltransferase activity-with special reference to aldehyde perfusion. Bull Chest Dis Res Inst Kyoto Univ. 1968;2:1-10
3. Tokushige K, Hashimoto E, Noto H. et al. Clinical significance of serum ornithine carbamoyltransferase in patients with non-alcoholic steatohepatitis. Hepatol Res. 2009;39:939-43
4. Matsushita N, Hashimoto E, Tokushige K. et al. Investigation of ornithine carbamoyltransferase as a biomarker of liver cirrhosis. Intern Med. 2014;53:1249-57
5. Tang N, Wang Y, Wang X. et al. Stable overexpression of arginase I and ornithine transcarbamylase in HepG2 cells improves its ammonia detoxification. J Cell Biochem. 2012;113:518-27
6. Watanabe Y, Mori S, Fujiyama S. et al. Clinical evaluation of serum ornithine carbamoyltransferase by enzyme-linked immunosorbent assay in patients with liver diseases. Enzyme Protein. 1994;48:18-26
7. Murayama H, Ikemoto M, Hamaoki M. Ornithine carbamyltransferase is a sensitive marker for alcohol-induced liver injury. Clin Chim Acta. 2009;401:100-4
8. Murayama H, Ikemoto M, Nagata A. J Gastroenterol Hepatol. Marked elevation of serum mitochondrion-derived markers in mild models of non-alcoholic steatohepatitis in rats. 2009;24:270-7
9. Murayama H, Fukuda Y, Tsunekawa S. et al. Ratio of serum ornithine carbamoyltransferase to alanine aminotransferase as a potent indicator for hepatocellular carcinoma. Clin Biochem. 2007;40:1077-80
10. Ueno Y, Moriyama M, Uchida T. et al. Irregular regeneration of hepatocytes is an important factor in the hepatocarcinogenesis of liver disease. Hepatology. 2001;33:357-62
11. Carlin AF, Aristizabal P, Song Q. et al. Temporal dynamics of inflammatory cytokines/chemokines during Sofosbuvir and Ribavirin therapy for Genotype 2 and 3 Hepatitis C infection. Hepatology. 2015 Jul 3. doi: 10.1002/hep.27971. [Epub ahead of print]
12. Raziky ME, Elsharkawy A, Said SE. et al. IP-10 Serum Level in Chronic Hepatitis C Virus Patients: Relation to Fibrosis and Response to Combined Interferon/Ribavirin Therapy. J Interferon Cytokine Res. 2015;35:649-53
13. Wang X, Zhang FC, Zhao HY. et al. Human IP10-scFv and DC-induced CTL synergistically inhibit the growth of glioma in a xenograft model. Tumour Biol. 2014;35:7781-91
14. Ferreira SD, Chachá SG, Souza FF. et al. IL-18, TNF, and IFN-γ alleles and genotypes are associated with susceptibility to chronic hepatitis B infection and severity of liver injury. J Med Virol. 2015;87:1689-96
15. Bao B, Prasad AS, Beck FW. et al. Intracellular free zinc up-regulates IFN-γ and T-bet essential for Th1 differentiation in Con-A stimulated HUT-78 cells. Biochem Biophys Res Commun. 2011;407:703-7
16. Aydemir TB, Liuzzi JP, McClellan S. et al. Cousins RJ. Zinc transporter ZIP8 (SLC39A8) and zinc influence IFN-gamma expression in activated human T cells. J Leukoc Biol. 2009;86:337-48
17. Gordon N. Ornithine transcarbamylase deficiency: a urea cycle defect. Eur J Paediatr Neurol. 2003;7:115-21
18. Gallant NM, Gui D, Lassman CR. et al. Novel liver findings in ornithine transcarbamylase deficiency due to Xp11.4-p21.1 microdeletion. Gene. 2015;556:249-53
19. Wilson JM, Shchelochkov OA, Gallagher RC. et al. Hepatocellular carcinoma in a research subject with ornithine transcarbamylase deficiency. Mol Genet Metab. 2012;105:263-5
20. Tuchman M, Lee B, Lichter-Konecki U. et al. Cross-sectional multicenter study of patients with urea cycle disorders in the United States. Mol Genet Metab. 2008;94:397-402
21. Erez A, Shchelochkov OA, Plon SE. et al. Insights into the pathogenesis and treatment of cancer from inborn errors of metabolism. Am J Hum Genet. 2011;88:402-21
Author contact
![]() Corresponding author: Mitsuhiko Moriyama, Division of Gastroenterology and Hepatology, Department of Medicine, Nihon University School of Medicine, 30-1 Oyaguchi kamimachi, Itabashiku, Tokyo 173-8610, Japan. Tel: 81-3-3972-8111, ext 2423 Fax: 81-3-3956-8496 E-mail: moriyama.mitsuhikoac.jp
Corresponding author: Mitsuhiko Moriyama, Division of Gastroenterology and Hepatology, Department of Medicine, Nihon University School of Medicine, 30-1 Oyaguchi kamimachi, Itabashiku, Tokyo 173-8610, Japan. Tel: 81-3-3972-8111, ext 2423 Fax: 81-3-3956-8496 E-mail: moriyama.mitsuhikoac.jp