Impact Factor ISSN: 1449-1907

 Global reach, higher impact
Int J Med Sci 2025; 22(15):4077-4084. doi:10.7150/ijms.116287 This issue Cite
Research Paper
Exploring the relationship between exercise and diabetes risk in a prediabetes population
Chih-Wei Chiang1,2,3, Oswald Ndi Nfor1, Wen-Yu Lu1, Chien-Ning Huang4,5 ![]() , Yung-Po Liaw1,4,6
, Yung-Po Liaw1,4,6 ![]()
1. Department of Public Health and Institute of Public Health, Chung Shan Medical University, Taichung City 40201, Taiwan.
2. College of Health Care and Management, Chung Shan Medical University, Taichung City 40201, Taiwan.
3. Department for Nursing, Jen-Teh Junior College of Medicine, Nursing and Management, Miaoli County 456, Taiwan.
4. Institute of Medicine, Chung Shan Medical University, Taichung City 40201, Taiwan.
5. Department of Internal Medicine, Chung Shan Medical University Hospital, Taichung City 40201, Taiwan.
6. Department of Medical Imaging, Chung Shan Medical University Hospital, Taichung City 40201, Taiwan.
Received 2025-4-23; Accepted 2025-9-4; Published 2025-9-22
Abstract

The global incidence of prediabetes is on the rise, with an estimated 5 to 10% of individuals expected to transition to diabetes. We investigated factors associated with the progression of prediabetes to diabetes. Our primary data source was the Taiwan Biobank (TWB). The main outcome was the development of diabetes during the follow-up period among individuals who were initially diagnosed with prediabetes. We included 4,958 participants from the TWB, who were divided into four groups based on their levels of exercise. The exercise status of participants was assessed based on questionnaire responses collected during the enrollment and follow-up phases. Participants were categorized into one of the following groups: no exercise, transition from no exercise to exercise, transition from exercise to no exercise, and regular exercise. We used multiple logistic regression to establish the analysis model, which comprised 2,891 women and 2,067 men. The exercise group, comprising individuals who consistently engaged in exercise both at enrollment and during the follow-up period, exhibited a lower risk of developing diabetes (odds ratio [OR] = 0.755; 95% confidence interval [CI] = 0.640-0.892) compared to the no exercise group. When stratified by gender, the exercise group remained significantly associated with a reduced risk of diabetes in both women (OR = 0.752, 95% CI = 0.602-0.940) and men (OR = 0.762, 95% CI = 0.591-0.982). This study provides evidence of a significant association between maintaining regular exercise habits and a lower risk of diabetes among Taiwanese adults with prediabetes.
Keywords: disease prevention, epidemiology, physical activity, risk
Introduction
Individuals with prediabetes eventually develop diabetes, with roughly 10% transitioning to diabetes annually in the United States, although the conversion rates differ based on disease definition and population characteristics [1, 2]. Prediabetes, an intermediate stage of glucose dysregulation that often precedes type 2 diabetes (T2D), affected around 720 million individuals globally in 2021 [1, 3]. By 2045, it is estimated to affect 1 billion people worldwide. T2D significantly elevates the risk of heart disease, stroke, and other severe cardiovascular health issues, contributing to disease mortality and morbidity [4]. The rising prevalence of prediabetes on a global scale represents a significant public health issue and is concerning in light of the expanding diabetes epidemic and its associated complications [5].
Prediabetes is a state with elevated blood sugar levels that are higher than normal but not yet at the diabetes threshold, indicating a high risk for developing diabetes [2]. It is a multifaceted metabolic condition characterized by several risk factors that mirror those associated with type T2D. These include family history, the presence of concurrent chronic conditions (such as hypertension and dyslipidemia), and behavioral risk factors [6]. Among these, overweight, obesity, and dietary habits are the most predominant factors [1]. In Taiwan, diabetes is one of the top ten causes of death, and in recent years, there has been an increasing trend in diabetes-related mortality. In the year 2022, the number of deaths due to diabetes increased by 7.3% compared to the previous year [7].
A meta-analysis revealed that individuals with prediabetes at baseline exhibited elevated mortality rates and increased incidence of cardiovascular events [8]. Research conducted on diabetes prevention in China, Finland, and the United States reported annual progression rates from prediabetes to diabetes in their control groups, varying between 5.8% and 18.3% [9-11]. Intensive lifestyle modifications and community mobilization against prediabetes can effectively lower diabetes incidence [12, 13].
According to the National Nutrition and Health Survey in Taiwan conducted between 2017 and 2020, approximately 25.5% of adults aged 19 and older have fasting blood sugar (FBS) levels that meet the prediabetic threshold [14]. This threshold is defined as a FBS level ranging from 100 to 125 mg/dL, or 5.6 to 6.9 mmol/L. Approximately 35.8% (about 6.5 million people) of Taiwanese adults have FBS levels reaching the prediabetic threshold [15]. A study in Taiwan suggested that when FBS reaches prediabetic levels, there is a significant increase in cardiovascular disease and diabetes mortality rates [16]. Therefore, it is essential to prevent or treat prediabetes aggressively [17]. Moreover, a healthy aging longitudinal study in Taiwan (HALST) found that individuals with prediabetes who had higher health scores (including diet, exercise, and psychological state) and a normal waist circumference had a lower risk of diabetes [18]. To prevent the onset of diabetes, it is essential to implement targeted health behavior interventions for high-risk populations, including those with prediabetes.
To date, there have been relatively few studies in Taiwan that simultaneously examined prediabetes and modifiable behaviors, often with small sample sizes. This study aimed to investigate the factors associated with the progression of prediabetes to diabetes.
Material and Methods
Study population
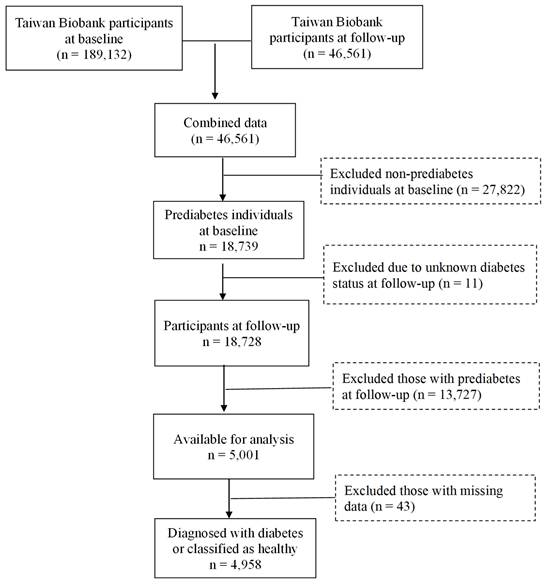
Data for this study were obtained from the TWB, which is a voluntary repository for Taiwanese adults between the ages of 30 and 70, with no history of cancer. During enrollment, participants gave their written informed consent and underwent physical examinations at assessment centers. Blood and urine samples were collected for analysis. Lifestyle data were obtained through the biobank questionnaires. The current study focused on participants recruited from the Biobank between 2008 and 2019, with follow-up conducted from 2011 to 2022. The selection process is illustrated in Figure 1. Initially, 189,132 individuals were assessed at baseline, with 46,561 participants completing the follow-up. Among these 27,822 baseline non-prediabetes cases were excluded, leaving 18,739 individuals identified as having prediabetes. At follow-up, 13,727 individuals who still had prediabetes, as well as those with unknown diabetes status (n=11), were excluded, resulting in 5,001 individuals available for analysis. After removing 43 individuals with missing data, 4,958 remained, classified as either having developed diabetes (n = 1,878) or as being healthy (n = 3,080), as shown in Table 1. Approval for this study was provided by the Institutional Review Board of Chung Shan Medical University (IRB: CS1-23101).
Flowchart of the study population.
Demographic characteristics of the study population based on exercise status
| Variables | No exercise | No exercise to exercise | Exercise to no exercise | Exercise | P-value |
|---|---|---|---|---|---|
| (n = 2010) | (n = 672) | (n = 538) | (n = 1738) | ||
| Diabetes, n (%) | 0.0701 | ||||
| No | 1238 (61.59) | 425 (63.24) | 310 (57.62) | 1107 (63.69) | |
| Yes | 772 (38.41) | 247 (36.76) | 228 (42.38) | 631 (36.31) | |
| Gender, n (%) | 0.4505 | ||||
| Women | 1177 (58.56) | 408 (60.71) | 313 (58.18) | 993 (57.13) | |
| Men | 833 (41.44) | 264 (39.29) | 225 (41.82) | 745 (42.87) | |
| Age, years (mean ± SE) | 51.980 ± 0.224 | 56.100 ± 0.390 | 56.831 ± 0.437 | 61.01 ± 0.195 | <0.0001 |
| Smoking, n (%) | 0.3142 | ||||
| No | 1556 (77.41) | 516 (76.79) | 417 (77.51) | 1383 (79.57) | |
| Yes | 454 (22.59) | 156 (23.21) | 121 (22.49) | 355 (20.43) | |
| Alcohol consumption, n (%) | 0.6200 | ||||
| No | 1754 (87.26) | 590 (87.80) | 460 (85.50) | 1505 (86.59) | |
| Yes | 256 (12.74) | 82 (12.20) | 78 (14.50) | 233 (13.41) | |
| Waist-hip ratio | 0.5874 | ||||
| Normal (men ≤ 0.9; women ≤ 0.85) | 789 (39.25) | 280 (41.67) | 221 (41.08) | 713 (41.02) | |
| Abnormal (men >0.9; women >0.85) | 1221 (60.75) | 392 (58.33) | 317 (58.92) | 1025 (58.98) | |
| BMI categories, n (%) | <0.0001 | ||||
| Normal weight (18.5≤BMI<24 kg/m2) | 763 (37.96) | 299 (44.49) | 199 (36.99) | 855 (49.19) | |
| Underweight (BMI<18.5 kg/m2) | 40 (1.99) | 22 (3.27) | 12 (2.23) | 40 (2.30) | |
| Overweight (24≤BMI<27 kg/m2) | 568 (28.26) | 198 (29.46) | 168 (31.23) | 524 (30.15) | |
| Obesity (BMI≥27 kg/m2) | 639 (31.79) | 153 (22.77) | 159 (29.55) | 319 (18.35) | |
| Uric acid, n (%) | 0.0040 | ||||
| Normal (women ≤ 6; men ≤ 7) | 1541 (76.67) | 536 (79.76) | 413 (76.77) | 1412 (81.24) | |
| Abnormal (women > 6; men > 7) | 469 (23.33) | 136 (20.24) | 125 (23.23) | 326 (18.76) | |
| Coffeeconsumption | 0.7367 | ||||
| No | 1127 (56.07) | 374 (55.65) | 291 (54.09) | 987 (56.79) | |
| Yes | 883 (43.93) | 298 (44.35) | 247 (45.91) | 751 (43.21) | |
| Vegetarian diet | 0.7552 | ||||
| No | 1821 (90.60) | 613 (91.22) | 489 (90.89) | 1592 (91.60) | |
| Yes | 189 (9.40) | 59 (8.78) | 49 (9.11) | 146 (8.40) | |
| Hypertension | <0.0001 | ||||
| No | 1638 (81.49) | 537 (79.91) | 415 (77.14) | 1301 (74.86) | |
| Yes | 372 (18.51) | 135 (20.09) | 123 (22.86) | 437 (25.14) | |
| Hyperlipidemia | 0.0060 | ||||
| No | 1761 (87.61) | 590 (87.80) | 452 (84.01) | 1464 (84.23) | |
| Yes | 249 (12.39) | 82 (12.20) | 86 (15.99) | 274 (15.77) | |
| Follow-up duration | 1632.380 ± 10.054 | 1656.110 ± 17.141 | 1651.340 ± 20.235 | 1536.030 ± 10.387 | <0.0001 |
Abbreviations: n, sample size; %, percent; BMI, body mass index; kg, kilogram; m2, meter squared.
Variable definition
To ensure the integrity of our analysis, individuals diagnosed with T2D or any other form of diabetes at baseline were excluded from the study. Diabetes was defined according to established criteria: a fasting blood glucose level of ≥ 126 mg/dL, an HbA1c level of ≥ 6.5%, or self-reported physician-diagnosed diabetes based on participant questionnaires. Additionally, prediabetes was defined as a FBS level ranging from 100 to 125 mg/dL or an HbA1c level between 5.7% and 6.4%.
Lifestyle data, including exercise habits, were obtained through a comprehensive questionnaire administered by the TWB during the enrollment and follow-up stages. Individuals were classified as engaging in regular exercise if they exercised at least three times per week, with each session lasting 30 minutes or more, over the past three months. Exercise types considered in this analysis included a variety of physical activities, as defined by the TWB, encompassing aerobic exercises such as walking and jogging, anaerobic exercises like weight training and ball sports (including basketball and tennis), as well as traditional practices like Qigong.
The study participants were classified into four groups: (1) the “no exercise” group: included participants who had no excercise habit at both enrollment and follow-up; (2) the “no exercise to exercise” group: consisted of participants who did not have an exercise habit at enrollment but began exercising regularly during the follow-up period; (3) the “exercise to no exercise” group: comprised participants who had an exercise habit at enrollment but ceased exercising during the follow-up; and (4) the “exercise” group: included participants who maintained an exercise habit (i.e., exercising more than three times per week and at least 30 minutes each time) at both enrollment and follow-up. Additionally, the group labeled "no diabetes" referred to individuals who had prediabetes at enrollment but returned to a healthy state during follow-up. In contrast, the "diabetes" group included individuals who had prediabetes at enrollment and progressed to diabetes during follow-up. Our models included well-documented variables associated with diabetes, both inversely and positively, such as gender [19], age [20], smoking [21] alcohol consumption [22], waist-hip ratio/BMI [23], uric acid levels [24], coffee consumption [25], a vegetarian diet [26], follow-up duration, and hypertension and hyperlipidemia [27]. Notably, the inclusion of coffee intake and a vegetarian diet as covariates reflects their significance in diabetes research. Specifically, studies have indicated that moderate coffee consumption may be linked to a reduced risk of T2D, potentially due to its antioxidant properties and effects on insulin sensitivity. Similarly, a vegetarian diet is associated with lower body weight and improved metabolic health, which are important factors in diabetes management.
Statistical analysis
Statistical analysis was performed using the SAS 9.4 version (SAS Institute, Cary, NC, USA). Chi-square tests and ANOVA were used for demographic analysis to assess differences between categorical and continuous variables, respectively. Logistic regression models were used to examine the association between exercise status and diabetes in individuals with prediabetes. The significance level for the analysis was set at 0.05.
Results
Table 1 presents the basic characteristics of the study population according to exercise status. There were 4,958 participants, with 2,891 women (58.31%) and 2,067 men (41.69%). Regarding the occurrence of diabetes, no statistically significant differences were observed among the exercise groups (P = 0.0701). In the "no exercise" group, there were 1,238 (61.59%) participants without diabetes and 772 (38.41%) participants with diabetes. Similarly, in the "no exercise to exercise" group, there were 425 (63.24%) participants without diabetes and 247 (36.76%) participants with diabetes. In the "exercise to no exercise" group, there were 310 (57.62%) participants without diabetes and 228 (42.38%) participants with diabetes. Lastly, in the "exercise" group, there were 1,107 (63.69%) participants without diabetes and 631 (36.31%) participants with diabetes. The mean age (± SE) for the study population was 51.980 years (± 0.224) in the "no exercise" group, 56.100 years (±0.390) in the "no exercise to exercise" group, and 56.831 years (± 0.437) in the "exercise" group. Other variables that differed among the various groups included BMI (P < 0.0001), uric acid (P = 0.0040), hypertension (P < 0.0001), hyperlipidemia (P = 0.0060), and follow-up duration (P < 0.0001).
Table 2 displays the logistic regression analysis examining the association between exercise status and diabetes in the prediabetes population. Among the various groups, only the "exercise" group demonstrated a significant association with a lower risk of diabetes (OR = 0.755; 95% CI = 0.640-0.892) compared to the "no exercise" group. However, the "no exercise to exercise" group (OR = 0.882; 95% CI = 0.716-1.087) and the "exercise to no exercise" group (OR = 0.994; 95% CI = 0.795-1.244) did not show a significant association with diabetes.
The association between exercise status and diabetes risk in the pre-diabetes population
| Variables | OR | 95% CI | P-value |
|---|---|---|---|
| Exercise status (ref: no exercise) | |||
| No exercise to exercise | 0.882 | 0.716-1.087 | 0.2393 |
| Exercise to no exercise | 0.994 | 0.795-1.244 | 0.9584 |
| Exercise | 0.755 | 0.640-0.892 | 0.0010 |
| Gender (ref: women) | |||
| Men | 0.944 | 0.803-1.110 | 0.4848 |
| Age | 1.046 | 1.038-1.054 | <0.0001 |
| Smoking (ref: No) | |||
| Yes | 1.245 | 1.028-1.508 | 0.0248 |
| Alcohol consumption (ref: No) | |||
| Yes | 0.781 | 0.631-0.967 | 0.0233 |
| Waist-hip ratio (ref: Normal) | |||
| Abnormal | 2.183 | 1.881-2.534 | <0.0001 |
| BMI categories (ref: Normal weight) | |||
| Underweight | 0.469 | 0.244-0.899 | 0.0227 |
| Overweight | 1.769 | 1.504-2.080 | <0.0001 |
| Obesity | 3.945 | 3.295-4.724 | <0.0001 |
| Uric acid (ref: Normal) | |||
| Abnormal | 1.303 | 1.112-1.527 | 0.0011 |
| Coffee consumption (ref: No) | |||
| Yes | 0.847 | 0.741-0.967 | 0.0142 |
| Vegetarian diet (ref: No) | |||
| Yes | 1.003 | 0.796-1.263 | 0.9818 |
| Hypertension (ref: No) | |||
| Yes | 1.640 | 1.391-1.933 | <0.0001 |
| Hyperlipidemia (ref: No) | |||
| Yes | 2.173 | 1.795-2.630 | <0.0001 |
| Follow-up duration | 1.001 | 1.000-1.001 | <0.0001 |
Table 3 presents the results of the association between exercise status and diabetes stratified by gender. Individuals who engaged in regular exercise were associated with a lower risk of diabetes, regardless of gender. The odds ratio (OR) for women was 0.752 (95% CI = 0.602-0.940), and for men, it was 0.762 (95% CI = 0.591-0.982). The "no exercise to exercise" group showed no significant association with diabetes in both women (OR = 1.010; 95% CI = 0.768-1.328) and men (OR = 0.722; 95% CI = 0.520-1.004). Furthermore, the "exercise to no exercise" group did not show a significant association with the progression to diabetes in either women (OR = 0.852; 95% CI = 0.629-1.153) or men (OR = 1.223; 95% CI = 0.869-1.723).
The association between exercise status and progression of prediabetes to diabetes in men and women
| Variables | Women | Men | ||||
|---|---|---|---|---|---|---|
| OR | 95% CI | P-value | OR | 95% CI | P-value | |
| Exercise status (ref: no exercise) | ||||||
| No exercise to exercise | 1.010 | 0.768-1.328 | 0.9439 | 0.722 | 0.520-1.004 | 0.0528 |
| Exercise to no exercise | 0.852 | 0.629-1.153 | 0.2987 | 1.223 | 0.869-1.723 | 0.2481 |
| Exercise | 0.752 | 0.602-0.940 | 0.0123 | 0.762 | 0.591-0.982 | 0.0359 |
| Age | 1.050 | 1.038-1.062 | <0.0001 | 1.039 | 1.027-1.050 | <0.0001 |
| Smoking (ref: No) | ||||||
| Yes | 0.914 | 0.548-1.524 | 0.7293 | 1.329 | 1.078-1.640 | 0.0079 |
| Alcohol consumption (ref: No) | ||||||
| Yes | 0.622 | 0.358-1.081 | 0.0921 | 0.827 | 0.653-1.046 | 0.1133 |
| Waist-hip ratio (ref: Normal) | ||||||
| Abnormal | 1.984 | 1.632-2.412 | <0.0001 | 2.523 | 1.992-3.194 | <0.0001 |
| BMI categories (ref: Normal weight) | ||||||
| Underweight | 0.471 | 0.228-0.970 | 0.0410 | 0.529 | 0.118-2.372 | 0.4052 |
| Overweight | 1.890 | 1.529-2.337 | <0.0001 | 1.560 | 1.205-2.020 | 0.0007 |
| Obesity | 3.856 | 3.045-4.882 | <0.0001 | 3.736 | 2.801-4.983 | <0.0001 |
| Uric acid (ref: Normal) | ||||||
| Abnormal | 1.994 | 1.584-2.510 | <0.0001 | 0.857 | 0.685-1.073 | 0.1782 |
| Coffee consumption (ref: No) | ||||||
| Yes | 0.926 | 0.774-1.107 | 0.3965 | 0.759 | 0.620-0.929 | 0.0076 |
| Vegetarian diet (ref: No) | ||||||
| Yes | 1.109 | 0.832-1.477 | 0.4817 | 0.830 | 0.559-1.234 | 0.3581 |
| Hypertension (ref: No) | ||||||
| Yes | 1.810 | 1.439-2.277 | <0.0001 | 1.430 | 1.124-1.819 | 0.0036 |
| Hyperlipidemia (ref: No) | ||||||
| Yes | 1.875 | 1.447-2.430 | <0.0001 | 2.586 | 1.934-3.459 | <0.0001 |
| Follow-up duration | 1.001 | 1.000-1.001 | <0.0001 | 1.001 | 1.000-1.001 | <0.0001 |
Discussion
In the present study, the "exercise" group exhibited a significant association with a reduced risk of diabetes. Notably, transitioning from no exercise to exercise, as well as from exercise to no exercise, did not show significant associations with diabetes. Both women and men demonstrated a similar pattern regarding the prevalence of diabetes within the pre-diabetic population, indicating that regular exercise is linked to a decreased risk of diabetes, regardless of gender.
Previous research has highlighted the effectiveness of intensive lifestyle modifications, including dietary changes and regular exercise, in preventing the onset of diabetes in individuals with prediabetes [1]. For instance, a study conducted in China collected data from 110,660 participants across 33 healthcare clinics between 1986 and 1992 [9]. Participants were randomly assigned to one of four groups: a control group or one of three active treatment groups—diet alone, exercise alone, or a combination of diet and exercise. Follow-up evaluations conducted at two-year intervals over six years revealed that the interventions led to reductions in diabetes risk by 31% (P < 0.03) for diet, 46% (P < 0.0005) for exercise, and 42% (P < 0.005) for the combined approach. Additionally, these interventions have also demonstrated favorable long-term results for cardiovascular and microvascular outcomes [28]. However, most studies focused on the combination of diet and exercise.
The Diabetes Prevention Program (DPP) in the United States further reinforces our findings. This randomized clinical trial involved 27 centers and assessed whether lifestyle intervention or pharmacological therapy (metformin) could delay the onset of diabetes in individuals with impaired glucose tolerance (IGT) [29]. In another study with nearly three years of follow-up, the diabetes incidence rate was 11 cases per 100 person-years in the control group, compared to 4.8 cases per 100 person-years in the lifestyle intervention group [10]. Similarly, the Diabetes Prevention Study (DPS) in Finland, which involved 522 middle-aged subjects with impaired glucose tolerance, found a significant 58% reduction in diabetes risk for those in the exercise and diet intervention groups [11]. Other findings from a health screening program in Japan with 458 male participants also demonstrated that intensive lifestyle interventions could significantly reduce the risk of developing type 2 diabetes [30]. In India, a study involving 531 subjects found that lifestyle modifications (exercise and diet), metformin treatment, or a combination of both resulted in a relative risk reduction of 28.5%, 26.4%, and 28.2%, respectively, compared to the control group [31]. Collectively, these studies consistently demonstrate that lifestyle interventions, particularly dietary modifications and increased physical activity, are associated with a reduced incidence of diabetes compared to placebo or usual care.
Prediabetes is often associated with several notable risk factors, such as excess weight or obesity, older age, sedentary lifestyle, unhealthy dietary patterns, and genetic predisposition [32]. In our study, obesity and overweight (BMI ≥24) were linked to a higher risk of diabetes in the Taiwanese population. According to the 2005-2014 National Health and Nutrition Examination Survey (NHANES), over 80% of individuals diagnosed with prediabetes were either overweight or classified as obese (BMI ≥ 25) [33]. While many randomized clinical trials have linked the effects of lifestyle modification primarily to weight loss [34], it is crucial to recognize that other factors may also play a significant role [9, 31].
Our findings revealed a similar trend in diabetes prevalence among the pre-diabetic population across both genders, indicating that regular exercise is crucial for reducing diabetes risk, regardless of gender. Research has identified gender disparities in the epidemiology of diabetes and obesity, likely stemming from a combination of cultural, biological, and lifestyle factors, as well as inequalities in treatment and prevention efforts [35, 36]. Notably, men are diagnosed with diabetes at younger ages and BMI levels, while obesity—a significant risk factor—is generally more common in women [36]. The biological variances may also include genetic predispositions that differ by gender [37]. Furthermore, chronic inflammation, which is more pronounced in women, may interact with genetic predispositions and affect diabetes risk differently across genders.
Age was another significant risk factor for diabetes in our study. Prediabetes is common among older adults (over 60 years old); however, progression to diabetes in these individuals was found to be slower compared to those in middle age groups, based on a 6.5-year follow-up [38]. As individuals age, various changes in body composition, insulin sensitivity, and glucose metabolism occur, which can elevate the risk of developing diabetes. Our study also demonstrated that subjects with hypertension and hyperlipidemia at enrollment exhibited a higher risk of developing diabetes. Previous data from the US NHANES (1988-2014) revealed a high prevalence of prediabetes among adults, with approximately half of these individuals having comorbidities such as hypertension or dyslipidemia, which significantly elevate the risk of cardiovascular and renal diseases [39].
It is important to note the limitations and strengths of our study. The TWB provides a large-scale, representative dataset covering over 95% of the Taiwanese population. However, the assessment of prediabetes was based solely on FBS and glycated hemoglobin (HbA1c) levels, without incorporating oral glucose tolerance tests that could provide a more comprehensive evaluation. Nevertheless, the definition of prediabetes used in this study aligns with recognized guidelines. Finally, physical activity or exercise data were only collected at baseline and the first follow-up, preventing the capture of fluctuations in participants' exercise habits throughout the study period. Consequently, participants with inconsistent exercise habits were classified based solely on their initial and final status without exclusion. This may affect the robustness of our findings, as participants with fluctuating exercise habits could have varying diabetes risk levels that are not fully captured in our analysis. Further research with more continuous monitoring of exercise habits could provide a clearer understanding of these dynamics.
Conclusion
In summary, our study highlights that regular exercise is associated with a reduced risk of developing diabetes in individuals with prediabetes. These findings support the notion that lifestyle interventions, particularly exercise, are crucial in preventing the onset of diabetes. Gender and age did not significantly influence the association between exercise and diabetes risk in our study. However, further research is needed to understand the underlying mechanisms and develop targeted interventions for specific subgroups at high risk of diabetes. The promotion of lifestyle modifications, including exercise, should be integral to comprehensive diabetes prevention strategies.
Acknowledgements
This study was funded by Chung Shan Medical University Hospital and the National Science and Technology Council.
Funding
This study was funded by Chung Shan Medical University Hospital (CSH-2024-D-007) and the National Science and Technology Council (112-2811-M-040-001, NSTC 113-2811-M-040-001, NSTC 113-2121-M-040-001, NSTC 114-2121-M-040-002).
Ethics approval and consent to participate
Approval for this study was provided by the Institutional Review Board of Chung Shan Medical University (IRB: CS1-23101). Each participant signed an informed consent letter before enrolling in the Taiwan Biobank project. All methods were carried out per relevant guidelines and regulations.
Availability of data and materials
The data that support the findings of this study are available upon request from the corresponding author. The data are not publicly available due to privacy or ethical restrictions.
Competing Interests
The authors have declared that no competing interest exists.
References
1. Echouffo-Tcheugui JB, Perreault L, Ji L, Dagogo-Jack S. Diagnosis and Management of Prediabetes: A Review. JAMA. 2023;329:1206-16
2. Tabak AG, Herder C, Rathmann W, Brunner EJ, Kivimaki M. Prediabetes: a high-risk state for diabetes development. Lancet. 2012;379:2279-90
3. Sun H, Saeedi P, Karuranga S, Pinkepank M, Ogurtsova K, Duncan BB. et al. IDF Diabetes Atlas: Global, regional and country-level diabetes prevalence estimates for 2021 and projections for 2045. Diabetes Res Clin Pract. 2022;183:109119
4. Martin-Timon I, Sevillano-Collantes C, Segura-Galindo A, Del Canizo-Gomez FJ. Type 2 diabetes and cardiovascular disease: Have all risk factors the same strength? World J Diabetes. 2014;5:444-70
5. Echouffo-Tcheugui JB, Selvin E. Prediabetes and What It Means: The Epidemiological Evidence. Annu Rev Public Health. 2021;42:59-77
6. Mourouti N, Mavrogianni C, Mouratidou T, Liatis S, Valve P, Rurik I. et al. The Association of Lifestyle Patterns with Prediabetes in Adults from Families at High Risk for Type 2 Diabetes in Europe: The Feel4Diabetes Study. Nutrients. 2023 15
7. Welfare MoHa. The results of national mortality statistics from the Ministry of Health and Welfare in 2022
8. Schlesinger S, Neuenschwander M, Barbaresko J, Lang A, Maalmi H, Rathmann W. et al. Prediabetes and risk of mortality, diabetes-related complications and comorbidities: umbrella review of meta-analyses of prospective studies. Diabetologia. 2022;65:275-85
9. Pan XR, Li GW, Hu YH, Wang JX, Yang WY, An ZX. et al. Effects of diet and exercise in preventing NIDDM in people with impaired glucose tolerance. The Da Qing IGT and Diabetes Study. Diabetes Care. 1997;20:537-44
10. Knowler WC, Barrett-Connor E, Fowler SE, Hamman RF, Lachin JM, Walker EA. et al. Reduction in the incidence of type 2 diabetes with lifestyle intervention or metformin. N Engl J Med. 2002;346:393-403
11. Tuomilehto J, Lindstrom J, Eriksson JG, Valle TT, Hamalainen H, Ilanne-Parikka P. et al. Prevention of type 2 diabetes mellitus by changes in lifestyle among subjects with impaired glucose tolerance. N Engl J Med. 2001;344:1343-50
12. Fottrell E, Ahmed N, Morrison J, Kuddus A, Shaha SK, King C. et al. Community groups or mobile phone messaging to prevent and control type 2 diabetes and intermediate hyperglycaemia in Bangladesh (DMagic): a cluster-randomised controlled trial. The Lancet Diabetes & Endocrinology. 2019;7:200-12
13. Cefalu WT, Petersen MP, Ratner RE. The alarming and rising costs of diabetes and prediabetes: a call for action!. Diabetes care. 2014;37:3137
14. Nutrition Health Survey in Taiwan (NAHSIT). Health Promotion Administration, Ministry of Health and Welfare. 2017 -. 2020
15. Chen CM, Yeh MC. The prevalence and determinants of impaired fasting glucose in the population of Taiwan. BMC Public Health. 2013;13:1123
16. Tsai HC, Hsu PS, Pan LF, Hung CL, Yang DH, Hung KC. et al. The Presence of Diabetes Mellitus or Pre-diabetes Mellitus Increases Mortality from Heart Disease in a Taiwanese Population: A 10-year Follow-Up Study. BMC cardiovascular disorders. 2023;23:375
17. Wen CP, Cheng TY, Tsai SP, Hsu HL, Wang SL. Increased mortality risks of pre-diabetes (impaired fasting glucose) in Taiwan. Diabetes Care. 2005;28:2756-61
18. Chen CC, Liu K, Hsu CC, Chang HY, Chung HC, Liu JS. et al. Healthy lifestyle and normal waist circumference are associated with a lower 5-year risk of type 2 diabetes in middle-aged and elderly individuals: Results from the healthy aging longitudinal study in Taiwan (HALST). Medicine (Baltimore). 2017;96:e6025
19. Ciarambino T, Crispino P, Leto G, Mastrolorenzo E, Para O, Giordano M. Influence of Gender in Diabetes Mellitus and Its Complication. International Journal of Molecular Sciences. 2022;23:8850
20. Choi BCK, Shi F. Risk factors for diabetes mellitus by age and sex: results of the National Population Health Survey. Diabetologia. 2001;44:1221-31
21. Luo J, Rossouw J, Tong E, Giovino GA, Lee CC, Chen C. et al. Smoking and Diabetes: Does the Increased Risk Ever Go Away? American Journal of Epidemiology. 2013;178:937-45
22. Baliunas DO, Taylor BJ, Irving H, Roerecke M, Patra J, Mohapatra S. et al. Alcohol as a Risk Factor for Type 2 Diabetes: A systematic review and meta-analysis. Diabetes Care. 2009;32:2123-32
23. Zhang F-L, Ren J-X, Zhang P, Jin H, Qu Y, Yu Y. et al. Strong Association of Waist Circumference (WC), body mass index (BMI), waist-to-height ratio (WHtR), and waist-to-hip ratio (WHR) with diabetes: a population-based cross-sectional study in Jilin Province, China. Journal of diabetes research. 2021;2021:8812431
24. Katsiki N, Papanas N, Fonseca VA, Maltezos E, Mikhailidis DP. Uric acid and diabetes: is there a link? Current pharmaceutical design. 2013;19:4930-7
25. Carlström M, Larsson SC. Coffee consumption and reduced risk of developing type 2 diabetes: a systematic review with meta-analysis. Nutrition reviews. 2018;76:395-417
26. Olfert MD, Wattick RA. Vegetarian diets and the risk of diabetes. Current diabetes reports. 2018;18:101
27. Zhai Z, Yang Y, Lin G, Lin W, Wu J, Liu X. et al. The hypertension and hyperlipidemia status among type 2 diabetic patients in the community and influencing factors analysis of glycemic control. Diabetology & Metabolic Syndrome. 2023;15:73
28. Gong Q, Zhang P, Wang J, Ma J, An Y, Chen Y. et al. Morbidity and mortality after lifestyle intervention for people with impaired glucose tolerance: 30-year results of the Da Qing Diabetes Prevention Outcome Study. Lancet Diabetes Endocrinol. 2019;7:452-61
29. The Diabetes Prevention Program Research G. The Diabetes Prevention Program. Design and methods for a clinical trial in the prevention of type 2 diabetes. Diabetes Care. 1999;22:623-34
30. Kosaka K, Noda M, Kuzuya T. Prevention of type 2 diabetes by lifestyle intervention: a Japanese trial in IGT males. Diabetes Res Clin Pract. 2005;67:152-62
31. Ramachandran A, Snehalatha C, Mary S, Mukesh B, Bhaskar AD, Vijay V. et al. The Indian Diabetes Prevention Programme shows that lifestyle modification and metformin prevent type 2 diabetes in Asian Indian subjects with impaired glucose tolerance (IDPP-1). Diabetologia. 2006;49:289-97
32. Obesity. preventing and managing the global epidemic. Report of a WHO consultation. World Health Organ Tech Rep Ser. 2000;894:i-xii 1-253
33. Liu C, Foti K, Grams ME, Shin JI, Selvin E. Trends in Self-reported Prediabetes and Metformin Use in the USA: NHANES 2005-2014. J Gen Intern Med. 2020;35:95-101
34. Hamman RF, Wing RR, Edelstein SL, Lachin JM, Bray GA, Delahanty L. et al. Effect of weight loss with lifestyle intervention on risk of diabetes. Diabetes Care. 2006;29:2102-7
35. Huebschmann AG, Huxley RR, Kohrt WM, Zeitler P, Regensteiner JG, Reusch JEB. Sex differences in the burden of type 2 diabetes and cardiovascular risk across the life course. Diabetologia. 2019;62:1761-72
36. Kautzky-Willer A, Harreiter J, Pacini G. Sex and gender differences in risk, pathophysiology and complications of type 2 diabetes mellitus. Endocrine reviews. 2016;37:278-316
37. Chiang CW, Chou YH, Huang CN, Lu WY, Liaw YP. Gender-specific genetic influence of rs1111875 on diabetes risk: Insights from the Taiwan biobank study. Journal of Diabetes Investigation. 2025;16:36-42
38. Rooney MR, Rawlings AM, Pankow JS, Echouffo Tcheugui JB, Coresh J, Sharrett AR. et al. Risk of Progression to Diabetes Among Older Adults With Prediabetes. JAMA Intern Med. 2021;181:511-9
39. Ali MK, Bullard KM, Saydah S, Imperatore G, Gregg EW. Cardiovascular and renal burdens of prediabetes in the USA: analysis of data from serial cross-sectional surveys, 1988-2014. Lancet Diabetes Endocrinol. 2018;6:392-403
Author contact
![]() Corresponding authors: Yung-Po Liaw, Department of Public Health, Institute of Public Health, Chung Shan Medical University, No. 110, Sec. 1 Jianguo N. Rd., Taichung City 40201, Taiwan. Email: Liawypedu.tw, Tel.: +886-4-36097501. Chien-Ning Huang, Institute of Medicine, Chung Shan Medical University, No. 110, Sec. 1 Jianguo N. Rd., Taichung City 40201, Taiwan. Tel: 886-4-2473-0022, ext. 11010, Fax: 886-4-2475-9950, Email: cshy049edu.tw
Corresponding authors: Yung-Po Liaw, Department of Public Health, Institute of Public Health, Chung Shan Medical University, No. 110, Sec. 1 Jianguo N. Rd., Taichung City 40201, Taiwan. Email: Liawypedu.tw, Tel.: +886-4-36097501. Chien-Ning Huang, Institute of Medicine, Chung Shan Medical University, No. 110, Sec. 1 Jianguo N. Rd., Taichung City 40201, Taiwan. Tel: 886-4-2473-0022, ext. 11010, Fax: 886-4-2475-9950, Email: cshy049edu.tw