Impact Factor ISSN: 1449-1907
- Issue 8; 2026
- Issue 7; 2026
- Issue 6; 2026
- Issue 5; 2026
- Issue 4; 2026
- Volume 23; 2026
- Past Issues
- Editorial Board
- Cover Images
- Index & Coverage
- Cover Suggestion
- Special Issues
Introduction
Methods
Results
Discussion
Conclusion
Abbreviations
Supplementary Material
Acknowledgements
References

 Global reach, higher impact
Int J Med Sci 2025; 22(12):3032-3043. doi:10.7150/ijms.113035 This issue Cite
Research Paper
The correlation between intraocular pressure and choroidal microcirculation in patients with high myopia
Dongjie Song1,2#, Yutong Han3#, Zongchan Zhang2#, Jiayun Ge2#, Kuangqi Chen2,4,5 ![]() , Jianping Tong2
, Jianping Tong2 ![]() , Ye Shen2
, Ye Shen2 ![]()
1. Department of Ophthalmology, the Fourth Affiliated Hospital of School of Medicine, and International School of Medicine, International Institutes of Medicine, Zhejiang University, Yiwu, China, 322000.
2. Department of Ophthalmology, The First Affiliated Hospital, Zhejiang University School of Medicine, Hangzhou, Zhejiang, China.
3. Department of Ophthalmology, The First Affiliated Hospital of Dalian Medical University, Dalian, Liaoning, China.
4. Eye Hospital of Shandong First Medical University (Shandong Eye Hospital), Eye Institute of Shandong First Medical University, State Key Laboratory Cultivation Base, Shandong Provincial Key Laboratory of Ophthalmology, Jinan, Shandong, China; School of Ophthalmology, Shandong First Medical University, Jinan, Shandong, China.
5. Department of Ophthalmology and Visual Sciences, The Chinese University of Hong Kong, Hong Kong, China.
#Dongjie Song, Yutong Han, Zongchan Zhang and Jiayun Ge contributed equally to this manuscript.
Received 2025-3-1; Accepted 2025-5-29; Published 2025-6-20
Abstract

Background: High myopia (HM) is a leading cause of visual impairment worldwide and the choroid plays a key role in HM progression. Intraocular pressure (IOP) may also be involved in HM development, while the relationship between IOP and choroidal microcirculation in HM patients remains poorly characterized.
Purpose: To investigate the correlation between IOP and choroidal microcirculation in HM individuals using swept-source optical coherence tomography angiography (SS-OCTA).
Methods: This cross-sectional observational study enrolled 118 eyes of 118 participants aged 18-30, comprising 64 HM eyes (axial lengths (AL) ≥ 26mm) and 54 mild-to-moderate myopic (MM) eyes (AL < 26 mm). Data on spherical equivalent (SE), AL and central corneal thickness (CCT) were collected. IOP was measured using a non-contact tonometer (NCT) and corrected with a formula to minimize the effect of CCT. Based on ETDRS classification, choroidal thickness (ChT) and vascular parameters including choriocapillaris layer vessel density (ChCVD), choroidal vascular index (CVI), choroidal vascular volume (CVV), choroidal stromal volume (CSV) and choroidal stromal density (CSI) were calculated from SS-OCTA.
Results: In this cohort, HM eyes exhibited higher corrected IOP (P < 0.05) and lower ChT, CVV and CSV across all grids compared to MM eyes (P < 0.001). Increased CSI and decreased CVI were also observed in most sectors of the HM eyes (P < 0.05). After adjusting for age, gender and AL, corrected IOP was correlated with SE, ChT, CVI and CSI in the subfoveal central and inner nasal grids among HM patients (P < 0.05). No significant correlation was found between AL and corrected IOP (P > 0.05).
Conclusion: In our population, compared to MM eyes, HM eyes showed higher IOP levels, which were negatively correlated with SE but not AL. Additionally, elevated IOP was observed to be associated with reduced choroidal thickness and vascularity in specific macular regions. The potential link between IOP and choroidal microcirculation may be involved in HM progression.
Keywords: high myopia, intraocular pressure, choroidal thickness, choroidal vascularity, swept-source optical coherence tomography angiography
Introduction
Myopia, a highly prevalent refractive disorder, has become a growing public health concern worldwide [1, 2]. By 2050, it is projected that 4.758 billion people will suffer from myopia globally, including 938 million with high myopia (HM), accounting for approximately 9.8% of the world's population [3]. HM is defined as a refractive error with spherical equivalent (SE) ≤ -6.00 diopter (D) or axial length (AL) ≥ 26 mm [4]. Individuals with HM are at higher risk of fundus complications, such as retinal detachment and macular degeneration, resulting in permanent visual impairment [5]. The scientific consensus highlights the pivotal role of myopia control strategies in preventing HM and its associated complications [6]. Currently, although a large number of studies have been conducted, the precise pathogenic mechanisms underlying myopia remain elusive [7-9]. Investigating the key factors contributing to its progression is essential for the effective prevention and management of HM.
Recently, intraocular pressure (IOP) has been recognized as a potential factor in myopia development [10]. Accumulating evidence has demonstrated a strong correlation between HM and glaucoma [11-14]. Chong et al. identified a bidirectional genetic causal link between myopia and primary open-angle glaucoma, primarily mediated by IOP through Mendelian randomization analysis, highlighting the vital role of IOP in myopia progression [15]. Some researchers proposed that lowering IOP might represent a novel therapeutic strategy for managing HM. Elevated IOP may exert direct mechanical stress on the sclera, thereby decreasing its elasticity and inducing axial elongation [16, 17]. Additionally, high IOP may promote extracellular matrix degradation via downregulating tissue inhibitor of metalloproteinase-1 (TIMP-1) and upregulating matrix metalloproteinase-2 (MMP-2), modulating scleral remodeling and increasing axial length [18-20]. Conversely, several studies attribute increased IOP in HM to anterior chamber changes and reduced aqueous humor outflow during accommodation [21, 22]. Clinical research on the relationship between IOP and HM remains controversial, likely due to the variations in age, myopia severity and IOP measurement methods across different studies [23-28]. Hence, more in-depth exploration is warranted.
Previous studies have proposed that the choroidal thickness (ChT) is generally lower in myopic eyes than in emmetropic and hyperopic individuals, correlating with myopia severity [10, 29, 30]. As a highly vascularized structure, the choroid supplies oxygen and nutrients to the outer retina and the inner sclera, serving as a key component in scleral remodeling and ocular growth [31]. Histological changes within choroid precede those in the retina during HM advancement, underscoring its importance in assessing disease progression [32]. Notably, choroid vascular filling is intimately related to ChT and primarily affected by intraocular perfusion pressure, with IOP acting as a major regulator. However, the relationship between IOP and microcirculation in myopia development has not yet been elucidated and calls for further clinical exploration.
Swept-source optical coherence tomography angiography (SS-OCTA) is an advanced imaging technique that enables non-invasive and high-resolution observation of microcirculatory structures in the ocular fundus [30]. Therefore, based on SS-OCTA, this study aims to evaluate IOP and choroidal microcirculation differences in the macular region between patients with HM and mild to moderate myopia (MM), exploring their correlations to provide new insights for managing HM.
Methods
Subjects
In this cross-sectional, observational, single-center study, 130 eyes of 130 patients with myopia were recruited at the Eye Center of the First Affiliated Hospital of Zhejiang University School of Medicine from July 2023 to December 2024. The study was conducted in accordance with the tenets of the Helsinki Declaration and received approval from the Human Research Ethics Committee of the First Affiliated Hospital of Zhejiang University School of Medicine. Written informed consent was obtained from all participants prior to examinations.
The inclusion criteria for this study were as follows: (1) participants aged 18-30 years; (2) SE ≤ -0.5 D; (3) IOP within the range of 10-21 mmHg after correction formula calculation; (4) high level of cooperation and adherence. The exclusion criteria included (1) diagnosed ocular diseases such as keratoconus, cataract, glaucoma and fundus disorders including retinal vasculitis, retinoschisis, macular degeneration, posterior staphyloma (PS), etc.; (2) known systemic diseases such as hypertension, diabetes, autoimmune diseases or systemic connective tissue diseases; (3) previous history of ocular surgery or trauma; (4) best-corrected visual acuity (BCVA) < 20/25; (5) inability to cooperate with various examinations or poor OCTA image quality.
Finally, healthy myopic individuals who had no significant history of ocular or systemic diseases and exhibited no typical fundus complications were enrolled. The subjects were further divided into two groups based on the degree of myopia: those with an AL ≥ 26 mm were defined as HM group, whereas the control group consisted of MM individuals with an AL<26 mm.
Ophthalmic examinations
Routine ocular examinations
All participants underwent comprehensive ophthalmic examinations. Anterior segment examinations were performed using a slit-lamp biomicroscope (Haag-Streit BM 900, Köniz, Switzerland). Ocular fundus examinations were conducted with indirect ophthalmoscopy lenses (OI-STDM-LR, Ocular, USA) and an ultra-wide field scan laser ophthalmoscope (Daytona, Nikon, Japan). Refractive error and BCVA under cycloplegia were assessed by experienced optometrists using an auto-refractometer (RC5000, Tomey, Japan) and a comprehensive refractometer (RT-600, Nidek, Japan). The SE was calculated as spherical error + (1/2 × cylindrical error). AL and central corneal thickness (CCT) values were measured using an ophthalmic optical biometer (OA2000, Tomey, Japan), with the average values calculated from three repeated measurements.
IOP measurement and correction
IOP was measured using a non-contact tonometer (NCT) (TX 20, Canon, Japan), and the mean value of three consecutive measurements was recorded. Considering the potential influence of CCT on IOP values by NCT, we applied an IOP correction formula proposed by Zhongshan Eye Center: IOP corrected = IOP measured + (520 - CCT) / 43.48, which was derived from the data collected in the Chinese population [33].
OCTA examination and imaging analysis
We performed OCTA imaging using the SS-OCTA equipment (BM-400 K BMizar, TowardPi Medical Technology Co., Ltd., Beijing, China), which features a laser wavelength of 1060 nm, an acquisition rate of 400,000 A-scans per second, a bandwidth of 100 nm, and axial and transversal resolutions of 3.8 μm and 10 μm in tissue, respectively. Prior to the OCTA examination, patients were instructed to remain in a dimly lit environment for 20 minutes to ensure pupil dilation. The macular region was scanned with a 12 × 12 mm rectangular pattern incorporating motion correction, after precisely aligning the examination frame with the fovea and adjusting the focus to obtain a clear and well-illuminated fundus image. In en-face mode, choroidal images were initially segmented by the built-in automatic layering algorithm, and the obtained segmentation results were subsequently reviewed and adjusted as needed by an experienced ophthalmologist. The distance from Bruch's membrane to the lower boundary of the choroid was obtained as ChT (Figure 1A).
Representative OCTA images of choroid. (A) Representative macular images under En-face mode by OCTA. (A1) The distance from the Bruch's membrane to the lower boundary of the choroid is defined as ChT; (A2) ChT in ETDRS grids. (B) Representative choroidal vascular images by OCTA. (B1) OCTA images of ChC; (B2) OCTA images of ChV; (B3) Illustration of ChCVD.
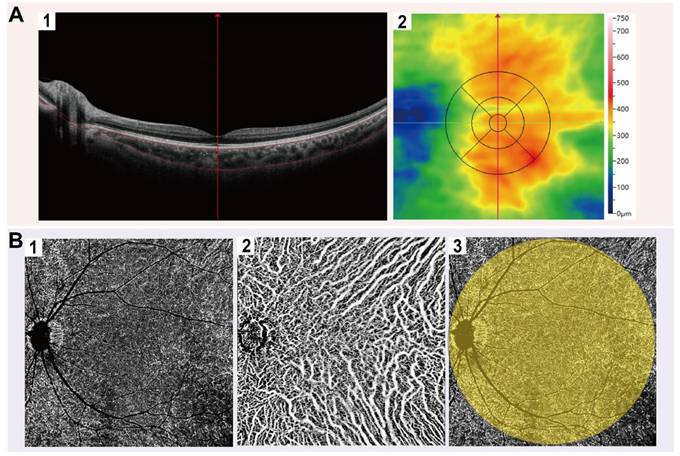
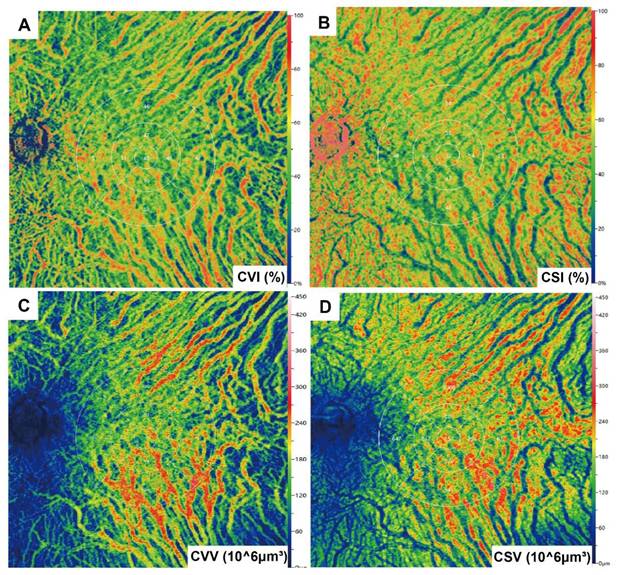
Images meeting quality thresholds (with a score of 10) then underwent analysis using built-in angiography analysis software that employs the algorithm of higher-order moments amplitude-decorrelation angiography to evaluate choroidal microcirculation parameters [34, 35]. The choriocapillaris layer (ChC) spans from Bruch's membrane to 29 µm beneath the membrane, while the choroidal vessel layer (ChV) extends from 29 µm below Bruch's membrane to the sclera. Choriocapillaris layer vessel density (ChCVD) is defined as the percentage of vascularized area within a circular region centered on the macular fovea with a diameter of 6 mm at the ChC layer, as determined by binarized image analysis (Figure 1B). Subsequently, we conducted stereoscopic quantification of the ChV layer using the built-in algorithm to obtain relevant choroidal vascular parameters (Figure 2): The choroidal vessel volume index (CVI) is calculated as the ratio of choroid vessel volume to the total choroid volume within a designated three-dimensional region, equivalent to a 3D vessel density, and expressed in percentage units. A higher CVI value frequently indicates greater vessel density. The choroidal vessel volume (CVV) is defined as choroid vessel volume per unit area (volume/area), and expressed in microns. A larger CVV value tends to indicate a greater number of vessels. The choroidal stroma volume index (CSI) is defined as the ratio of choroid stroma volume to choroid volume within a designated 3D region, and expressed in percentage units. The choroidal stroma volume (CSV) is defined as choroid stroma volume per unit area (volume/area), expressed in microns.
Illustration of choroidal vascularity analysis. CVI. (B) CSI. (C) CVV. (D) CSV.
According to the Early Treatment Diabetic Retinopathy Study (ETDRS) classification, the macula centered on the fovea is divided into three concentric regions: the central 1 mm is defined as the fovea region, the annular area between 1-3 mm is defined as the parafovea region, and the annular area between 3-6 mm area is defined as the perifovea region. The parafovea and perifovea regions are further subdivided into four quadrants (superior, inferior, nasal, and temporal) [26]. CT and vascular parameters were recorded for all nine regions to provide a more accurate and detailed description of the macular choroidal microcirculation characteristics.
To minimize the influence of circadian rhythm and ensure measurement consistency of the results, both the IOP and OCTA examinations were performed by the same experienced examiner between 14:00 and 16:00.
Statistical analysis
Given the strong correlation between the right and the left eyes, the left eyes were selected as experimental subjects. All data were statistically analyzed using IBM SPSS Statistics 28.0 (IBM, Armonk, NY, USA). Descriptive statistics were presented as means ± standard deviations (SDs), and categorical variables were expressed as numbers and proportions. The Shapiro-Wilk (S-W) test was used to assess the normality of quantitative data. For normally distributed data with homogeneity of variance, independent samples t-test was applied for comparisons; for non-normally distributed data, a non-parametric rank sum test was used. Bonferroni correction was performed to adjust for multiple comparisons. For correlation analysis, Pearson's correlation was used for data with normal distribution while Spearman's rank correlation was applied for non-normal distributed data. Linear regression was conducted to evaluate the association between IOP and each outcome variable. P < 0.05 was considered statistically significant.
Results
Demographics
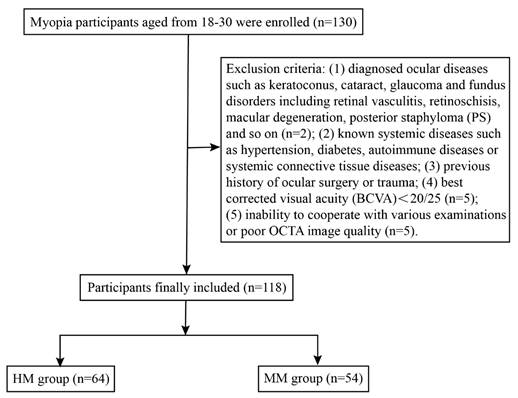
A total of 130 participants aged between 18 and 30 were successfully recruited and underwent detailed ophthalmic examinations, including OCTA. Among them, 12 participants were excluded due to asymptomatic retinoschisis (n = 1), retinoschisis combined with PS (n = 1), BCVA < 20/25 (n = 5) or sub-optimal OCTA image quality (n = 5). Ultimately, 118 eyes from 118 subjects (90.77%) were included in the analysis and categorized into two groups: the HM group (64 eyes, 64 subjects) and MM group (54 eyes, 54 subjects) (Figure 3). The biometric parameters including age, gender, SE, AL and corrected IOP, did not differ significantly between the included participants and those excluded from the analysis (Table 1). Demographic data of the included cohort are presented in Table 2. No significant differences were observed in age or gender between the two groups (P > 0.05), while AL and SE differed significantly between the HM and MM groups (P < 0.001). The mean AL was 27.00 ± 0.73 mm in the HM group and 25.10 ± 0.68 mm in the MM group. Notably, corrected IOP was significantly higher in the HM group than in the MM group (15.18 ± 2.10 mmHg vs. 14.24 ± 1.79 mmHg; P < 0.05) (Figure S1).
The workflow of participant selection for the study.
Demographic characteristics of the participants and the non-participants
| Included participants (n = 118) | Excluded participants (n = 12) | P value | |
|---|---|---|---|
| Gender (n, %) | |||
| Male | 60 (50.8) | 5 (41.7) | 0.763 |
| Female | 58 (49.2) | 7 (58.3) | |
| Age (y), mean±SD | 24.71±3.16 | 23.92±2.61 | 0.401 |
| AL (mm), mean±SD | 26.13±1.19 | 26.57±0.70 | 0.216 |
| SE (D), mean±SD | -7.48±3.17 | -8.06±1.91 | 0.363 |
| IOP corrected (mmHg), mean±SD | 14.75±2.01 | 14.18±2.23 | 0.353 |
Demographic characteristics of the study cohort
| HM (n = 64) | MM (n = 54) | P value | |
|---|---|---|---|
| Gender (n, %) | |||
| Male | 33 (51.6) | 27 (50) | 0.866 |
| Female | 31(48.4) | 27 (50) | |
| Age (y), mean±SD | 24.28±3.28 | 25.22±2.96 | 0.107 |
| AL (mm), mean±SD | 27.00±0.73 | 25.10±0.68 | <0.001 |
| SE (D), mean±SD | -9.39±2.15 | -5.22±2.66 | <0.001 |
| IOP corrected (mmHg), mean±SD | 15.18±2.10 | 14.24±1.79 | 0.011 |
Measurements of choroidal parameters
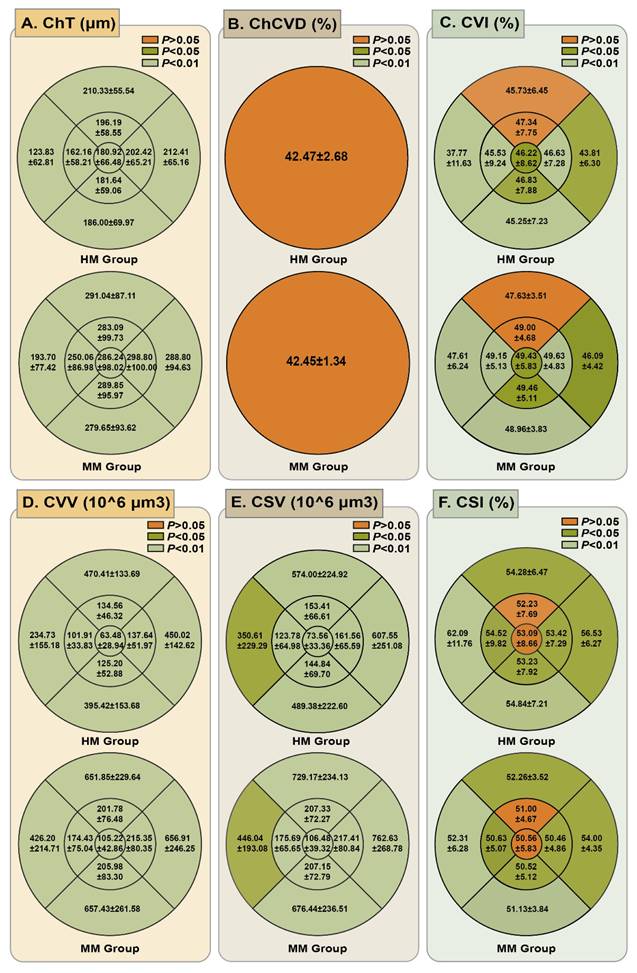
We obtained the mean choroidal microcirculation parameters in all ETDRS grid sectors, as detailed in Figure 4 (Table S1). Quantitative analysis revealed significantly reduced ChT in HM eyes compared to MM controls across all analyzed sectors (P < 0.001). The choroidal vessel density was also compared for all ETDRS grids. For the ChC layer, the ChCVD was 42.47 ± 2.68% in the HM group and 42.45 ± 1.34% in the MM group, showing no significant difference (P > 0.05). However, a statistically significant difference was observed in the ChV layer of the choroid. The CVI in the HM group was significantly lower than that in the MM group in all the grids except for the inner and the outer superior zones (P < 0.05). Compared with the MM group, the HM group demonstrated significantly lower CVV values in all sectors and decreased CSV in most sectors except for the outer nasal and temporal zones (P < 0.001). Conversely, patients with HM had a significantly higher CSI in all nine sectors except for the subfoveal central and inner superior sector (P < 0.05), compared to those in MM group.
Comparison of mean ChT and choroidal vascular parameters in different ETDRS grid sectors. (A) Comparison of mean ChT in different ETDRS grids between HM group and MM group. (B) Comparison of ChCVD in a radius of 6 mm of the macular region between HM group and MM group. (C) Comparison of mean CVI in different ETDRS grids between HM group and MM group. (D) Comparison of mean CVV in different ETDRS grids between HM group and MM group. (E) Comparison of mean CSV in different ETDRS grids between HM group and MM group. (F) Comparison of mean CSI in different ETDRS grids between HM group and MM group.
Correlation between IOP, myopia degree and choroidal microcirculation parameters
As shown in Table 3, a negative correlation was observed between corrected IOP and SE in HM eyes (r = -0.252, P = 0.045), while no significant correlation was found between corrected IOP and AL in either the HM group or the MM group. Furthermore, corrected IOP was significantly correlated with ChT in the subfoveal central (r = -0.312, P = 0.012), inner inferior (r = -0.268, P = 0.032), and inner nasal (r = -0.306, P = 0.014) grids in HM eyes. Additionally, our study demonstrated that CVI was negatively correlated with corrected IOP in the subfoveal central (r = -0.329, P = 0.008) and inner nasal (r = -0.300, P = 0.016) zones in HM eyes, whereas CSI exhibited an opposite trend (r = 0.250, P = 0.047 in the subfoveal center and r = 0.354, P = 0.004 in the inner nasal grids). Moreover, a negative correlation was observed between CVV and corrected IOP in the inner nasal grid (r = -0.256, P = 0.041) in the HM group, while in the MM group, a positive correlation was noted in the inner inferior (r = 0.324, P = 0.017) and outer inferior (r = 0.282, P = 0.039) sectors.
Correlation between IOP corrected and myopia and choroidal circulation parameters
| HM | MM | |||
|---|---|---|---|---|
| r | P value | r | P value | |
| SE | -0.252 | 0.045 | 0.154 | 0.265 |
| AL | -0.042 | 0.741 | -0.133 | 0.336 |
| ChT | ||||
| Subfoveal central | -0.312 | 0.012 | 0.216 | 0.116 |
| Inner superior | 0.034 | 0.791 | 0.087 | 0.530 |
| Inner inferior | -0.268 | 0.032 | 0.259 | 0.058 |
| Inner nasal | -0.306 | 0.014 | 0.142 | 0.307 |
| Inner temporal | 0.018 | 0.888 | 0.180 | 0.193 |
| Outer superior | 0.072 | 0.573 | 0.011 | 0.940 |
| Outer inferior | 0.014 | 0.915 | 0.221 | 0.109 |
| Outer nasal | 0.105 | 0.408 | 0.089 | 0.521 |
| Outer temporal | -0.026 | 0.837 | 0.189 | 0.170 |
| ChCVD | -0.010 | 0.935 | -0.073 | 0.601 |
| CVI | ||||
| Subfoveal central | -0.329 | 0.008 | 0.070 | 0.616 |
| Inner superior | -0.106 | 0.407 | -0.002 | 0.988 |
| Inner inferior | -0.146 | 0.251 | 0.258 | 0.060 |
| Inner nasal | -0.300 | 0.016 | 0.142 | 0.304 |
| Inner temporal | -0.034 | 0.787 | -0.032 | 0.819 |
| Outer superior | -0.061 | 0.629 | 0.110 | 0.428 |
| Outer inferior | -0.106 | 0.405 | 0.187 | 0.177 |
| Outer nasal | -0.032 | 0.800 | 0.198 | 0.151 |
| Outer temporal | -0.019 | 0.881 | -0.010 | 0.943 |
| CVV | ||||
| Subfoveal central | 0.085 | 0.507 | 0.240 | 0.081 |
| Inner superior | 0.025 | 0.845 | 0.044 | 0.755 |
| Inner inferior | 0.014 | 0.912 | 0.324 | 0.017 |
| Inner nasal | -0.256 | 0.041 | 0.193 | 0.161 |
| Inner temporal | -0.005 | 0.968 | 0.211 | 0.125 |
| Outer superior | 0.065 | 0.612 | 0.082 | 0.556 |
| Outer inferior | -0.081 | 0.523 | 0.282 | 0.039 |
| Outer nasal | 0.155 | 0.220 | 0.104 | 0.455 |
| Outer temporal | -0.067 | 0.602 | 0.238 | 0.083 |
| CSV | ||||
| Subfoveal central | 0.079 | 0.533 | 0.133 | 0.338 |
| Inner superior | 0.017 | 0.895 | 0.066 | 0.637 |
| Inner inferior | 0.026 | 0.836 | 0.159 | 0.252 |
| Inner nasal | 0.062 | 0.626 | 0.075 | 0.592 |
| Inner temporal | -0.091 | 0.473 | 0.171 | 0.216 |
| Outer superior | 0.038 | 0.768 | -0.001 | 0.996 |
| Outer inferior | 0.050 | 0.695 | 0.150 | 0.279 |
| Outer nasal | 0.044 | 0.729 | 0.110 | 0.428 |
| Outer temporal | -0.024 | 0.848 | 0.174 | 0.208 |
| CSI | ||||
| Subfoveal central | 0.250 | 0.047 | -0.067 | 0.629 |
| Inner superior | 0.035 | 0.781 | 0.001 | 0.993 |
| Inner inferior | 0.086 | 0.497 | -0.266 | 0.052 |
| Inner nasal | 0.354 | 0.004 | -0.177 | 0.199 |
| Inner temporal | 0.041 | 0.747 | 0.029 | 0.835 |
| Outer superior | 0.052 | 0.684 | -0.114 | 0.414 |
| Outer inferior | 0.112 | 0.380 | -0.183 | 0.184 |
| Outer nasal | 0.027 | 0.834 | -0.189 | 0.172 |
| Outer temporal | 0.033 | 0.793 | 0.011 | 0.145 |
Multiple regression analysis of IOP corrected, myopia degree and choroidal microcirculation parameters in HMs
We performed multivariate regression analysis, adjusting for age, gender, and AL, to explore the correlations between corrected IOP and other factors. The results are summarized in Table 4. After adjusting for age and gender (Model 2), corrected IOP in HMs was found to be significantly associated with ChT, CVI and CSI in both the subfoveal central and inner nasal grids as well as with ChT in the inner inferior grids.
Multiple linear regression analyses of the effects of IOP corrected on SE and choroidal vascular parameters in HMs
| Outcomes | Model 1 | Model 2 | Model 3 | |||
|---|---|---|---|---|---|---|
| β (95% CI) | P value | β (95% CI) | P value | β (95% CI) | P value | |
| SE | -0.32 (-0.56, -0.08) | 0.011 | -0.32 (-0.56, -0.08) | 0.012 | -0.28 (-0.48, -0.09) | 0.006 |
| Subfoveal central CVI | -2.02 (-2.91, -1.13) | <0.001 | -1.99 (-2.88, -1.09) | <0.001 | -1.93 (-2.81, -1.05) | <0.001 |
| Inner nasal CVI | -1.65 (-2.66, -0.64) | 0.002 | -1.53 (-2.51, -0.55) | 0.003 | -1.50 (-2.47, -0.52) | 0.004 |
| Inner nasal CVV | -5.60 (-9.35, -1.84) | 0.005 | -5.50 (-9.30, -1.70) | 0.006 | -5.35 (-9.14, -1.56) | 0.008 |
| Subfoveal central CSI | 1.32 (0.35, 2.29) | 0.010 | 1.28 (0.30, 2.26) | 0.013 | 1.26 (0.27, 2.25) | 0.015 |
| Inner nasal CSI | 1.94 (0.89, 3.00) | <0.001 | 1.85 (0.81, 2.90) | <0.001 | 1.84(0.78, 2.90) | 0.001 |
| Subfoveal central ChT | -11.79 (-19.10, -4.49) | 0.002 | -11.42 (-18.79, -4.04) | 0.004 | -11.20 (-18.60, -3.80) | 0.004 |
| Inner inferior ChT | -7.38 (-15.84, 1.08) | 0.090 | -7.06 (-15.62, 1.50) | 0.109 | -2.25 (-9.23, -4.74) | 0.530 |
| Inner nasal ChT | -9.64 (-15.94, -3.34) | 0.004 | -9.73 (-16.11, -3.35) | 0.004 | -9.38(-15.66, -3.10) | 0.005 |
Model 1, Crude; Model 2, adjusting for age and gender; Model 3 adjusting for age, gender and AL;
CI: Confidence Interval
In Model 3, after further adjustment for AL, these correlations generally remained significant. However, the association between inner inferior ChT and corrected IOP was no longer significant after adjustment.
Discussion
Our results indicated a possible correlation between corrected IOP, SE, and choroidal microcirculation parameters in individuals with HM. We observed that corrected IOP was significantly higher in HM eyes compared to MM eyes. After adjusting for age, gender and AL, corrected IOP was negatively correlated with SE in HM patients in our study. Moreover, SS-OCTA analysis further revealed positive correlations between higher corrected IOP and increased ChT and CVI, as well as decreased CSI, particularly in the subfoveal central and inner nasal regions of HM patients. Further studies involving larger populations are warranted to validate these findings.
Currently, evidence regarding the correlation between IOP and myopia remains inconclusive. Nomura et al. reported significantly higher IOP levels in HM patients compared to non-HM individuals, while other studies found no significant correlation between IOP and myopia severity [36-40]. Given that previous clinical investigations have consistently indicated that IOP tends to decline with age, we hypothesized that these discrepancies might arise from variations in subject age ranges and differences in IOP measurement methods [41-43]. Therefore, in our study, 118 young myopic patients were included, with no significant age difference between groups to minimize age-related IOP variability. In addition, we used NCT with a correction formula to account for CCT effects on IOP measurement [33]. The mean corrected IOP in the HM group was significantly higher than that in the MM group, partially supporting the findings of Nomura et al. and suggesting that IOP may be involved in myopia progression.
Our study also revealed a significantly negative correlation between corrected IOP and SE in HM patients, which is consistent with prior reports by Li et al. [39, 44, 45]. We further conducted regression analysis which showed that corrected IOP was an independent factor influencing SE rather than AL, suggesting high IOP might affect HM advancement through mechanisms beyond axial elongation. We speculate that such dissociation may be attributed to ocular biomechanical alterations in HM eyes as well as the disparity of the underlying representation of SE and AL [46, 47]. During the development of HM, the sclera undergoes extracellular matrix remodeling and exhibits increased extensibility and reduced stiffness, which may decouple the mechanical effects of IOP from axial elongation [48, 49]. Yuan et al. reported that high myopic eyes exhibited a significantly lower scleral elastic modulus in both the macular and peripapillary regions compared to low myopic eyes [50]. After being subjected to the same ocular pressure to increase IOP, researchers have observed that patients with low myopia recover significantly faster compared to those with HM [9]. Thus, HM eyes with weakened scleral rigidity may demonstrate decreased resistance to IOP, allowing axial elongation to progress independently of IOP levels. Moreover, it has been reported that topical IOP-lowering agents could reduce myopia progression without affecting AL in the guinea pig form-deprivation model [51]. Considering that SE reflects composite ocular parameters involving corneal curvature, lens thickness and vitreous chamber depth, we speculate that elevated IOP may alter corneal curvature by redistributing stress across the corneal stroma or induce changes of lens form, thereby contributing to HM development [40, 52]. Furthermore, our study has observed that higher IOP in HM eyes is correlated with decreased choroidal blood flow in specific regions, potentially interfering with normal axial growth via mechanisms like scleral hypoxia and remodeling, and this will be discussed later. Of course, these hypotheses warrant validation through more systematic and rigorous experimental investigations.
Additionally, other studies have drawn differing conclusions on IOP-AL and IOP-SE association. Xu et al. identified a positive correlation between AL and IOP in extremely HM patients and a negative correlation between SE and IOP specifically in patients with SE ranging from -12 D to -15 D [53]. While some studies have proposed that higher IOP correlates with slower axial growth in children with progressive myopia [28, 54]. The variability of different studies may be attributed to the possible heterogeneity in the age of the subjects, the range of refractive power, and the methods of IOP measurement in different studies. Although the relationship between IOP and myopia remains undefined, the role of IOP in myopia progression should not be overlooked. Future studies ought to delve deeper into the direct impact of IOP on ocular biomechanics and conduct longitudinal assessments involving larger populations under standardized conditions.
Recently, the critical role of the choroid in myopia development has gained escalating attention. Our study found significantly thinner ChT in the central fovea and surrounding 6 mm grids in HM patients compared to MM patients, consistent with previous studies [32, 55]. Additionally, ChT in the subfoveal, inner inferior, and inner nasal grids of HM individuals exhibited a negative correlation with corrected IOP. Preceding research has also indicated that IOP may contribute to the regulation of ChT. Wang et al. reported that after dark room tests induced a sharp increase in IOP, subfoveal ChT became thinner, with the extent positively correlated with baseline IOP levels [56]. Furthermore, glaucoma patients using long-term IOP-lowering medications showed increased ChT [57]. Mechanically, the choroid can modulate retinal position by altering its thickness in response to optical defocus signals, thus contributing to the regulation of axial elongation and myopia progression [58, 59]. Based on these findings, we speculate that modulating IOP to adjust ChT could represent a potential strategy for preventing and controlling HM.
Given that the choroid is highly vascularized and its thickness is significantly influenced by vascular filling, we hypothesize that IOP may regulate ChT through modulation of choroidal blood flow. Consequently, we investigated the relationship between IOP and choroidal microcirculation parameters in HM patients. No statistically significant difference in ChCVD within a 6-mm radius of the macula region was found between HM and MM patients at the choroidal capillary layer, consistent with Mo et al.'s findings [60]. However, several studies have reported significantly lower ChCVD in the macular region of HM eyes compared to MM eyes, correlating with myopia severity [26, 61]. Cheng et al. noted increased choroidal capillary defect rates specifically in the perifoveal region during axial elongation in HM patients, with no significant changes observed in other regions [62]. Since choroidal capillaries in different areas of the macular region are affected by HM to varying degrees, the disparities among studies may be ascribed to differences in observation scope. Therefore, in-depth exploration of the effects of IOP on choroidal capillaries across different fundus areas in HM eyes should be conducted to draw more reliable conclusions.
We employed three-dimensional quantitative indicators, including CVI, CVV, CSV, and CSI, to characterize the state of choroidal macrovasculature, providing a more precise and comprehensive assessment of choroidal structure compared to two-dimensional measurement [30]. Our study showed that CVI, CVV and CSV were significantly reduced in HM eyes, while CSI was significantly increased across all analyzed grids, consistent with previous reports [6, 13, 26]. Moreover, our findings indicated that in HM patients, elevated IOP was significantly correlated with reduced choroidal vascular density and increased stromal density in the subfoveal and inner nasal grids, whereas no significant differences were noted in vascular or stromal distribution in other areas. Given the cross-sectional nature of this study, it was not feasible to establish a causal relationship among IOP, choroidal microcirculation and HM development at present [63]. Nevertheless, by incorporating the regional correlation between IOP and choroidal microcirculation identified in our present study with prevailing theories regarding the mechanisms underlying HM progression, it is possible to construct a speculative mechanism linking IOP to HM development. On the one hand, from the perspective of scleral hypoxia theory: elevated IOP may lead to decreased choroidal vascular density in the subfoveal and inner nasal regions, resulting in insufficient oxygen supply to the sclera [64, 65]. Subsequently, the scleral hypoxia microenvironment may further induce scleral remodeling, making the posterior pole of the eye more prone to expansion and characteristic fundus changes like peripapillary atrophy (PPA) in the temporal region, ultimately promoting HM advancement [65]. On the other hand, from the perspective of defocus signals theory: previous studies have shown that the nasal choroid exhibits greater sensitivity to myopic defocus signals compared to other regions, while the temporal choroid responds better to hyperopic defocus signals, which correlates with choroidal blood flow distribution [66, 67]. As IOP increases, choroidal vascular perfusion may decrease in the subfoveal and inner nasal grids, potentially diminishing the sensitivity of nasal choroid to myopic defocus signals while increasing susceptibility to axial elongation, thereby facilitating HM development. However, it should be emphasized that the above speculations and hypotheses still require further validation through experimental research and large-scale longitudinal cohort studies.
There are still some limitations in this study. Firstly, it included a relatively small sample size of 118 patients with myopia and did not involve emmetropic individuals due to recruitment challenges, which may introduce sampling biases and limit the generalizability of our findings. As a cross-sectional study, it lacks longitudinal evaluation of the long-term effects of IOP on choroidal microcirculation, thereby restricting its clinical applicability. Although we applied a CCT-adjusted formula based on Chinese populations for IOP correction, its validity for HM eyes with altered corneal biomechanics such as corneal hysteresis remains unconfirmed. Prospective studies incorporating multimodal tonometry like Goldmann applanation tonometry (GAT) or dynamic contour tonometry are required to confirm our observations in HM cohorts [68]. Moreover, we did not consider subclinical PS in HM eyes and future studies could incorporate ultra-widefield OCTA and color Doppler imaging technology to better assess potential PS on regional choroidal microcirculation.
Nevertheless, our results have indicated that the possible association between IOP and choroidal microcirculation may be involved in the occurrence and progression of HM patients. Even though IOP levels in this study were within the normal clinical range, relatively higher IOP was still observed to damage choroidal microcirculation in the macular region, with the extent of damage correlating closely with myopia severity. Therefore, we recommend that clinicians closely monitor IOP in HM patients and consider establishing a standardized IOP range specific for HM eyes to improve management precision. Admittedly, while the interaction between IOP and HM requires further investigation, understanding their correlation with choroidal microcirculation could enhance insights into HM progression and inform preventive strategies.
Conclusion
In conclusion, our findings have indicated that compared to MM individuals, those with HM may exhibit higher levels of IOP. Moreover, as IOP increased, the choroidal vascularity of HM eyes tended to be sparser while the stromal structure appeared denser in the central fovea and nasal parafovea. This potential association between IOP and choroidal microcirculation in specific macular regions may be involved in the development of HM. Further research involving larger sample sizes and longitudinal assessments is essential to elucidate the effects of IOP on choroidal microcirculation and its implications for the physiological and pathological mechanisms underlying myopia.
Abbreviations
HM: high myopia; SE: spherical equivalent; D: diopter; AL: axial length; IOP: intraocular pressure; TIMP-1: tissue inhibitor of metalloproteinase-1; MMP-2: matrix metalloproteinase-2; ChT: choroidal thickness; SS-OCTA: swept-source optical coherence tomography angiography; MM: mild to moderate myopia; PS: posterior staphyloma; BCVA: best-corrected visual acuity; CCT: central corneal thickness; NCT: non-contact tonometer; ChC: choriocapillaris layer; ChV: choroidal vessel layer; ChCVD: choriocapillaris layer vessel density; CVI: choroidal vascular index; CVV: choroidal vascular volume; CSI: choroidal stromal density; CSV: choroidal stromal volume; ETDRS: Early Treatment Diabetic Retinopathy Study; SDs: standard deviations; S-W test: Shapiro-Wilk test; PPA: peripapillary atrophy; GAT: Goldmann applanation tonometry.
Supplementary Material
Supplementary figure and table.
Acknowledgements
We appreciate the authors of the original studies mentioned. We created the figures in the article with Adobe Illustration and Graphpad Prism.
Funding
This work was supported by the National Natural Science Foundation of China (Grant number 82371084).
Author contributions
D.-J. S.: Conceptualization (equal); Formal Analysis (equal); Investigation (equal); Data curation (equal); Writing - original draft (equal); Visualization (equal).
Y.-T. H.: Conceptualization (equal); Formal Analysis (equal); Writing - original draft (equal); Visualization (equal).
Z.-C. Z.: Conceptualization (equal); Formal Analysis (equal); Writing - original draft (equal); Visualization (equal).
J.-Y. G.: Conceptualization (equal); Formal Analysis (equal); Writing - original draft (equal); Visualization (equal).
K.-Q C: Conceptualization (equal); Methodology (equal); Formal analysis (equal); Writing - review & editing (equal); Funding acquisition (equal); Project administration (equal).
J.-P. T.: Conceptualization (equal); Methodology (equal); Formal analysis (equal); Writing - review & editing (equal); Funding acquisition (equal); Project administration (equal).
Y. S.: Conceptualization (equal); Methodology (equal); Formal analysis (equal); Writing - review & editing (equal); Funding acquisition (equal); Project administration (equal).
All authors read and approved the final version of the manuscript.
Competing Interests
The authors have declared that no competing interest exists.
References
1. Baird PN, Saw SM, Lanca C, Guggenheim JA, Smith Iii EL, Zhou X. et al. Myopia. Nature reviews Disease primers. 2020;6:99
2. Liang J, Pu Y, Chen J, Liu M, Ouyang B, Jin Z. et al. Global prevalence, trend and projection of myopia in children and adolescents from 1990 to 2050: a comprehensive systematic review and meta-analysis. The British journal of ophthalmology. 2025;109:362-71
3. Holden BA, Fricke TR, Wilson DA, Jong M, Naidoo KS, Sankaridurg P. et al. Global Prevalence of Myopia and High Myopia and Temporal Trends from 2000 through 2050. Ophthalmology. 2016;123:1036-42
4. Du R, Xie S, Igarashi-Yokoi T, Watanabe T, Uramoto K, Takahashi H. et al. Continued Increase of Axial Length and Its Risk Factors in Adults With High Myopia. JAMA ophthalmology. 2021;139:1096-103
5. Fang Y, Yokoi T, Nagaoka N, Shinohara K, Onishi Y, Ishida T. et al. Progression of Myopic Maculopathy during 18-Year Follow-up. Ophthalmology. 2018;125:863-77
6. Jonas JB, Ang M, Cho P, Guggenheim JA, He MG, Jong M. et al. IMI Prevention of Myopia and Its Progression. Investigative ophthalmology & visual science. 2021;62:6
7. Song D, Yang Q, Ge J, Chen K, Tong J, Shen Y. Color vision-associated environmental and biological factors in the development of myopia. Experimental eye research. 2025;254:110324
8. Ge J, Li X, Xia Y, Chen Z, Xie C, Zhao Y. et al. Recent advances in NLRP3 inflammasome in corneal diseases: Preclinical insights and therapeutic implications. The ocular surface. 2024;34:392-405
9. Lin X, Lei Y, Pan M, Hu C, Xie B, Wu W. et al. Augmentation of scleral glycolysis promotes myopia through histone lactylation. Cell metabolism. 2024;36:511-25.e7
10. Wang P, Chen S, Liu Y, Lin F, Song Y, Li T. et al. Lowering Intraocular Pressure: A Potential Approach for Controlling High Myopia Progression. Investigative ophthalmology & visual science. 2021;62:17
11. Wang YX, Yang H, Wei CC, Xu L, Wei WB, Jonas JB. High myopia as risk factor for the 10-year incidence of open-angle glaucoma in the Beijing Eye Study. The British journal of ophthalmology. 2023;107:935-40
12. Huh MG, Shin YI, Jeong Y, Kim YK, Park KH, Jeoung JW. Long-Term Follow-Up of Myopic Glaucoma: Progression Rates and Associated Factors. Journal of glaucoma. 2024;33:409-16
13. Li C, Chen Y, Yang S, Xiong R, Liu R, Zhu Z. et al. Long-Term Prediction and Risk Factors for Incident Visual Field Defect in Nonpathologic High Myopia. Investigative ophthalmology & visual science. 2024;65:43
14. Cheng J, Williams JP, Zhou L, Wang PC, Sun LN, Li RH. et al. Ozone rectal insufflation mitigates chronic rapid eye movement sleep deprivation-induced cognitive impairment through inflammation alleviation and gut microbiota regulation in mice. Medical gas research. 2024;14:213-24
15. Chong RS, Li H, Cheong AJY, Fan Q, Koh V, Raghavan L. et al. Mendelian Randomization Implicates Bidirectional Association between Myopia and Primary Open-Angle Glaucoma or Intraocular Pressure. Ophthalmology. 2023;130:394-403
16. McMonnies CW. An examination of the baropathic nature of axial myopia. Clinical & experimental optometry. 2014;97:116-24
17. McMonnies CW. An examination of the relation between intraocular pressure, fundal stretching and myopic pathology. Clinical & experimental optometry. 2016;99:113-9
18. Yamaoka A, Matsuo T, Shiraga F, Ohtsuki H. TIMP-1 production by human scleral fibroblast decreases in response to cyclic mechanical stretching. Ophthalmic research. 2001;33:98-101
19. Zhao F, Wu H, Reinach PS, Wu Y, Zhai Y, Lei Y. et al. Up-Regulation of Matrix Metalloproteinase-2 by Scleral Monocyte-Derived Macrophages Contributes to Myopia Development. The American journal of pathology. 2020;190:1888-908
20. Mallet RT, Burtscher J, Gatterer H, Glazachev O, Millet GP, Burtscher M. Hyperoxia-enhanced intermittent hypoxia conditioning: mechanisms and potential benefits. Medical gas research. 2024;14:127-9
21. Liu Y, Lv H, Jiang X, Hu X, Zhang M, Li X. Intraocular Pressure Changes during Accommodation in Progressing Myopes, Stable Myopes and Emmetropes. PloS one. 2015;10:e0141839
22. Alm A, Nilsson SF. Uveoscleral outflow-a review. Experimental eye research. 2009;88:760-8
23. Manny RE, Mitchell GL, Cotter SA, Jones-Jordan LA, Kleinstein RN, Mutti DO. et al. Intraocular pressure, ethnicity, and refractive error. Optometry and vision science: official publication of the American Academy of Optometry. 2011;88:1445-53
24. Lin J, Vasudevan B, Gao TY, Zhou HJ, Ciuffreda KJ, Liang YB. et al. Intraocular Pressure and Myopia Progression, Axial Length Elongation in Rural Chinese Children. Optometry and vision science: official publication of the American Academy of Optometry. 2023;100:708-14
25. Hysi PG, Choquet H, Khawaja AP, Wojciechowski R, Tedja MS, Yin J. et al. Meta-analysis of 542,934 subjects of European ancestry identifies new genes and mechanisms predisposing to refractive error and myopia. Nature genetics. 2020;52:401-7
26. Wu H, Zhang G, Shen M, Xu R, Wang P, Guan Z. et al. Assessment of Choroidal Vascularity and Choriocapillaris Blood Perfusion in Anisomyopic Adults by SS-OCT/OCTA. Investigative ophthalmology & visual science. 2021;62:8
27. Yii FS, He M, Chappell F, Bernabeu MO, MacGillivray T, Dhillon B. et al. Higher intraocular pressure is associated with slower axial growth in children with non-pathological high myopia. Eye (London, England). 2024;38:1208-14
28. Li SM, Iribarren R, Li H, Kang MT, Liu L, Wei SF. et al. Intraocular pressure and myopia progression in Chinese children: the Anyang Childhood Eye Study. The British journal of ophthalmology. 2019;103:349-54
29. Ostrin LA, Harb E, Nickla DL, Read SA, Alonso-Caneiro D, Schroedl F. et al. IMI-The Dynamic Choroid: New Insights, Challenges, and Potential Significance for Human Myopia. Investigative ophthalmology & visual science. 2023;64:4
30. Hormel TT, Hwang TS, Bailey ST, Wilson DJ, Huang D, Jia Y. Artificial intelligence in OCT angiography. Progress in retinal and eye research. 2021;85:100965
31. Brown DM, Mazade R, Clarkson-Townsend D, Hogan K, Datta Roy PM, Pardue MT. Candidate pathways for retina to scleral signaling in refractive eye growth. Experimental eye research. 2022;219:109071
32. Jonas JB, Jonas RA, Bikbov MM, Wang YX, Panda-Jonas S. Myopia: Histology, clinical features, and potential implications for the etiology of axial elongation. Progress in retinal and eye research. 2023;96:101156
33. GE J LB, Gao QY. Central corneal thickness and glaucoma. Ophthalmology in China. 2005;14:145-6
34. Zhang W, Li C, Gong Y, Liu N, Cao Y, Li Z. et al. Advanced ultrawide-field optical coherence tomography angiography identifies previously undetectable changes in biomechanics-related parameters in nonpathological myopic fundus. Frontiers in bioengineering and biotechnology. 2022;10:920197
35. Wang Y, Liu L, Li C, Yang Y, He X, Jiang M. et al. Choroidal vessel density in major depressive disorder using swept-source optical coherence tomography angiography. Journal of affective disorders. 2024;344:79-85
36. Nomura H, Ando F, Niino N, Shimokata H, Miyake Y. The relationship between intraocular pressure and refractive error adjusting for age and central corneal thickness. Ophthalmic & physiological optics: the journal of the British College of Ophthalmic Opticians (Optometrists). 2004;24:41-5
37. Mori K, Kurihara T, Uchino M, Torii H, Kawashima M, Sasaki M. et al. High Myopia and Its Associated Factors in JPHC-NEXT Eye Study: A Cross-Sectional Observational Study. Journal of clinical medicine. 2019;8:1788
38. Fan Y, Huang Y, Huang X. Association between Axial Length to Corneal Curvature Radius Ratio and Myopia in Adult Patients. Journal of ophthalmology. 2024;2024:4981095
39. Li S, Li SM, Wang XL, Kang MT, Liu LR, Li H. et al. Distribution and associations of intraocular pressure in 7- and 12-year-old Chinese children: The Anyang Childhood Eye Study. PloS one. 2017;12:e0181922
40. Wu W, Dou R, Wang Y. Comparison of Corneal Biomechanics Between Low and High Myopic Eyes-A Meta-analysis. American journal of ophthalmology. 2019;207:419-25
41. Liu X, Pan X, Ma Y, Jin C, Wang B, Ning Y. Variation in intraocular pressure by sex, age, and geographic location in China: A nationwide study of 284,937 adults. Frontiers in endocrinology. 2022;13:949827
42. Chua J, Chee ML, Chin CWL, Tham YC, Tan N, Lim SH. et al. Inter-relationship between ageing, body mass index, diabetes, systemic blood pressure and intraocular pressure in Asians: 6-year longitudinal study. The British journal of ophthalmology. 2019;103:196-202
43. Nakano T, Tatemichi M, Miura Y, Sugita M, Kitahara K. Long-term physiologic changes of intraocular pressure: a 10-year longitudinal analysis in young and middle-aged Japanese men. Ophthalmology. 2005;112:609-16
44. Zhou Q, Liang YB, Wong TY, Yang XH, Lian L, Zhu D. et al. Intraocular pressure and its relationship to ocular and systemic factors in a healthy Chinese rural population: the Handan Eye Study. Ophthalmic epidemiology. 2012;19:278-84
45. Ma D, Wei S, Sun Y, Li SM, An WZ, Hu JP. et al. Distribution of IOP and its relationship with refractive error and other factors: the Anyang University Students Eye Study. International journal of ophthalmology. 2021;14:554-9
46. Backhouse S, Phillips JR. Effect of induced myopia on scleral myofibroblasts and in vivo ocular biomechanical compliance in the guinea pig. Investigative ophthalmology & visual science. 2010;51:6162-71
47. Li HY, Shi XH, Dong L, Yu CY, Li YT, Zhang RH. et al. Transcriptomic and proteomic analyses of sclera in lens-induced myopic guinea pigs. BMC genomics. 2025;26:242
48. Liu X, Yuan Y, Wu Y, Zhu C, Liu Y, Ke B. Extracellular Matrix Stiffness Modulates Myopia Scleral Remodeling Through Integrin/F-Actin/YAP Axis. Investigative ophthalmology & visual science. 2025;66:22
49. Brown DM, Kowalski MA, Paulus QM, Yu J, Kumar P, Kane MA. et al. Altered Structure and Function of Murine Sclera in Form-Deprivation Myopia. Investigative ophthalmology & visual science. 2022;63:13
50. Yuan Y, Li F, Ten W, Jin C, Wu Y, Liu Y. et al. In vivo assessment of regional scleral stiffness by shear wave elastography and its association with choroid and retinal nerve fiber layer characteristics in high myopia. Graefe's archive for clinical and experimental ophthalmology = Albrecht von Graefes Archiv fur klinische und experimentelle Ophthalmologie. 2025
51. El-Nimri NW, Wildsoet CF. Effects of Topical Latanoprost on Intraocular Pressure and Myopia Progression in Young Guinea Pigs. Investigative ophthalmology & visual science. 2018;59:2644-51
52. Chen L, Huang Y, Zhang X, Shi Y, Gao Z, Sun B. et al. Corneal Biomechanical Properties Demonstrate Anisotropy and Correlate With Axial Length in Myopic Eyes. Investigative ophthalmology & visual science. 2023;64:27
53. Xu J LX, Hu Q, Yang F, Wu Q, Wang KM. Affecting factors of diopter and axis of super-high myopia. Recent Advances in Ophthalmology. 2012;32:952-5
54. Yii FS, He M, Chappell F, Bernabeu MO, MacGillivray T, Dhillon B. et al. Higher intraocular pressure is associated with slower axial growth in children with non-pathological high myopia. Eye (London, England). 2024;38(6):1208-1214
55. El-Shazly AA, Farweez YA, ElSebaay ME, El-Zawahry WMA. Correlation between choroidal thickness and degree of myopia assessed with enhanced depth imaging optical coherence tomography. European journal of ophthalmology. 2017;27:577-84
56. Wang YX, Jiang R, Ren XL, Chen JD, Shi HL, Xu L. et al. Intraocular pressure elevation and choroidal thinning. The British journal of ophthalmology. 2016;100:1676-81
57. Yeung SC, Park JY, Park D, You Y, Yan P. The effect of systemic and topical ophthalmic medications on choroidal thickness: A review. British journal of clinical pharmacology. 2022;88:2673-85
58. Chiang ST, Phillips JR, Backhouse S. Effect of retinal image defocus on the thickness of the human choroid. Ophthalmic & physiological optics: the journal of the British College of Ophthalmic Opticians (Optometrists). 2015;35:405-13
59. Moderiano D, Do M, Hobbs S, Lam V, Sarin S, Alonso-Caneiro D. et al. Influence of the time of day on axial length and choroidal thickness changes to hyperopic and myopic defocus in human eyes. Experimental eye research. 2019;182:125-36
60. Mo J, Duan A, Chan S, Wang X, Wei W. Vascular flow density in pathological myopia: an optical coherence tomography angiography study. BMJ open. 2017;7:e013571
61. Su L, Ji YS, Tong N, Sarraf D, He X, Sun X. et al. Quantitative assessment of the retinal microvasculature and choriocapillaris in myopic patients using swept-source optical coherence tomography angiography. Graefe's archive for clinical and experimental ophthalmology = Albrecht von Graefes Archiv fur klinische und experimentelle Ophthalmologie. 2020;258:1173-80
62. Cheng W, Song Y, Gao X, Lin F, Li F, Wang P. et al. Axial Length and Choriocapillaris Flow Deficits in Non-pathological High Myopia. American journal of ophthalmology. 2022;244:68-78
63. Savitz DA, Wellenius GA. Can Cross-Sectional Studies Contribute to Causal Inference? It Depends. American journal of epidemiology. 2023;192:514-6
64. Nickla DL, Wallman J. The multifunctional choroid. Progress in retinal and eye research. 2010;29:144-68
65. Liu Y, Wang L, Xu Y, Pang Z, Mu G. The influence of the choroid on the onset and development of myopia: from perspectives of choroidal thickness and blood flow. Acta ophthalmologica. 2021;99:730-8
66. Huang Y, Wang Y, Shen Y, Chen Z, Peng X, Zhang L. et al. Defocus-induced spatial changes in choroidal thickness of chicks observed by wide-field swept-source OCT. Experimental eye research. 2023;233:109564
67. Baksh J, Lee D, Mori K, Zhang Y, Torii H, Jeong H. et al. Myopia Is an Ischemic Eye Condition: A Review from the Perspective of Choroidal Blood Flow. Journal of clinical medicine. 2024;13:2777
68. Okafor KC, Brandt JD. Measuring intraocular pressure. Current opinion in ophthalmology. 2015;26:103-9
Author contact
![]() Corresponding authors: Ye Shen, Department of Ophthalmology, the First Affiliated Hospital Zhejiang University School of Medicine, Qingchun Road 79th, Hangzhou City, People's Republic of China; Email: idrshenedu.cn. Jianping Tong, Department of Ophthalmology, the First Affiliated Hospital Zhejiang University School of Medicine, Qingchun Road 79th, Hangzhou City, People's Republic of China; Email: idrtongedu.cn. Kuangqi Chen, Department of Ophthalmology, Shandong Eye Hospital, Jingsi Road 372th, Jinan City, People's Republic of China; Email: 3160105142edu.cn.
Corresponding authors: Ye Shen, Department of Ophthalmology, the First Affiliated Hospital Zhejiang University School of Medicine, Qingchun Road 79th, Hangzhou City, People's Republic of China; Email: idrshenedu.cn. Jianping Tong, Department of Ophthalmology, the First Affiliated Hospital Zhejiang University School of Medicine, Qingchun Road 79th, Hangzhou City, People's Republic of China; Email: idrtongedu.cn. Kuangqi Chen, Department of Ophthalmology, Shandong Eye Hospital, Jingsi Road 372th, Jinan City, People's Republic of China; Email: 3160105142edu.cn.