Impact Factor ISSN: 1449-1907

 Global reach, higher impact
Int J Med Sci 2025; 22(11):2771-2781. doi:10.7150/ijms.109687 This issue Cite
Research Paper
Associations Between Long-Term Exposure to Air Pollutants and Prostate Cancer in a Large Taiwanese Population
Jiun-Hung Geng1,2,3,4,5, Chia-Yang Li6, Ming-Tsang Wu7, Szu-Chia Chen5,8,9,10, Shu-Pin Huang1,3,4,5,7,11 ![]()
1. Graduate Institute of Clinical Medicine, College of Medicine, Kaohsiung Medical University, Kaohsiung 807378, Taiwan
2. Department of Urology, Kaohsiung Municipal Siaogang Hospital, Kaohsiung 812015, Taiwan
3. Department of Urology, Kaohsiung Medical University Hospital, Kaohsiung Medical University, Kaohsiung 807378, Taiwan
4. Department of Urology, School of Medicine, College of Medicine, Kaohsiung Medical University 807378, Kaohsiung, Taiwan
5. Research Center for Environmental Medicine, Kaohsiung Medical University, Kaohsiung 807378, Taiwan
6. Graduate Institute of Medicine, College of Medicine, Kaohsiung Medical University, Kaohsiung 807378, Taiwan
7. Ph.D. Program in Environmental and Occupational Medicine, College of Medicine, Kaohsiung Medical University, Kaohsiung 807378, Taiwan
8. Department of Internal Medicine, Kaohsiung Municipal Siaogang Hospital, Kaohsiung Medical University, Kaohsiung 812015, Taiwan
9. Department of Internal Medicine, Division of Nephrology, Kaohsiung Medical University Hospital, Kaohsiung Medical University, Kaohsiung 807378, Taiwan
10. Faculty of Medicine, College of Medicine, Kaohsiung Medical University, Kaohsiung 807378, Taiwan
11. Institute of Medical Science and Technology, College of Medicine, National Sun Yat-Sen University, Kaohsiung 804201, Taiwan
Received 2024-12-31; Accepted 2025-4-25; Published 2025-5-31
Abstract

Air pollution is associated with various illnesses including cancers, of which prostate cancer is one of the most prevalent malignancies in men. Emerging evidence has suggested that air pollution is a potential risk factor for prostate cancer. This study aimed to explore the relationship between air pollution and prostate cancer in a Taiwanese population. Using data from the Kaohsiung Medical University Hospital Database, we conducted a case-control study to identify patients with prostate cancer, and matched them by age with individuals without prostate cancer. Environmental pollution indices including particulate matter (PM), nitrogen oxides (NOx), sulfur dioxide (SO2), ozone (O3) and carbon monoxide (CO) were correlated with the patients' addresses using data from the Taiwan Central Air Quality Monitoring Network. The analysis included 3541 prostate cancer patients and 7082 age-matched controls. After adjusting for confounders, conditional logistic regression analysis demonstrated significant associations of prostate cancer with PM2.5 (odds ratio [95% confidence interval]: 1.240 [1.134-1.356]) and CO (odds ratio [95% confidence interval]: 1.105 [1.025-1.192]) at the index date, with similar associations observed for average exposure levels over 1, 2, 3, and 5 years prior to the index date. Furthermore, sensitivity analyses revealed that the odds ratios for combined-risk Z-score exposure at the index date and over these same time periods were 1.029, 1.033, 1.034, 1.034, and 1.033, respectively. These findings suggest that prolonged exposure to multiple air pollutants collectively contributes to prostate cancer risk. Further investigations are needed to validate these findings and explore potential underlying mechanisms.
Keywords: Prostate cancer, Air pollution, Particulate matter, Nitrogen oxides, Sulfur dioxide, PM2.5, PM10, Ozone, Carbon monoxide, Risk factors
Introduction
Prostate cancer (PCa) affects approximately 7,000 men in Taiwan annually [1]. While treatments for metastatic PCa have advanced and subsequently increased life expectancy [2-4], nearly all patients receiving hormonal therapy ultimately progress to castration-resistant prostate cancer (CRPC), often leading to fatal outcomes. Despite the survival benefits seen with next-generation hormonal agents such as enzalutamide and abiraterone for metastatic CRPC, drug resistance remains a concern [3, 5]. PCa patients experience substantial physical and emotional distress, particularly as the disease metastasizes, becoming essentially incurable. Identifying risk factors for PCa and devising preventive strategies is therefore critical.
According to the 2013 Global Disease Burden Assessment, outdoor air pollution contributes to over 3% of annual lives lost or disability [6]. Pollution exerts harmful effects through oxidative stress, inflammation, and immune responses [7-10]. Air pollution, a mix of gases and particles, encompasses common pollutants such as particulate matter (PM), nitrogen oxides (NOx), sulfur dioxide (SO2), ozone (O3) and carbon monoxide (CO), and it is correlated with respiratory and cardiovascular diseases, and certain cancers [11-13].
Several studies have investigated the association between exposure to air pollutants, and particulate matter with an aerodynamic diameter of 2.5 μm or less (PM2.5), and the risk of PCa [14, 15]. A study conducted in Canada in 2022 linked prolonged PM2.5 exposure to an increased risk of PCa, with a 28% increase per quartile elevation in PM2.5 even after adjusting for age, race, and socioeconomic factors [15]. In a study conducted in Taiwan in 2019, each 1 μg/m3 increment in PM2.5 was associated with a 13.1% increase in the incidence of cancer [16].
Although reports suggest a correlation between particulate matter with an aerodynamic diameter of 10 μm or less (PM10) and PCa, the evidence is weaker compared to PM2.5. One study suggested a positive association between PM10 and PCa, with a 23% increase in the risk of PCa per 10 μg/m3 elevation in PM10 [17]. A Danish study reported a modest 1.06 risk ratio per 10 parts per billion (ppb) nitrogen dioxide (NO2) exposure [17]. However, contradictory findings exist, such as a 2016 Canadian study which did not find a link between NO2 and PCa mortality [15]. Further research, especially regarding the role of nitrous oxide (NO), NO2, and NOx in the risk of PCa is therefore necessary.
Overall, evidence regarding the association between exposure to PM2.5, PM10, NO, NO2, NOx, SO2, O3 and CO with PCa is limited and inconsistent. Therefore, this study aimed to explore the correlation between air pollution and PCa among Taiwanese men using data derived from the Taiwan Central Air Quality Monitoring Network in conjunction with an advanced medical system database.
Methods
Database and ethics statement
This study used data from the Kaohsiung Medical University Hospital Research Database (KMUHRD), which is comprised of electronic medical record data from various healthcare facilities within the KMU health system [18]. Established in 1957, this system predominantly serves the southern region of Taiwan through two regional hospitals and a medical center hospital. The KMUHRD contains comprehensive data on outpatient visits, hospital admissions, dental care, pharmaceutical records, and patient laboratory data [18]. To comply with the Personal Information Protection Act and ensure confidentiality, all identifiable personal data are encrypted [18]. This study strictly adhered to the ethical protocols established by the Institutional Review Board of Kaohsiung Medical University Hospital (IRB number: KMUHIRB-E(I)-20200002), which were accepted on February 11, 2020 and remain in effect until December 31, 2028, alongside the principles outlined in the Helsinki Declaration of the World Medical Association.
Study population
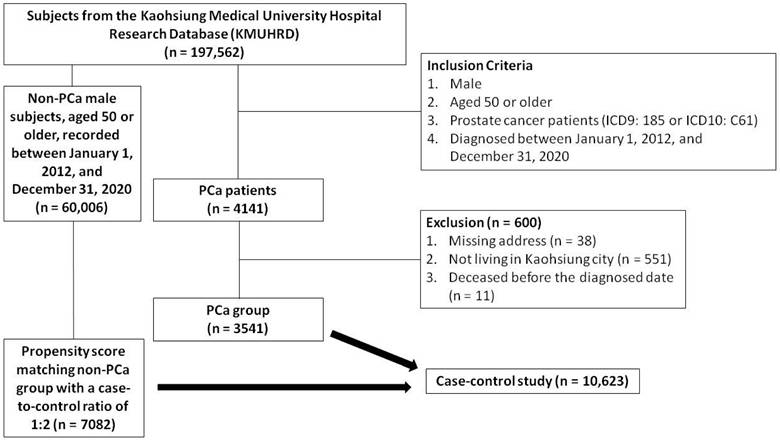
A total of 197,562 subjects were identified in the KMUHRD. The PCa group consisted of men aged 50 years or older, diagnosed between January 1, 2012 and December 31, 2020, and identified using ICD9 diagnosis code 185 or ICD10 diagnosis code C61 in outpatient and hospitalization records. Individuals with incomplete addresses, those not living in Kaohsiung, and those who died before the diagnosis were excluded. A total of 4141 patients diagnosed with PCa were initially identified in the KMUHRD based on the inclusion criteria. After applying the exclusion criteria, 3541 patients were included as the PCa cohort. An additional cohort of 60,006 male subjects without PCa, aged 50 years or older, recorded between January 1, 2012 and December 31, 2020 were also obtained from the KMUHRD. Comprehensive clinical data were available for both groups, including demographics, comorbidities, Charlson Comorbidity Index, residence, mortality, and medication history (including dyslipidemia, hypertension, diabetes mellitus, and analgesics). Propensity score matching was conducted based on baseline characteristics using logistic regression, with each case matched with two controls at a 1:2 ratio based on propensity scores. The index date of the cases was defined as the data of PCa diagnosis, and this date was also used for the matched control pairs. The study enrollment process with details of the inclusion and exclusion criteria is shown in Figure 1.
Flow chart of study enrollment.
Air pollutant assessments
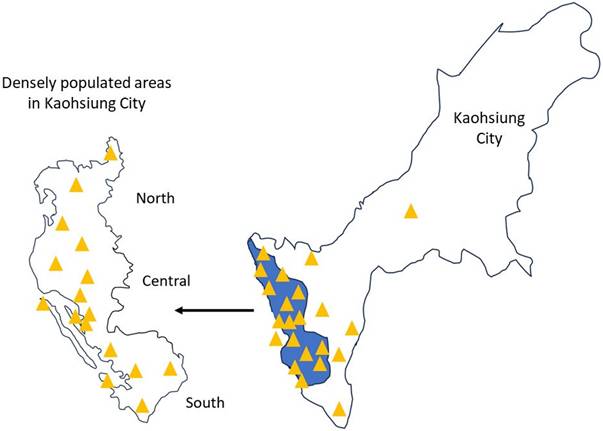
We linked the residential addresses of the study subjects with air pollution data from the Taiwan Central Air Quality Monitoring Network, matching each address with the nearest monitoring station to retrieve relevant records [11, 19]. The Taiwan Central Air Quality Monitoring Network comprises 21 general air quality monitoring stations located in densely populated areas or regions susceptible to elevated pollution levels in Kaohsiung City, divided into north, central, and south regions (Figure 2) [19]. These stations are strategically positioned to consider factors such as pollution sources, geographical and meteorological conditions, population density, and effectiveness in evaluating pollution control measures [19]. Similarly, the placement of sampling ports follows meticulous guidelines to avoid the direct influence of pollution, and ensure obstruction-free airflow and accurate pollutant concentration readings. The height of the sampling port is determined based on the vertical distribution of pollutants around the station [19]. Using these data, we estimated the daily mean concentrations of PM2.5, PM10, NO, NO2, NOx, SO2, O3 and CO from 1993 to 2022 for each participant.
Central Air Quality Monitoring Network in Kaohsiung City.
PCa assessments
The diagnosis of PCa was identified based on specific patient codes (ICD9: 185 or ICD10: C61) from the Taiwan Cancer Registry. This government-led body compiles cancer data from 22,520,776 individuals, and requires cancer reports from both private and public hospitals. The extensive National Health Insurance program in Taiwan has covered cancer care since March 1995, and ensures highly accurate case records. The registry operates following standardized procedures, and it is overseen by experts and subjected to stringent computer checks and regular audits for precision and consistency, minimizing errors and discrepancies.
Potential confounders
Besides age [20], we controlled for various established confounders associated with PCa, including geographic air pollution zone (Central, North, and South Kaohsiung) [21], benign prostate hyperplasia (ICD9: 600 or ICD10: N40) [20], and other comorbidities including cerebrovascular disease (ICD9: 430-438 or ICD10: I67) [20], hypertension (ICD9: 401.1 or ICD10: I10) [22], diabetes mellitus (ICD9: 250 or ICD10: E11) [20], dyslipidemia (ICD9: 272 or ICD10: E78) [22], congestive heart failure (ICD9: 428 or ICD10: E50) [23], chronic kidney disease (ICD9: 585 or ICD10: N18) [24], chronic obstructive pulmonary disease (ICD9: 490-496 or ICD10: J44) [25], myocardial infarction (ICD9: 410 or ICD10: I21) [23], and peripheral vascular disease (ICD9: 443.9 or ICD10: I73.9) [23]. In addition, we identified medications potentially associated with PCa, including treatments for benign prostate hyperplasia (alpha blockers and 5α-reductase inhibitors) [26], dyslipidemia (statins) [22], hypertension (angiotensin-converting enzyme inhibitors, angiotensin 2 receptor blockers, calcium channel blockers, and beta blockers) [22], diabetes mellitus (SGLT2 inhibitors, biguanides) [22], aspirin [22], and nonsteroidal anti-inflammatory drugs (NSAIDs) [22]. Data on these confounders were extracted from all claims made within 1 year before the index date.
Statistical analyses
Clinical characteristics were presented as categorical data (number, percent) and compared between the PCa and non-PCa groups using Pearson's chi-square test. Air pollutant concentrations at various intervals before the index date were presented as continuous data (mean, standard deviation, minimum, maximum, and interquartile range), with differences between the PCa and non-PCa groups assessed using a two-sample test. Normality was evaluated using the Kolmogorov-Smirnov test, and for non-normally distributed continuous variables, including air pollutant levels, data transformations were applied, such as presenting values as interquartile ranges (IQRs) when distributions were skewed. Conditional logistic regression was performed to examine associations between air pollutant exposure and PCa risk. Given the presence of multiple pollutants, which could affect model validity, collinearity analysis was conducted by examining the correlation matrix in the logistic regression model and performing variance inflation factor (VIF) analysis in a linear regression model, with multicollinearity defined as |r| > 0.8 or VIF > 5; pollutants exhibiting severe multicollinearity were excluded to ensure analytical robustness. To further explore risk patterns, we standardized the concentrations of eight air pollutants (PM10, PM2.5, NO, NO2, NOx, SO2, O3, and CO) using Z-score normalization, calculated as Z = (X - µ)/σ, where X represents the raw pollutant concentration, μ is the mean, and σ is the standard deviation. A combined-risk Z-score, defined as the mean of the Z-scores across all pollutants, was used to represent overall air pollution exposure. For sensitivity analysis, the combined-risk Z-score was treated as a continuous variable in regression models to assess the robustness of the findings, while in the subgroup analysis, associations were examined stratified by station regions to determine whether air pollution's impact on PCa risk varied across locations. A significance level of < 0.05 was considered, and all analyses were conducted using SAS (version 9.4, Cary, North Carolina).
Results
Clinical characteristics of the study participants
The clinical characteristics of the PCa and non-PCa groups both before and after propensity score matching are shown in Table 1. Following propensity score matching, the PCa and non-PCa groups comprised 3541 and 7082 subjects, respectively. In the PCa group, 2.1% were aged 50-54 years, while the majority (42.8%) were over 75. The PCa group had high rates of comorbidities, including 45.7% with hypertension, 7.5% with diabetes mellitus, 22.9% with dyslipidemia, and 12.2% with chronic kidney disease. Notably, the usage rates of 5α-reductase inhibitors (0.7% vs 0.3%), alpha blockers (28.4% vs 6.7%), and NASIDs (10.1% vs 7.2%) were higher in the PCa group compared to the non-PCa group.
Clinical characteristics of the study participants
| Before matching | After matching | |||||
|---|---|---|---|---|---|---|
| PCa group | Non-PCa group | p-value | PCa group | Non-PCa group | p-value | |
| n | 3541 | 60,006 | 3541 | 7082 | ||
| Age* | ||||||
| 50-54 | 73 (2.1%) | 14,283 (23.8%) | < 0.001 | 73 (2.1%) | 146 (2.1%) | 0.162 |
| 55-64 | 583 (16.5%) | 21,510 (35.8%) | 583 (16.5%) | 1166 (16.5%) | ||
| 65-74 | 1368 (38.6%) | 15,131 (25.2%) | 1368 (38.6%) | 2736 (38.6%) | ||
| 75+ | 1517 (42.8%) | 9082 (15.1%) | 1517 (42.8%) | 3034 (42.8%) | ||
| Comorbidities (n, %) | ||||||
| Cerebrovascular disease* | 445 (12.6%) | 4533 (7.6%) | < 0.001 | 445 (12.6%) | 911 (12.9%) | 0.666 |
| Hypertension* | 1618 (45.7%) | 16,871 (28.1%) | < 0.001 | 1618 (45.7%) | 3235 (45.7%) | 0.989 |
| Diabetes mellitus* | 265 (7.5%) | 3130 (5.2%) | < 0.001 | 265 (7.5%) | 522 (7.4%) | 0.834 |
| Dyslipidemia* | 810 (22.9%) | 11,498 (19.2%) | < 0.001 | 810 (22.9%) | 1609 (22.7%) | 0.857 |
| CHF* | 208 (5.9%) | 2259 (3.8%) | < 0.001 | 208 (5.9%) | 406 (5.7%) | 0.769 |
| CKD* | 433 (12.2%) | 4130 (6.9%) | < 0.001 | 433 (12.2%) | 868 (12.3%) | 0.967 |
| Myocardial infarction* | 127 (3.6%) | 2305 (3.8%) | 0.443 | 127 (3.6%) | 237 (3.3%) | 0.521 |
| Peripheral vascular disease | 62 (1.8%) | 741 (1.2%) | 0.008 | 62 (1.8%) | 130 (1.8%) | 0.757 |
| Charlson's Index Categories (n, %)* | < 0.001 | 0.995 | ||||
| 0 | 1029 (29.1%) | 32404 (54%) | 1029 (29.1%) | 2066 (29.2%) | ||
| 1-2 | 978 (27.6%) | 17365 (28.9%) | 978 (27.6%) | 1965 (27.7%) | ||
| 3-4 | 504 (14.2%) | 3825 (6.4%) | 504 (14.2%) | 997 (14.1%) | ||
| 4+ | 1030 (29.1%) | 6412 (10.7%) | ||||
| Area | < 0.001 | < 0.001 | ||||
| Central | 2458 (69.4%) | 37805 (63%) | 2458 (69.4%) | 4679 (66.1%) | ||
| North | 528 (14.9%) | 8326 (13.9%) | 528 (14.9%) | 888 (12.5%) | ||
| South | 555 (15.7%) | 13875 (23.1%) | 555 (15.7%) | 1515 (21.4%) | ||
| Death (n,%)* | < 0.001 | 0.525 | ||||
| No | 2530 (71.4%) | 51993 (86.6%) | 2530 (71.4%) | 5018 (70.9%) | ||
| Yes | 1011 (28.6%) | 8013 (13.4%) | 1011 (28.6%) | 2064 (29.1%) | ||
| Medications (n, %) | ||||||
| Statins | 285 (8%) | 569 (8%) | 0.980 | |||
| Antihypertension | 514 (14.5%) | 1031 (14.6%) | 0.953 | |||
| 5ARIs | 25 (0.7%) | 19 (0.3%) | 0.001 | |||
| Aspirin | 366 (10.3%) | 758 (10.7%) | 0.562 | |||
| Alpha blockers | 1007 (28.4%) | 476 (6.7%) | < 0.001 | |||
| Anti-diabetes | 109 (3.1%) | 269 (3.8%) | 0.059 | |||
| NSAIDs | 357 (10.1%) | 509 (7.2%) | < 0.001 | |||
* propensity score matching variable.
Abbreviations: PCa: prostate cancer; CHF: congestive heart failure; CKD: chronic kidney disease; 5ARI: 5α-reductase inhibitors; NSAIDs: nonsteroidal anti-inflammatory drugs.
The average levels of air pollutant exposure in all subjects
The average levels of air pollutant exposure in the study population are presented in Supplemental Table 1. At the index date, the average exposure levels of PM10, PM2.5, NO, NO2, NOx, SO2, O3 and CO were 60.25 ± 12.87 μg/m3, 29.40 ± 7.39 μg/m3, 4.13 ± 1.43 ppb, 18.32 ± 3.30 ppb, 22.43 ± 4.60 ppb, 4.67 ± 1.58 ppb, 28.37 ± 2.91 ppb, and 0.50 ± 0.09 parts per million (ppm), respectively. At 1 year before the index date, the average exposure levels of PM10, PM2.5, NO, NO2, NOx, and SO2 were 63.46 ± 12.78 μg/m3, 31.69 ± 8.65 μg/m3, 4.43 ± 1.62 ppb, 18.85 ± 3.35 ppb, 23.28 ± 4.82 ppb, 5.17 ± 1.80 ppb, 28.27 ± 2.91 ppb, and 0.51 ± 0.10 ppm, respectively. Similar average levels of air pollutant exposure were observed at 2 years, 3 years, and 5 years before the index date.
The average levels of air pollutant exposure in the PCa and non-PCa groups
The average levels of air pollutant exposure in both the PCa and non-PCa groups for each of the 5 years before the index date are shown in Table 2. At the index date, the average exposure levels of PM10, PM2.5, NO, NO2, NOx, SO2, O3 and CO were 60.70 ± 12.80 μg/m3, 29.44 ± 7.31 μg/m3, 4.09 ± 1.39 ppb, 18.26 ± 3.25 ppb, 22.34 ± 4.51 ppb, 4.61 ± 1.51 ppb, 28.39 ± 2.90 ppb, and 0.5 0 ± 0.10 ppm in the PCa group, and 60.03 ± 12.89 μg/m3, 29.37 ± 7.44 μg/m3, 4.15 ± 1.45 ppb, 18.35 ± 3.33 ppb, 22.48 ± 4.64 ppb, and 4.70 ± 1.62 ppb, 28.37 ± 2.92 ppb, and 0.49 ± 0.09 ppm in the non-PCa group, respectively. Similar average exposure levels were observed at the index date, and at 1 year, 2 years, 3 years, and 5 years (Table 2).
The average levels of air pollutant exposure in the PCa and non-PCa groups
| PCa group | Non-PCa group | p-value | ||
|---|---|---|---|---|
| n | 3541 | 7082 | ||
| Average exposure levels at the index date | ||||
| PM10 (μg/m3) | 60.70 ± 12.80 | 60.03 ± 12.89 | 0.0109 | |
| PM2.5 (μg/m3) | 29.44 ± 7.31 | 29.37 ± 7.44 | 0.6819 | |
| NO (ppb) | 4.09± 1.39 | 4.15 ± 1.45 | 0.0428 | |
| NO2 (ppb) | 18.26 ± 3.25 | 18.35± 3.33 | 0.1865 | |
| NOx (ppb) | 22.34 ± 4.51 | 22.48 ± 4.64 | 0.1238 | |
| SO2 (ppb) | 4.6 1± 1.51 | 4.70 ± 1.62 | 0.0040 | |
| O3 (ppb) | 28.39 ± 2.90 | 28.37 ± 2.92 | 0.7561 | |
| CO (ppm) | 0.50 ± 0.10 | 0.49 ± 0.09 | 0.0035 | |
| 1-year average exposure levels before index date | ||||
| PM10 (μg/m3) | 63.90 ± 12.54 | 63.24 ± 12.90 | 0.0125 | |
| PM2.5 (μg/m3) | 31.77 ± 8.49 | 31.56 ± 8.73 | 0.5284 | |
| NO (ppb) | 4.41 ± 1.60 | 4.44 ± 1.64 | 0.3093 | |
| NO2 (ppb) | 18.82 ± 3.29 | 18.86 ± 3.38 | 0.5484 | |
| NOx (ppb) | 23.23 ± 4.74 | 23.30 ± 4.87 | 0.4529 | |
| SO2 (ppb) | 5.10 ± 1.72 | 5.20 ± 1.84 | 0.0100 | |
| O3 (ppb) | 28.22 ± 2.90 | 28.30 ± 2.91 | 0.2232 | |
| CO (ppm) | 0.52 ± 0.10 | 0.51 ± 0.10 | 0.0020 | |
| 2-year average exposure levels before index date | ||||
| PM10 (μg/m3) | 65.79 ± 11.42 | 65.15 ± 11.68 | 0.0081 | |
| PM2.5 (μg/m3) | 32.85 ± 7.92 | 32.74 ± 8.13 | 0.5291 | |
| NO (ppb) | 4.59 ± 1.63 | 4.62 ± 1.67 | 0.3343 | |
| NO2 (ppb) | 19.26 ± 3.27 | 19.29 ± 3.35 | 0.6476 | |
| NOx (ppb) | 23.85 ± 4.78 | 23.91 ± 4.90 | 0.5334 | |
| SO2 (ppb) | 5.41 ± 1.79 | 5.50 ± 1.89 | 0.0179 | |
| O3 (ppb) | 28.10 ± 2.59 | 28.14 ± 2.63 | 0.4610 | |
| CO (ppm) | 0.52 ± 0.09 | 0.52 ± 0.1 | 0.0017 | |
| 3-year average exposure levels before index date | ||||
| PM10 (μg/m3) | 67.39 ± 10.57 | 66.81 ± 10.74 | 0.0085 | |
| PM2.5 (μg/m3) | 34.00 ± 7.63 | 33.89 ± 7.86 | 0.4819 | |
| NO (ppb) | 4.75 ± 1.65 | 4.78 ± 1.70 | 0.4010 | |
| NO2 (ppb) | 19.60 ± 3.25 | 19.62 ± 3.31 | 0.7305 | |
| NOx (ppb) | 24.35 ± 4.80 | 24.40 ± 4.91 | 0.6044 | |
| SO2 (ppb) | 5.64 ± 1.79 | 5.72 ± 1.88 | 0.0202 | |
| O3 (ppb) | 27.99 ± 2.41 | 28.02 ± 2.44 | 0.5547 | |
| CO (ppm) | 0.53 ± 0.10 | 0.52 ± 0.10 | 0.0016 | |
| 5-year average exposure levels before index date | ||||
| PM10 (μg/m3) | 69.36 ± 9.49 | 68.89 ± 9.59 | 0.0170 | |
| PM2.5 (μg/m3) | 35.70 ± 7.00 | 35.58 ± 7.21 | 0.4433 | |
| NO (ppb) | 5.03 ± 1.61 | 5.06 ± 1.67 | 0.3758 | |
| NO2 (ppb) | 20.07 ± 3.14 | 20.09 ± 3.19 | 0.7267 | |
| NOx (ppb) | 25.09 ± 4.66 | 25.14 ± 4.78 | 0.6096 | |
| SO2 (ppb) | 5.97 ± 1.2 | 6.07 ± 1.82 | 0.0068 | |
| O3 (ppb) | 27.85 ± 2.25 | 27.86 ± 2.30 | 0.8252 | |
| CO (ppm) | 0.54 ± 0.10 | 0.53 ± 0.10 | 0.0020 |
Abbreviations: PCa = prostate cancer; PM2.5 = particulate matter with an aerodynamic diameter of 2.5 μm or less; PM10 = particulate matter with an aerodynamic diameter of 10 μm or less; SO2 = sulfur dioxide; NO = nitric oxide; NO2 = nitrogen dioxide; NOx = nitrogen oxide; O3 = ozone; CO = carbon monoxide; ppb = parts per billion; ppm = parts per million.
Specifically, the average PM10 levels in the PCa group were 60.70 ± 12.80 μg/m3, 63.90 ± 12.54 μg/m3, 65.79 ± 11.42 μg/m3, 67.39 ± 10.57 μg/m3, and 69.36 ± 9.49 μg/m3 at the index date, 1 year, 2 years, 3 years, and 5 years before the index date, respectively (Table 2). In comparison, the average PM10 levels in the non-PCa group were 60.03 ± 12.89 μg/m3, 63.24 ± 12.90 μg/m3, 65.15 ± 11.68 μg/m3, 66.81 ± 10.74 μg/m3, and 68.89 ± 9.59 μg/m3 at the same respective intervals. There were significant differences in PM10, SO2, and CO levels between the PCa and non-PCa groups at all time points. However, there were no significant differences in PM2.5, NO, NO2, and NOx between the two groups before the index date (Table 2).
Association between air pollutant exposure and PCa
All air pollutant levels exhibited non-normal distribution according to the Kolmogorov-Smirnov test (p-value < 0.05). To address this, we used the IQR method, and the resulting data are presented in Supplementary Table 2, categorized by the PCa and non-PCa groups. Then, we conducted a collinearity analysis of the air pollutant variables as shown in Supplementary Table 3 and Supplementary Table 4. Our findings indicate that only PM2.5 and CO do not exhibit severe multicollinearity. Therefore, we present the associations of PM2.5 and CO with PCa risk in Table 3, using conditional logistic regression models adjusted for station regions and co-medications. Our results found that the odds ratios for PM2.5 exposure at the index date, as well as the 1-year, 2-year, 3-year, and 5-year average exposure levels before the index date, were 1.240, 1.359, 1.393, 1.467, and 1.413, respectively, with all p-value < 0.001. Similarly, the odds ratios for CO exposure were 1.105, 1.105, 1.105, 1.096, and 1.094, respectively, with all p-value < 0.05.
Associations of PM2.5 and CO with the risk of PCa in the present study
| Index date* | 1 year* | 2 years* | 3 years* | 5 years* | |||||||||||
|---|---|---|---|---|---|---|---|---|---|---|---|---|---|---|---|
| OR | 95%CI | p-value | OR | 95%CI | p-value | OR | 95%CI | p-value | OR | 95%CI | p-value | OR | 95%CI | p-value | |
| Station regions (ref. north) | |||||||||||||||
| Central | 0.780 | (0.677-0.900) | 0.001 | 0.770 | (0.668-0.888) | < 0.001 | 0.772 | (0.669-0.890) | < 0.001 | 0.772 | (0.669-0.891) | < 0.001 | 0.764 | (0.662-0.882) | < 0.001 |
| South | 0.580 | (0.498-0.675) | < 0.001 | 0.564 | (0.485-0.656) | < 0.001 | 0.564 | (0.484-0.656) | < 0.001 | 0.561 | (0.482-0.652) | < 0.001 | 0.551 | (0.474-0.641) | < 0.001 |
| Air pollutants (Per IQR) | |||||||||||||||
| PM2.5 | 1.240 | (1.134-1.356) | < 0.001 | 1.359 | (1.233-1.497) | < 0.001 | 1.393 | (1.262-1.538) | < 0.001 | 1.467 | (1.313-1.639) | < 0.001 | 1.413 | (1.279-1.560) | < 0.001 |
| CO | 1.105 | (1.025-1.192) | 0.009 | 1.105 | (1.022-1.195) | 0.012 | 1.105 | (1.017-1.200) | 0.019 | 1.096 | (1.010-1.189) | 0.028 | 1.094 | (1.009-1.185) | 0.029 |
* Adjusted for station regions and co-medications.
Abbreviations: PCa = prostate cancer; IQR = interquartile range; OR = odds ratio; 95% CI = 95% confidence interval; PM2.5 = particulate matter with an aerodynamic diameter of 2.5 μm or less; CO = carbon monoxide.
Sensitivity and Subgroup Analyses of Air Pollutant Exposure and Prostate Cancer Risk
To further assess the impact of long-term exposure to multiple air pollutants on PCa risk prediction and explore regional variations, we conducted sensitivity and subgroup analyses. As shown in Table 4, the association between the combined-risk Z-score and PCa risk was evaluated, revealing that the odds ratios for exposure at the index date, as well as for 1-year, 2-year, 3-year, and 5-year average exposure levels prior to the index date, were 1.029, 1.033, 1.034, 1.034, and 1.033, respectively, with all p-values < 0.0001. Additional subgroup analyses based on station regions indicated a significant interaction effect, with the strongest association observed in central station regions (p for interaction < 0.001).
Association between each unit increase in the combined-risk Z-score for long-term pollutant exposure and prostate cancer risk
| Station regions | Central | South | North | ||||||||||
|---|---|---|---|---|---|---|---|---|---|---|---|---|---|
| Air pollutants | OR* | 95%CI | p-value | OR* | 95%CI | p-value | OR* | 95%CI | p-value | OR* | 95%CI | p-value | p for interaction** |
| Combined risk z score | |||||||||||||
| Index date | 1.029 | (1.020-1.039) | < 0.0001 | 1.041 | (1.028-1.055) | < 0.0001 | 0.991 | (0.958-1.026) | 0.616 | 1.008 | (0.946-1.074) | 0.809 | 0.0004 |
| 1 year | 1.033 | (1.024-1.043) | < 0.0001 | 1.045 | (1.032-1.059) | < 0.0001 | 1.002 | (0.967-1.038) | 0.913 | 1.025 | (0.955-1.101) | 0.489 | 0.0002 |
| 2 years | 1.034 | (1.025-1.044) | < 0.0001 | 1.046 | (1.033-1.059) | < 0.0001 | 1.000 | (0.966-1.036) | 0.979 | 1.025 | (0.953-1.103) | 0.501 | 0.0001 |
| 3 years | 1.034 | (1.025-1.044) | < 0.0001 | 1.046 | (1.033-1.059) | < 0.0001 | 0.998 | (0.964-1.033) | 0.914 | 1.019 | (0.947-1.096) | 0.618 | < 0.0001 |
| 5 years | 1.033 | (1.023-1.042) | < 0.0001 | 1.046 | (1.032-1.060) | < 0.0001 | 0.994 | (0.961-1.028) | 0.717 | 1.026 | (0.953-1.105) | 0.491 | < 0.0001 |
* The odds ratios are reported per unit increase in the combined-risk Z-score exposure at the index date, as well as the 1-year, 2-year, 3-year, and 5-year average exposure levels before the index date, and their association with prostate cancer risk after adjusting for covariates.
** The interaction term is the combined-risk Z-score | region, with the p-value for interaction indicating the significance of the regional differences in the effect of the combined-risk Z-score on prostate cancer risk.
Abbreviations: OR = odds ratio; 95% CI = 95% confidence interval.
Discussion
A total of 3,541 PCa patients and 7,082 age-matched controls were included in the present study. Our findings indicate that air pollution, particularly PM2.5 and CO, is correlated with PCa. After adjusting for confounders, we observed significant associations between prostate cancer and PM2.5 (OR [95% CI]: 1.240 [1.134-1.356]) and CO (OR [95% CI]: 1.105 [1.025-1.192]) at the index date and across multiple exposure periods. Sensitivity and subgroup analyses further confirm the impact of long-term exposure to multiple air pollutants on PCa risk prediction and explore regional variations. To the best of our knowledge, this study represents the largest case-control analysis examining the association between long-term exposure to air pollutants, especially PM2.5, CO, and PCa. Moreover, our results also provide insights into the air pollutant landscape in Taiwan, underscoring the significance of these pollutants in shaping public health policy development and strategies for disease prevention.
In this study, our findings revealed that the average yearly exposure levels of PM10, PM2.5, NO, NO2, NOx, SO2, O3 and CO at 1 year prior to the index date were 63.46 μg/m3, 31.69 μg/m3, 4.43 ppb, 18.85 ppb, 23.28 ppb, 5.17 ppb, 28.37 ppb and 0.50 ppm, respectively. The standard limits for outdoor air pollutants defined by the World Health Organization (WHO) [27], are 20 μg/m3 for PM10 (annual average), 10 μg/m3 for PM2.5 (annual average), 40 ppb for NO (annual average), 40 ppb for NO2 (annual average), 20 ppb for SO2 (24-hour average), 100 ppb for O3 (8-hour average) and 4 ppm (8-hour average). Compared to the WHO-recommended averages, the exposure levels of PM10 and PM2.5 were higher in the current study. This aligns with WHO estimates that 92% of the world's population lives in places where air quality levels exceed WHO limits [28]. According to our data and the WHO, the levels of air pollutants in Taiwan are also high, underscoring the importance of understanding the effects of air pollutants on PCa.
Our main finding is that PM2.5 was a significant risk factor for PCa after adjusting for confounding variables. Importantly, we demonstrated a consistent link between PM2.5 exposure and risk of PCa, even when considering cumulative values averaged over 1, 2, 3, and 5 years before the index date. Furthermore, stratifying air pollution indicators into quartiles consistently identified PM2.5 as prominent risk factor for PCa. Supporting our findings, a study conducted in Germany also demonstrated that exposure to PM2.5 increased the risk of PCa [17], and an Italian study showed a positive correlation between long-term exposure to PM2.5 and residing in cities with elevated air pollution levels and the incidence of PCa [29]. Research conducted in Denmark also revealed that men residing in regions with high air pollution levels, including PM2.5, had a greater risk of PCa compared to those in areas with lower pollution levels [30]. In addition, research conducted in the Tokyo metropolitan area identified a positive association between PM2.5 exposure and PCa mortality [31]. Furthermore, a study carried out in Shanghai, China, established that exposure to PM2.5 was linked to an increased risk of PCa [32]. Taken together, these findings along with the present study suggest that exposure to PM2.5 may be a risk factor for the development of PCa and related mortality across diverse global populations.
We also observed that long-term CO exposure was associated with an increased risk of PCa. However, data on the relationship between CO exposure and cancer remain limited. Epidemiological studies examining populations exposed to ambient CO concentrations have generally failed to demonstrate a significant association with increased cancer risk, including PCa [39], which does not fully support our findings. This discrepancy may stem from the fact that air pollutants do not act in isolation but rather exert a collective influence on cancer development. In this context, our finding that the combined-risk Z-score of eight air pollutants is associated with an increased risk of PCa provides a possible explanation. Although evidence supports a link between air pollution and prostate cancer risk, further research is needed to specifically elucidate CO's role in PCa development. Our study contributes valuable insights into this area, particularly for investigations focusing on CO as a key pollutant.
In the present study, no significant associations were found between PM10, NO, NO2, NOx, O3 and SO2 with PCa. A review of the literature revealed that the specific relationships between PM10, NO, NO2, NOx, O3 and SO2 with PCa remain inconclusive. While some studies suggest a potential link between PM10, NO2 and SO2 exposure with an increased risk of PCa, others do not [14, 15, 17, 33-36]. For example, a study conducted in Poland in 2017 [33] and another in Germany in 2018 [17] demonstrated a correlation between elevated PM10 levels and increased incidence of PCa. Conversely, other studies have failed to establish a clear association between PM10 and PCa [14, 34]. Similar discrepancies have been reported for NO2 and SO2, with some studies indicating a positive association with the risk of PCa, and others not identifying such an association [15, 34-36]. Therefore, further research is warranted to elucidate these complex relationships and to better understand the role of PM10, NO2, SO2, and other environmental factors in the risk of PCa.
In the subgroup analysis of our study, we observed a significant interaction between regions and air pollutants in relation to PCa risk. The Central region appeared to be more vulnerable, whereas the Southern and Northern regions did not show a significant association. This finding highlights the potential role of regional factors such as meteorology, pollutant composition, population characteristics, lifestyle, and healthcare access in modifying the impact of air pollution on PCa risk. Several possible explanations for these regional differences include variations in pollution levels and composition, differences in population susceptibility, and climate and atmospheric conditions (e.g., temperature, humidity, and wind patterns). Future studies should comprehensively consider these factors to disentangle the complex interplay between regional influences, potential confounders, and air pollutant exposure in PCa development.
The precise mechanisms underlying the association between PM2.5 exposure and PCa have yet to be elucidated, but they are believed to be linked to oxidative stress and inflammation [7, 9, 10]. PM2.5 exposure has been demonstrated to increase reactive oxygen species production, potentially causing DNA damage and leading to mutagenesis and cancer development [37]. Furthermore, PM2.5 exposure has been reported to provoke the release of inflammatory cytokines, thus fostering the proliferation and dissemination of cancer cells [38]. Other potential mechanisms have also been postulated for the association between PM2.5 and risk of PCa. These mechanisms include the effect of PM2.5 exposure on disrupting hormone levels critical for PCa progression, causing alterations in gene expression via epigenetic modifications, decreasing immune function, and causing angiogenesis in the prostate gland, thereby facilitating cancer progression. The mechanism of CO.
Limited information is available on the mechanisms by which CO may contribute to the development of PCa. One potential pathway is CO's ability to bind to hemoglobin, reducing oxygen delivery to tissues and inducing hypoxia, a well-established factor in tumor progression, angiogenesis, and metastasis [39]. Furthermore, CO exposure has been linked to increased oxidative stress and chronic inflammation, both of which play critical roles in carcinogenesis. Persistent inflammation may create a pro-tumorigenic microenvironment, further facilitating cancer development [39]. In addition, high CO exposure is often associated with smoking and other environmental pollutants known to elevate PCa risk [39]. These potential mechanisms underscore the need for further research to clarify the role of CO in PCa pathophysiology.
Several limitations to this study need to be addressed. First, while efforts were made to adjust for potential confounding variables, other factors that may influence the association between air pollution and PCa may not have been included in the analysis. Second, the study sample consisted predominantly of Asian males from Kaohsiung City, limiting the generalizability of our findings to other ethnicities or populations residing in different geographical regions. Disparities in lifestyle factors, genetic predisposition, and environmental exposure among different populations may influence the observed link between pollution and PCa. Third, air pollution estimates relied on data from the Taiwan Environmental Protection Agency's Environmental Pollution Index, which, although widely employed, may not precisely reflect individual-level exposure to air pollutants. Fourth, as with any observational study, causal inference cannot be drawn, and residual confounding from unmeasured variables may have affected the observed association between air pollution and PCa. Fifth, reliance on data from medical databases introduces potential biases related to data accuracy and completeness. Sixth, the absence of information regarding PCa severity may have impacted the interpretation of the relationship between air pollution and risk of PCa. Lastly, while this study provides evidence to support an association between air pollution and PCa, further research is needed to explore the mechanisms underlying this relationship.
Conclusion
Our findings suggest an association between air pollution, particularly PM2.5 and CO, and PCa. These findings have potential implications for informing future policy initiatives and strategies for disease prevention. Nonetheless, further research is needed to verify these findings and elucidate the underlying mechanistic pathways involved.
Supplementary Material
Supplementary figures and tables.
Acknowledgements
The authors thank the help from the Division of Medical Statistics and Bioinformatics, Department of Medical Research, Kaohsiung Medical University Hospital, Kaohsiung Medical University. This work was partially supported by the Research Center for Environmental Medicine, Kaohsiung Medical University, Kaohsiung, Taiwan, and the Featured Areas Research Center Program within the framework of the Higher Education Sprout Project by the Ministry of Education (MOE) in Taiwan and the Ministry of Science and Technology research grant in Taiwan (MOST 111-2314-B-037-061 and MOST 112-2314-B-037-115-MY2); the Kaohsiung Medical University Research Center Grant (KMU-TC109A01-1; NHRIKMU-113-I001; KMUH112-2R59); and Kaohsiung Municipal Siaogang Hospital (S-108-017; S-111-16; kmhk-112-23; S-112-01; H-113-10; S-113-01).
Competing Interests
The authors have declared that no competing interest exists.
References
1. Lin PH, Chang SW, Tsai LH, Kan HC, Liu JM, Chuang CK. et al. Increasing incidence of prostate cancer in Taiwan: A study of related factors using a nationwide health and welfare database. Medicine. 2020;99:e22336
2. de Bono J, Mateo J, Fizazi K, Saad F, Shore N, Sandhu S. et al. Olaparib for Metastatic Castration-Resistant Prostate Cancer. The New England journal of medicine. 2020;382:2091-102
3. Beer TM, Armstrong AJ, Rathkopf DE, Loriot Y, Sternberg CN, Higano CS. et al. Enzalutamide in metastatic prostate cancer before chemotherapy. The New England journal of medicine. 2014;371:424-33
4. Sartor O, de Bono J, Chi KN, Fizazi K, Herrmann K, Rahbar K. et al. Lutetium-177-PSMA-617 for Metastatic Castration-Resistant Prostate Cancer. The New England journal of medicine. 2021;385:1091-103
5. James ND, de Bono JS, Spears MR, Clarke NW, Mason MD, Dearnaley DP. et al. Abiraterone for Prostate Cancer Not Previously Treated with Hormone Therapy. The New England journal of medicine. 2017;377:338-51
6. Brauer M, Freedman G, Frostad J, van Donkelaar A, Martin RV, Dentener F. et al. Ambient Air Pollution Exposure Estimation for the Global Burden of Disease 2013. Environmental science & technology. 2016;50:79-88
7. Lodovici M, Bigagli E. Oxidative stress and air pollution exposure. Journal of toxicology. 2011;2011:487074
8. Kelly FJ. Oxidative stress: its role in air pollution and adverse health effects. Occupational and environmental medicine. 2003;60:612-6
9. Chuang KJ, Chan CC, Su TC, Lee CT, Tang CS. The effect of urban air pollution on inflammation, oxidative stress, coagulation, and autonomic dysfunction in young adults. American journal of respiratory and critical care medicine. 2007;176:370-6
10. Glencross DA, Ho TR, Camiña N, Hawrylowicz CM, Pfeffer PE. Air pollution and its effects on the immune system. Free radical biology & medicine. 2020;151:56-68
11. Wu DW, Cheng YC, Wang CW, Hung CH, Chen PS, Chu-Sung Hu S. et al. Impact of the synergistic effect of pneumonia and air pollutants on newly diagnosed pulmonary tuberculosis in southern Taiwan. Environmental research. 2022;212:113215
12. Doiron D, de Hoogh K, Probst-Hensch N, Fortier I, Cai Y, De Matteis S. et al. Air pollution, lung function and COPD: results from the population-based UK Biobank study. The European respiratory journal. 2019 54
13. Al-Kindi SG, Brook RD, Biswal S, Rajagopalan S. Environmental determinants of cardiovascular disease: lessons learned from air pollution. Nature reviews Cardiology. 2020;17:656-72
14. Yu P, Guo S, Xu R, Ye T, Li S, Sim MR. et al. Cohort studies of long-term exposure to outdoor particulate matter and risks of cancer: A systematic review and meta-analysis. Innovation (Cambridge (Mass)). 2021;2:100143
15. Youogo LMK, Parent ME, Hystad P, Villeneuve PJ. Ambient air pollution and prostate cancer risk in a population-based Canadian case-control study. Environmental epidemiology (Philadelphia, Pa). 2022;6:e219
16. Su SY, Liaw YP, Jhuang JR, Hsu SY, Chiang CJ, Yang YW. et al. Associations between ambient air pollution and cancer incidence in Taiwan: an ecological study of geographical variations. BMC public health. 2019;19:1496
17. Datzmann T, Markevych I, Trautmann F, Heinrich J, Schmitt J, Tesch F. Outdoor air pollution, green space, and cancer incidence in Saxony: a semi-individual cohort study. BMC public health. 2018;18:715
18. Lee MY, Hsiao PJ, Huang YT, Huang JC, Hsu WH, Chen SC. et al. Greater HbA1c variability is associated with increased cardiovascular events in type 2 diabetes patients with preserved renal function, but not in moderate to advanced chronic kidney disease. PloS one. 2017;12:e0178319
19. Su WY, Wu DW, Tu HP, Chen SC, Hung CH, Kuo CH. Association between ambient air pollutant interaction with kidney function in a large Taiwanese population study. Environmental science and pollution research international. 2023;30:82341-52
20. Gann PH. Risk factors for prostate cancer. Reviews in urology. 2002;4(Suppl 5):S3-s10
21. Dasgupta P, Baade PD, Aitken JF, Ralph N, Chambers SK, Dunn J. Geographical Variations in Prostate Cancer Outcomes: A Systematic Review of International Evidence. Frontiers in oncology. 2019;9:238
22. Geng JH, Plym A, Penney KL, Pomerantz M, Mucci LA, Kibel AS. Metabolic syndrome and its pharmacologic treatment are associated with the time to castration-resistant prostate cancer. Prostate cancer and prostatic diseases. 2022;25:320-6
23. Crawford ED, Hafron JM, Debruyne F, Wallis C, Chang S, Garnick MB. Cardiovascular Risk in Prostate Cancer Patients Using Luteinizing Hormone-Releasing Hormone Agonists or a Gonadotropin-Releasing Hormone Antagonist. The Journal of urology. 2024;211:63-70
24. AlOmeir OK. Risk of Prostate Cancer in Chronic Kidney Disease Patient: A Meta-Analysis using Observational Studies. Journal of pharmacy & bioallied sciences. 2023;15:21-8
25. Lin HW, Lin LF, Chen HC, Liou TH, Huang SW. Chronic obstructive pulmonary disease with short-acting inhaled pharmacotherapy increases the risk of prostate cancer: A two-stage database approach. PloS one. 2018;13:e0203377
26. Preston MA, Wilson KM, Markt SC, Ge R, Morash C, Stampfer MJ. et al. 5α-Reductase inhibitors and risk of high-grade or lethal prostate cancer. JAMA internal medicine. 2014;174:1301-7
27. Hoffmann B, Boogaard H, de Nazelle A, Andersen ZJ, Abramson M, Brauer M. et al. WHO Air Quality Guidelines 2021-Aiming for Healthier Air for all: A Joint Statement by Medical, Public Health, Scientific Societies and Patient Representative Organisations. International journal of public health. 2021;66:1604465
28. Kirby T. WHO: 92% of the world's population breathe polluted air. The Lancet Respiratory medicine. 2016;4:862
29. Cazzolla Gatti R, Di Paola A, Monaco A, Velichevskaya A, Amoroso N, Bellotti R. The spatial association between environmental pollution and long-term cancer mortality in Italy. The Science of the total environment. 2023;855:158439
30. Tybjerg AJ, Friis S, Brown K, Nilbert MC, Morch L, Køster B. Updated fraction of cancer attributable to lifestyle and environmental factors in Denmark in 2018. Scientific reports. 2022;12:549
31. Hasegawa K, Tsukahara T, Nomiyama T. Association between Air Pollutants and Cancer Incidence Rates in Japan: An Ecological Study. Medical Sciences Forum. 2021;4:15
32. Cong X. Air pollution from industrial waste gas emissions is associated with cancer incidences in Shanghai, China. Environmental science and pollution research international. 2018;25:13067-78
33. Ćwieląg-Drabek M, Marchwińska-Wyrwa E, Piekut A, Hajok I, Spychała A. Could inequalities of prostate cancer occurrence be explained by environmental risk factors? Małgorzata Ćwieląg-Drabek. European Journal of Public Health. 2017 27
34. Turner MC, Andersen ZJ, Baccarelli A, Diver WR, Gapstur SM, Pope CA 3rd. et al. Outdoor air pollution and cancer: An overview of the current evidence and public health recommendations. CA: a cancer journal for clinicians. 2020
35. Wei Y, Danesh Yazdi M, Ma T, Castro E, Liu CS, Qiu X. et al. Additive effects of 10-year exposures to PM(2.5) and NO(2) and primary cancer incidence in American older adults. Environmental epidemiology (Philadelphia, Pa). 2023;7:e265
36. Coleman NC, Burnett RT, Higbee JD, Lefler JS, Merrill RM, Ezzati M. et al. Cancer mortality risk, fine particulate air pollution, and smoking in a large, representative cohort of US adults. Cancer causes & control: CCC. 2020;31:767-76
37. Gangwar RS, Bevan GH, Palanivel R, Das L, Rajagopalan S. Oxidative stress pathways of air pollution mediated toxicity: Recent insights. Redox biology. 2020;34:101545
38. Xu Z, Ding W, Deng X. PM(2.5), Fine Particulate Matter: A Novel Player in the Epithelial-Mesenchymal Transition? Frontiers in physiology. 2019;10:1404
39. Wilbur S, Williams M, Williams R. et al. Toxicological Profile for Carbon Monoxide. Atlanta (GA): Agency for Toxic Substances and Disease Registry (US). 2012 Jun. Available from: https://www.ncbi.nlm.nih.gov/books/NBK153693/
Author contact
![]() Corresponding author: Shu-Pin Huang, Department of Urology, Kaohsiung Medical University, No. 100, Shih-Chuan 1st Road, Kaohsiung, Taiwan 807378. Phone: 886-7-3121101 ext. 6694; Fax: 886-7-3211033; Email: shpihu73com
Corresponding author: Shu-Pin Huang, Department of Urology, Kaohsiung Medical University, No. 100, Shih-Chuan 1st Road, Kaohsiung, Taiwan 807378. Phone: 886-7-3121101 ext. 6694; Fax: 886-7-3211033; Email: shpihu73com