Impact Factor ISSN: 1449-1907
- Issue 9; 2026
- Issue 8; 2026
- Issue 7; 2026
- Issue 6; 2026
- Issue 5; 2026
- Volume 23; 2026
- Past Issues
- Editorial Board
- Cover Images
- Index & Coverage
- Cover Suggestion
- Special Issues
1. Introduction
2 Materials and Methods
3. Results
4. Discussion
5. Conclusion
Abbreviations
Supplementary Material
Acknowledgements
References

 Global reach, higher impact
Int J Med Sci 2025; 22(10):2470-2487. doi:10.7150/ijms.112735 This issue Cite
Research Paper
Exploring Renin-angiotensin System Genes as Novel Prognostic Biomarkers for Oral Squamous Cell Carcinoma
Zhengzheng Wu1#, Can Wang1#, Jiusong Han2#, Xiaobing Chen1, Jie Wu1, Bin Cheng1 ![]() , Juan Wang1
, Juan Wang1 ![]()
1. Hospital of Stomatology, Guangdong Provincial Key Laboratory of Stomatology, Sun Yat-sen University, Guangzhou 510055, Guangdong, People's Republic of China.
2. Stomatological Hospital, School of Stomatology, Southern Medical University, S366 Jiangnan Boulevard, Guangzhou 510280, Guangdong, People's Republic of China.
#These authors contributed equally to this work: Zhengzheng Wu, Jiusong Han, Can Wang.
Received 2025-2-24; Accepted 2025-4-15; Published 2025-4-28
Abstract

Purpose: Recent evidence suggests that the renin-angiotensin system (RAS) is involved in OSCC development. This study aimed to identify RAS-related gene (RASRG) biomarkers associated with OSCC prognosis through integrated bioinformatics analysis.
Methods: First, we identified module genes by intersecting differentially expressed genes (DEGs) from the TCGA-OSCC dataset with RASRGs using weighted gene co-expression network analysis (WGCNA). Next, Cox and least absolute shrinkage and selection operator (LASSO) regression analyses were utilized to construct an OSCC risk model. We also created a nomogram incorporating risk scores and relevant clinical variables. Subsequently, receiver operating characteristic (ROC) analysis, Kaplan-Meier (KM) curve analysis, Cox regression analysis, and in vitro experiments were performed to assess the accuracy of the prognostic risk model and nomogram. Furthermore, protein-protein interaction (PPI) network, immune infiltration analysis and functional enrichment analyses were employed to reveal OSCC-related pathogenic genes and underlying mechanisms.
Results: A novel OSCC risk model was established consisting of six key genes: CMA1, CTSG, OLR1, SPP1, AQP1, and PTX3. This six-gene signature effectively predicted the prognosis of patients with OSCC and served as a reliable independent prognostic parameter. Protein-protein interaction network analysis identified 5 hub genes and 13 miRNAs. Immune infiltration analysis indicated a possible association of the prognostic features of RASRGs with immunomodulation.
Conclusion: In this study, we successfully constructed a risk model based on the six identified RAS-related DEGs as potential predictive biomarkers for OSCC.
Keywords: oral squamous cell carcinoma, renin-angiotensin system-related genes, biomarkers, prognosis, risk score
1. Introduction
Head and neck squamous cell carcinoma (HNSCC) is one of the most common malignant epithelial tumors, with oral squamous cell carcinoma (OSCC) being the most prevalent subtype [1,2]. Currently, the standard treatment for OSCC includes surgery, with or without radiotherapy and chemotherapy. Despite advances in early detection and therapeutic strategies, the 5-year survival rate for patients with OSCC remains approximately 50%, largely due to regional relapse and distant metastasis [3]. Traditional prognostic indicators, such as tumor staging and grading, fail to distinguish between carcinomas with different biological characteristics within the same histological subgroup. Therefore, there is an urgent need to identify effective prognostic biomarkers and therapeutic targets for OSCC.The renin-angiotensin system (RAS) consists mainly of renin, angiotensinogen (AGT), angiotensin I (Ang I), angiotensin-converting enzyme (ACE), angiotensin II (Ang II), angiotensin II type 1 receptor (AT1R), and angiotensin II type 2 receptor (AT2R) [4]. It is an endocrine system that regulates blood pressure homeostasis and electrolyte balance, functioning at both systemic and local levels [5]. Accumulating evidence suggests that alterations in the function and activity of the RAS play significant roles in carcinogenesis [6]. The ACE/Ang II/AT1R axis promotes angiogenesis, fibrosis, tumor invasion, and metastasis, exerting a tumorigenic role, whereas the ACE-2/Ang 1-7/MASR axis plays an anti-tumorigenic role in various cancers [7]. Recent studies have shown dysregulation of RAS components in OSCC, with RAS component expression demonstrated in cancer stem cells of several OSCC subtypes [8,9]. Furthermore, genetic variants in renin-angiotensin system-related genes (RASRGS) have been correlated with an increased risk of cancer development and poor prognosis [10]. These findings indicate that the RAS is associated with OSCC progression. However, few studies have investigated the prognostic value of RASRGs in patients with OSCC. Moreover, the biological functions of RASRGs in OSCC remain underexplored. In this study, we aimed to identify prognostic biomarkers of RASRGs and develop a prognostic signature for patients with OSCC. We comprehensively analyzed the expression of RASRGs in OSCC and their correlation with OSCC prognosis using The Cancer Genome Atlas (TCGA) and Gene Expression Omnibus (GEO) databases. We constructed a prognostic risk score model consisting of six differentially expressed RAS-related genes (RASRDEGs), namely CMA1, CTSG, OLR1, SPP1, AQP1, and PTX3, to evaluate the predictive value of RASRGs in OSCC. Finally, we experimentally validated the relationship between RASRDEGs and OSCC.
2 Materials and Methods
2.1 Data source and preprocessing
We downloaded the HNSCC dataset (TCGA-HNSC) from the TCGA database (https://portal.gdc.cancer.gov/) [11]. The OSCC dataset (TCGA-OSCC) extracted from this dataset was standardized to fragments per kilobase per million (FPKM) format and used as the test set for analyses. Corresponding clinical data obtained from the UCSC Xena database (https://xena.ucsc.edu/) [12] were presented in Table 1. After excluding samples lacking prognostic information, we obtained the count format sequencing data from 329 OSCC samples with prognostic information and 32 control samples. The GSE30784, GSE23558, and GSE25099 OSCC datasets were downloaded from the GEO database (https://www.ncbi.nlm.nih.gov/geo/) as validation sets [13-19], their specific chip information is shown in Table S1. The combined GEO datasets comprised 251 OSCC samples and 72 control samples after batching (Fig. S1) [20-22]. Genes in the TCGA-OSCC dataset and the integrated GEO datasets (Combined Datasets) were intersected, and only the intersecting genes were retained. A total 0f 155 RASRGs were collected from the GeneCards database (https://www.genecards.org/) and related literature [23], as shown in Table S2.
Characteristics of patients with OSCC in TCGA database
| Characteristics | Overall |
|---|---|
| Age, n (%) | |
| > 60 | 154 (52.2%) |
| <= 60 | 141 (47.8%) |
| Gender, n (%) | |
| MALE | 203 (68.8%) |
| FEMALE | 92 (31.2%) |
| N Stage, n (%) | |
| N0 | 115 (39%) |
| N2&3 | 107 (36.3%) |
| NX | 24 (8.1%) |
| N1 | 49 (16.6%) |
| T Stage, n (%) | |
| T4 | 109 (36.9%) |
| T1&2 | 121 (41%) |
| T3 | 65 (22%) |
| Stage, n (%) | |
| IV | 165 (55.9%) |
| I&II | 70 (23.7%) |
| III | 60 (20.3%) |
OSCC: oral squamous cell carcinoma
2.2 Identification of differently expressed renin-angiotensin related genes
Differentially expressed genes (DEGs) between OSCC and control samples were identified using the R package DESeq2 [24] with inclusion criteria |log FC| > 1 and p < 0.05 in the TCGA-OSCC dataset. Then RASRDEGs were identified by determining the intersection of the DEGs with RASRGs. The locations of the RASRDEGs on the human chromosomes were analyzed using the R package RCircos. We further analyzed the somatic mutations (SM) and copy number variations (CNV) in OSCC samples from the TCGA-OSCC dataset. The SM profiles were visualized using the R package maftools [25] and GISTIC2.0 [26] analysis was performed on the downloaded CNV segments.
2.3 Calculation of renin-angiotensin system score and weighted gene association network analysis (WGCNA)
The renin-angiotensin system score (RASScore) for all samples in the TCGA-OSCC dataset was calculated based on the expression matrix of RASRDEGs using the R package GSVA and the ssGSEA algorithm [27]. Then receiver operating characteristic (ROC) curve analysis was conducted and the area under the curve (AUC) was calculated using the pROC package. To identify module genes associated with RAS, WGCNA was performed through R package WGCNA [28] and genes with the highest 75% variance were screened. The correlation between RASScore and different modules was measured with a minimum genes number of 100, an optimal soft threshold of 7, a scale-free fit index of 0.94, a module integrated shear height of 0.4 and a minimum distance of 0.2. All genes in modules with |r| > 0.30 were intersected with RASRDEGs and the intersecting genes were identified as module genes.
2.4 Expression analysis of module genes in OSCC
Based on their expression levels in OSCC and control samples from the TCGA-OSCC and combined GEO datasets, group comparison plots and ROC curves of module genes [29] were generated. In addition, the consensus clustering method [30] R package ConsensusClusterPlus [31] was used to identify OSCC subtypes. Expression value heatmaps, grouping comparison maps as well as the correlation heatmap and scatter plots were also drawn to further analyze the distribution characteristics of the module genes in different OSCC subtypes.
2.5 Construction of prognostic risk model for OSCC
Initially, univariate Cox regression analysis was conducted on module genes using the R package survival [32], and variables with p < 0.10 were selected for subsequent least absolute shrinkage and selection operator (LASSO) regression analysis. LASSO regression analysis (family = "cox") was then performed on the previous identified genes using the R package glmnet [33] with an iteration number of 10. Next, multivariate Cox regression analyses were utilized to identify key genes in the risk model. Finally, the risk score was calculated using the following formula:

The risk score for OSCC samples from the combined GEO datasets was calculated based on the formula above, and patients were divided into high- and low-risk groups using the median risk score as the dividing point. To further validate the ability of key genes to risk group OSCC samples and their differential expression among different risk groups, we generated group comparison plots and ROC curves [29] based on the expression levels of these genes in OSCC samples from the TCGA-OSCC and combined GEO datasets.
2.6 Prognostic analyses of OSCC risk model
To investigate the relationship between gene expression levels and overall survival, OSCC patients were divided into high- and low-risk groups using the median risk score as the cut-off. Based on risk score and overall survival of OSCC patients, time-dependent ROC curves were plotted and the AUC was calculated to predict 1-, 3-, and 5-year survival in OSCC samples from the TCGA dataset. Kaplan-Meier (KM) analysis [34] and log-rank tests were performed to analyze the differences in survival between the two groups. A nomogram was plotted by R package rms [35] based on the results of multivariate Cox regression analysis to demonstrate the interrelationships between the risk score and the clinical information. Additionally, we plotted 1-, 3-, and 5-year calibration curves to evaluate the prognostic accuracy and discriminatory power of the nomogram.
2.7 Protein-protein interaction and regulatory network analysis
Patients with OSCC in the TCGA cohort were divided into high- and low-risk groups based on the median risk score. DEGs between the two groups were identified using the R package DESeq2 with inclusion criteria |log FC| > 2.5 and p < 0.05. The STRING database (https://string-db.org/) [36] was applied to construct a PPI Network related to RASRDEGs based on DEGs with a minimum required interaction score greater than 0.400. Utilizing Molecular Complex Detection (MCODE) function in Cytoscape software, genes interacted with others in the PPI network were selected as hub genes. The miRNAs associated with hub genes were obtained from the TarBase database (http://www.microrna.gr/tarbase) and the mRNA-miRNA regulatory network was visualized by Cytoscape software. Functional similarity (Friends) analysis was performed using the R package GOSemSim [37] to assess the functional correlation between hub genes. Moreover, we obtained TMB and MSI data from the cBioPortal database (https://www.cbioportal.org/) [38]. Mann-Whitney U test (Wilcoxon Rank Sum Test) was performed to evaluate differences in TMB and MSI scores between high- and low-risk groups of OSCC samples from the TCGA-OSCC dataset.
2.8 Immune infiltration analyses of prognostic risk model
Enrichment scores representing the relative infiltration abundance of each immune cell was calculated respectively using ssGSE algorithm, and then group comparison plots were drawn to compare the infiltration abundance of 28 immune cells between the high-risk group and the low-risk group. Immune cells with statistically significant difference were selected for subsequent analyses. The correlation between immune cells infiltration abundance was calculated by Spearman algorithm and the results was shown in the correlation heatmap. The correlation between hub genes and immune cells infiltration abundance was also calculated by Spearman algorithm and the results was shown in the correlation bubble plot.
2.9 Function enrichment analysis
Gene ontology (GO) [39] and Kyoto Encyclopedia of Genes and Genomes (KEGG) enrichment analyses [40] were conducted to explore the biological functions and pathways associated with prognosis-related DEGs using the R package "clusterProfiler" [41], with an item selection criterion of p < 0.05. Additionally, gene set enrichment analysis (GSEA) [42] was performed on all genes in OSCC samples to identify significantly enriched pathways using the R package clusterProfiler [41].
2.10 Cell culture
OSCC cell lines (HSC4, HSC6, HN6, and SCC15) and normal oral keratinocytes (NOK) were maintained in our laboratory in Guangzhou, China. HSC4, HSC6, and NOK cell lines were provided by J. Silvio Gutkind (NIH, Bethesda, MD, USA). SCC15 was purchased from the ATCC (Rockville, MD, USA), kindly provided by Professor Xiaoan Tao (Hospital of Stomatology, Sun Yat-sen University, China). HN6 cells were obtained from Cell Bank at the Chinese Academy of Sciences (Shanghai, China). All cells were incubated at 37 °C with 5% CO2. NOK was cultured in keratinocyte serum-free medium (Gibco, USA), supplemented with 25 μg/ml bovine pituitary extract (Gibco, USA), 1 ng/ml epidermal growth factor (Gibco, USA), and 1% penicillin/streptomycin (Gibco, USA). HSC4, HSC6, and SCC15 cells were cultured in Dulbecco's Modified Eagle Medium (DMEM; Gibco) supplemented with 10% fetal bovine serum (FBS; Gibco, USA). HN6 cells were cultured in DMEM/F-12 (Gibco, USA) supplemented with 10% FBS.
2.11 Western blot
The cells were washed with ice-cold PBS and lysed using RIPA lysis buffer (Sigma-Aldrich, USA) supplemented with 1% protease and 1% phosphatase inhibitors (Beyotime, China). Next, 5× loading buffer (Beyotime, China) was added to the protein samples, followed by denaturation at 99 °C. The lysates were separated on a 4-20% SDS-PAGE gel and transferred to a 0.22 μm PVDF membrane (Millipore, USA). After blocking with 5% milk, the membranes were incubated overnight at 4 °C with primary antibodies, followed by incubation with species-matched secondary antibodies. The antigen-antibody reaction was visualized using enhanced chemiluminescence (Thermo Fisher, USA). The following antibodies were used: GAPDH (60004-1, 1:3000, Proteintech), AQP1 (ab168387, 1:1 000, Abcam), OLR1 (11837-1, 1:500; Proteintech).
2.12 Quantitative reverse transcription-polymerase chain reaction (qRT-PCR)
Total RNA was isolated from the cells using an RNA-Quick Purification Kit (GOONIE, Guangzhou, China). RNA concentration was measured using NanoDrop One (Thermo Fisher, USA). HiScript Ⅲ RT SuperMix for qPCR kit (Vazyme Biotech, Nanjing, China) was used to reverse-transcribe 1 μg of RNA to acquire cDNA. The expression levels of the six key genes were measured using qRT-PCR. SYBR Green-based qPCR analyses were conducted using a QuantStudio 7 Flex System (Thermo Fisher, USA). GAPDH was used as the endogenous control. Relative expression levels were calculated using the comparative threshold cycle equation (2-ΔΔCT). The primer sequences used were as follows: AQP1, Forward Primer: 5'- ACCGAGCAGGGTTAATCCCA- 3'; Reverse Primer: 5'-TGTACATCATCGCCCAGTGC-3'; OLR1, Forward Primer: 5'-CTTT-GGATGCCAAGTTGCTGAA-3'; Reverse Primer: 5'-GCATCAAAGGAGAAC-CGTCC-3'; SPP1, Forward Primer: 5'-AATACCCAGATGCTGTGGCC-3'; Reverse Primer: 5'-ACGGCTGTCCCAATCAGAAG-3'; GAPDH, Forward Primer: 5'-CTCCTCCTGTTCGACAGTCAGC-3'; Reverse Primer: 5'-CCCAATACGAC-CAAATCCGTT-3'.
2.13 Immunohistochemical (IHC) staining
Twenty patients with OSCC admitted between 2022 and 2024 without prior pre-operative therapy were enrolled and detailed patient information was showed in Table S3. Paraffin-embedded OSCC and para-cancer tissue sections were subjected to immunohistochemical assays with informed consent, following the institutional review board's guidelines. Tissue sections underwent 2h heat treatment at 65 °C, dewaxing with xylene, and alcohol rehydration. Endogenous peroxidase activity was blocked using 3% H2O2. Citrate-mediated high-temperature antigen retrieval was performed, followed by blocking with goat serum and overnight incubation with primary antibodies. After washing with TBST, secondary antibodies were applied at room temperature. An Apreio AT2 digital whole-slide scanner (Leica, Wetzlar, Germany) was used for slide scanning. The antibodies used included AQP1 (ab168387, 1:1 000, Abcam), OLR1 (11837-1, 1:500; Proteintech), SPP1 (25715-1, 1:500; Proteintech). ImageJ software (National Institutes of Health, Bethesda, Maryland, United States) was used to quantify the stained area.
2.14 Statistical analysis
All data processing and analyses were performed using R software (Version 4.3.0). For comparisons between two groups of continuous variables, the significance of differences between normally distributed variables was analyzed using the independent Student's t-test, while non-normally distributed variables were analyzed using the Mann-Whitney U test (Wilcoxon Rank Sum Test). The Kruskal-Wallis test was used to compare three or more groups. Spearman's correlation analysis was used to calculate correlation coefficients between different molecules. All statistical p-values were bilateral, and p < 0.05 was considered statistically significant unless otherwise stated.
3. Results
3.1 Identification of RASRDEGs in OSCC
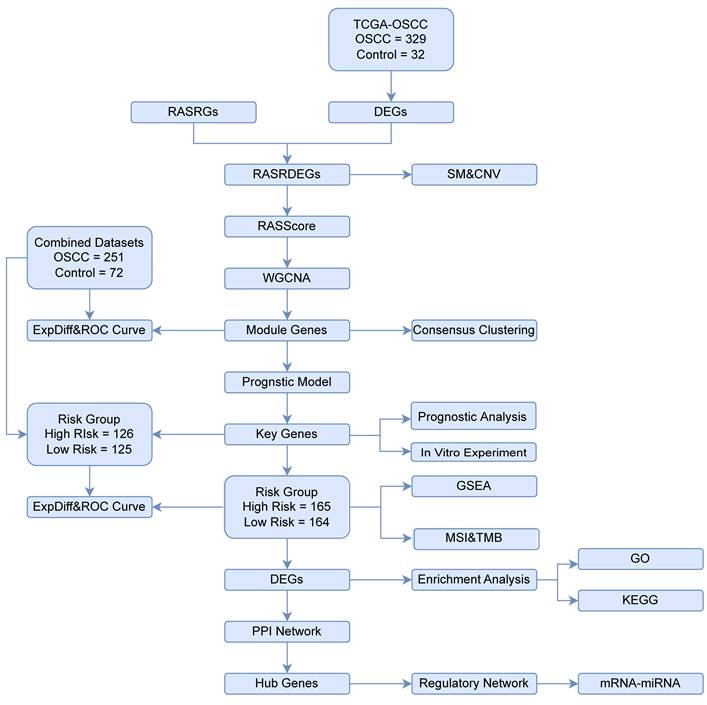
The study design and data processing were displayed in the flowchart (Fig. 1). In the TCGA-OSCC dataset, we conducted an integrated bioinformatics analysis to explore DEGs, identifying 2,980 DEGs, including 1,262 upregulated and 1,718 downregulated genes (Fig. 2A). A total of 43 RASRDEGs were identified by intersecting the DEGs and RASRGs (Fig. 2B, Table S4). The top 10 positively and negatively regulated RASRDEGs based on |log FC| in the TCGA-OSCC dataset are shown in a heatmap (Fig. 2C). We found most RASRDEGs were located on chromosome 1, including UTS2, AGTRAP, BSND, NPR1, SELP, REN, and AGT (Fig. 2D). Additionally, we conducted a mutation analysis of 155 RASRGs in OSCC samples from the TCGA-OSCC dataset. The results revealed six major categories of SM in the RASRGs, with missense mutations being the most common. Single nucleotide polymorphisms (SNPs) were the predominant variant type, and the C-to-T mutation was the most frequent class of single nucleotide variants (SNVs) (Fig. S1A). SM and CNV analysis of the top 10 positively and negatively regulated RASRDEGs in the OSCC samples and found that MYH7 exhibited the highest SM rate of 3% (Fig. S1B-D).
Flowchart illustrating the comprehensive analysis of publicly available data from TCGA and GEO databases.
Identification of RASRDEGs in OSCC. A Volcano plot depicting differentially expressed genes. B Venn diagram showing the intersection of DEGs and RASRGs. C Expression heatmap of the top 10 positively and negatively regulated RASRDEGs based on |log FC|. D Chromosomal mapping of RASRDEGs.

3.2 Determining module genes by gene co-expression analysis
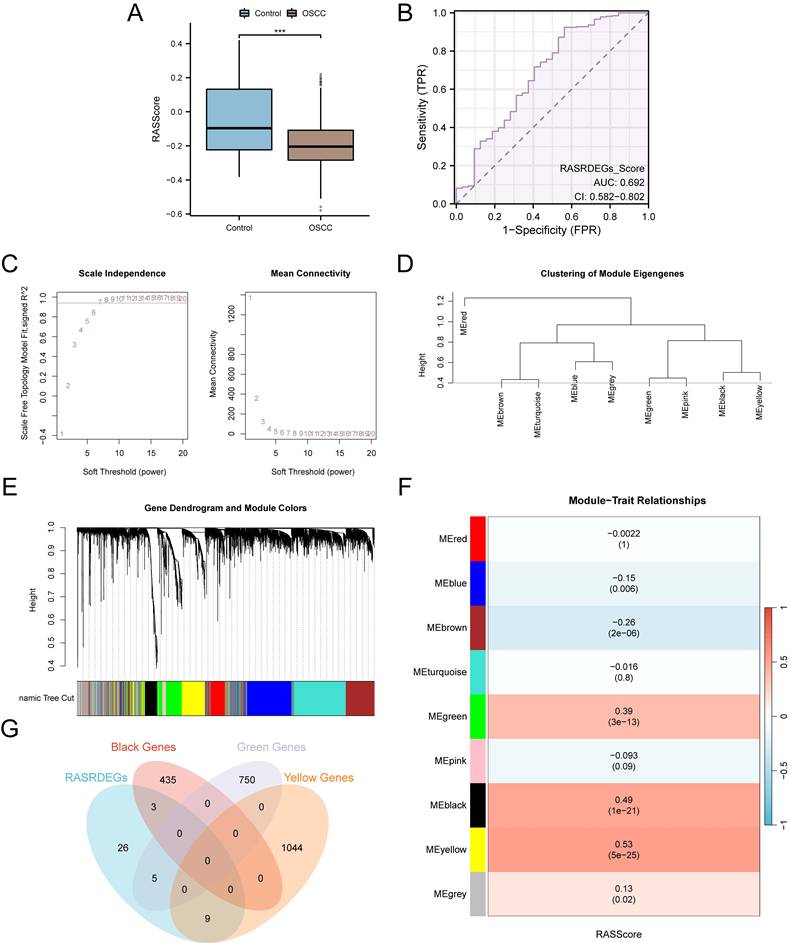
The RASScore for all samples in the TCGA-OSCC dataset was calculated. As shown in the group comparison diagram, RASScore was lower in the OSCC samples than in the Control samples (p < 0.001) (Fig. 3A). The results of ROC curves demonstrated that the RASScore had low accuracy in discriminating between patients with OSCC and healthy volunteers (AUC = 0.692) (Fig. 3B).To identify the co-expressed gene modules in OSCC samples from the TCGA-OSCC dataset, WGCNA was performed on the top 75% of DEGs (Fig. 3C). Genes were clustered and labeled with grouping information using hierarchical clustering trees to visualize the relationships between genes and merged modules (Fig. 3D). Using a screening criterion of 0.4, genes with the top 75% variance were clustered into nine modules: MEred, MEblue, MEbrown, MEturquoise, MEgreen, MEpink, MEblack, MEyellow, and MEgrey (Fig. 3E). Correlation analysis between the gene modules and RASScore found three modules with |r| > 0.30, which were selected for further analysis: MEgreen (|r| = 0.39), MEblack (|r| = 0.49), and MEyellow (|r| = 0.53) (Fig. 3F). Finally, 17 module genes were identified by intersecting the 43 RASRDEGs with genes in these three modules: AGT, MYH7, NR3C2, CCL2, CMA1, CTSG, OLR1, SPP1, APLN, AQP1, MMP1, MMP9, NPR1, PTX3, SELP, SERPINE1, and TGFB1 (Fig. 3G).
WGCNA of OSCC samples in the TCGA-OSCC dataset. A Group comparison diagram of RASScore between OSCC and control samples in the TCGA-OSCC dataset. B ROC curve for RASScore in the TCGA-OSCC dataset. C Scale-free net-work display of the best soft threshold from WGCNA. (The left panel shows the best soft threshold, and the right panel shows the network connectivity under different soft threshold conditions.) D-E Module clustering results of genes with the top 75% variance. (The upper part shows a hierarchical clustering dendrogram, and the lower part shows the gene modules.) F Results of correlation analysis between clustered modules and RASScore. G Venn diagram of the 43 RASRDEGs and modules MEgreen, MEblack, and MEyellow. ***p < 0.001.
3.3 Expression characteristics of module genes in OSCC
Group comparison plots showed that almost all module genes expressed differently between OSCC and control samples (p < 0.01), except for AGT, which showed no statistically significant difference in expression (p ≥ 0.05) between the two groups in the combined GEO dataset (Fig. S2A, S3A). The diagnostic efficacy of the module genes in OSCC was further assessed using both the TCGA-OSCC and combined GEO datasets. In the TCGA-OSCC dataset, four module genes (MMP1, MMP9, SERPINE1, and TGFB1) exhibited high diagnostic accuracy (AUC > 0.9), 10 module genes (AGT, MYH7, NR3C2, CCL2, CMA1, OLR1, SPP1, APLN, AQP1, and SELP) exhibited moderate accuracy (0.7 < AUC < 0.9), and three module genes (CTSG, NPR1, and PTX3) exhibited low accuracy (0.5 < AUC < 0.7) in diagnosing OSCC (Fig. S2B-J). In the combined GEO dataset, five module genes (NR3C2, SPP1, MMP1, SERPINE1, and TGFB1) displayed high diagnostic accuracy (AUC > 0.9), eight module genes (CCL2, CTSG, OLR1, APLN, AQP1, MMP9, PTX3, and SELP) displayed moderate accuracy (0.7 < AUC < 0.9), and four module genes (AGT, MYH7, CMA1, and NPR1) displayed low accuracy (0.5 < AUC < 0.7) in diagnosing OSCC (Fig. S3B-J). Based on the expression levels of module genes, we group the 329 patients with OSCC in the TCGA-OSCC dataset into two subgroups using the ConsensusClusterPlus package. Subgroup A (cluster 1) consisted of 149 patients, while subgroup B (cluster 2) included 180 patients (Fig. S4A-C). Significant differences between these two subgroups were observed, as shown in the Figure S4D-F. The correlation heatmap revealed that most of the module genes were significantly positively correlated with each other (r > 0, p < 0.05) (Fig. S4G), and the top two positively correlated genes are shown in the correlation scatter plot (Fig. S4H-I). The expression patterns of the 17 module genes varied greatly between the two OSCC subtypes. It suggested that RASRDEGs might play a role in defining different clinical subtypes of OSCC, which could be valuable for clinical diagnosis and treatment.
3.4 Modeling a RASRGs-related prognostic risk model for OSCC
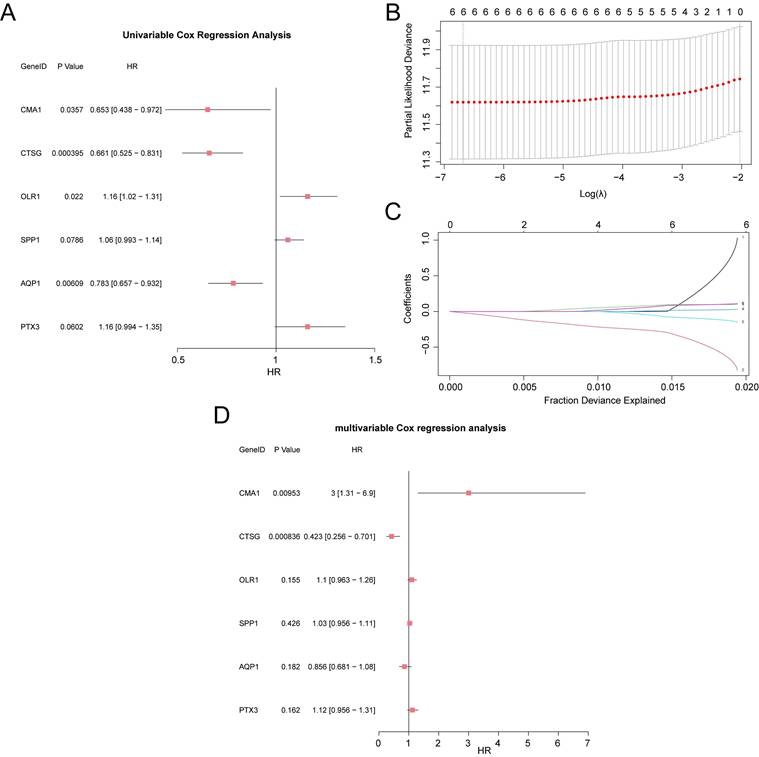
We combined the module gene expression data with the clinical information of OSCC samples from the TCGA-OSCC dataset and performed a univariate Cox regression analysis. Module genes with p < 0.10 were selected for further analysis (Fig. 4A). A LASSO regression analysis was then conducted to build a LASSO regression model (Fig. 4B-D). Based on the optimal number of genes corresponding to the lowest lambda value in the LASSO Cox regression analysis, the model ultimately included six key genes: CMA1, CTSG, OLR1, SPP1, AQP1, and PTX3. Subsequently, a prognostic risk model was developed, and the risk score was calculated based on the expression levels of these six key genes, weighted by their respective LASSO regression coefficients. The calculation formula is as follows:
Construction of the RASRGs-related prognostic risk model. A Forest plot showing the six key genes in the univariate Cox regression model. B-C Plots of the prognostic risk model and variable trajectories from the LASSO regression analysis. D Forest plot showing the six key genes in the multivariate Cox regression model.

3.5 Expression characteristics of key genes in different risk groups
Different expression of the six key genes in both the TCGA-OSCC and combined GEO datasets are presented in group comparison plots (Fig. S5A-B). The expression levels of AQP1, CMA1, and CTSG were lower, whereas those of OLR1, PTX3, and SPP1 were higher in the high-risk group compared to the low-risk group (p < 0.05). However, no statistically significant difference was observed in the expression of CMA1 between the high- and low-risk groups in the combined GEO dataset (p ≥ 0.05). Furthermore, ROC analysis was performed to evaluate the discriminative ability of the six key genes in the OSCC risk groups. In the TCGA-OSCC dataset, CTSG demonstrated high accuracy (AUC > 0.9) in risk grouping of OSCC samples, whereas CMA1 and AQP1 demonstrated moderate accuracy (0.7 < AUC < 0.9), and OLR1, SPP1, and PTX3 showed low accuracy (0.5 < AUC < 0.7) (Fig. S5C-E). In the combined GEO dataset, CTSG and AQP1 showed moderate accuracy (0.7 < AUC < 0.9) in risk grouping of OSCC samples, whereas CMA1, OLR1, SPP1, and PTX3 demonstrated low accuracy (0.5 < AUC < 0.7) (Fig. S5F-H).
3.6 Prognostic performance analysis of RASRGs-related risk model
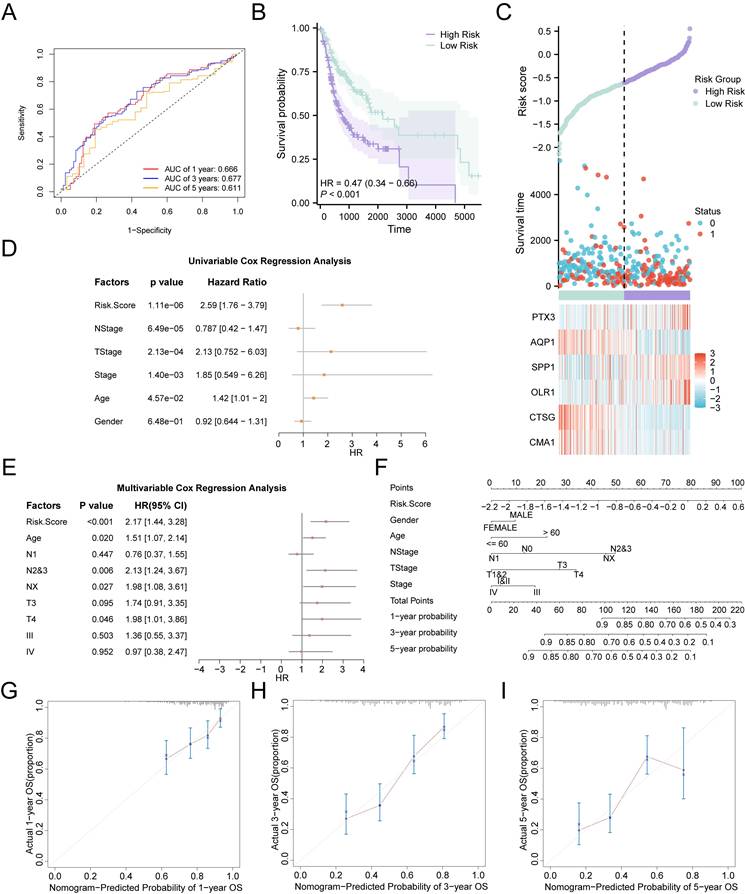
The AUCs of time-dependent ROC curves for the 1-, 3-, and 5-year survival probabilities were all greater than 0.6 (0.666, 0.677, and 0.611, respectively), indicating that the risk model demonstrated promising prognostic predictive ability in the validation cohort (Fig. 5A). The risk score for each patient was calculated using the prognostic model, and patients with OSCC were divided into high- and low-risk groups, with the median risk score serving as the cut-off point. Patients in the high-risk group had lower survival rates than those in the low-risk group, as shown by the Kaplan-Meier curves (p < 0.001) (Fig. 5B). Distribution of risk scores and survival data in the two risk groups was illustrated using a risk factor plot (Fig. 5C). Notably, univariate Cox regression analysis revealed that the risk score was significantly associated with poorer OS (overall survival) in OSCC (HR = 2.59, 95% CI: 1.76-3.79, p < 0.01) (Fig. 5D). Further multivariate Cox regression analysis identified the risk score, age, N stage, and T stage as independent prognostic indicators for patients with OSCC (p < 0.05) (Fig. 5E, Table S5). To further investigate the prognostic predictive value of the multi-gene risk model for OSCC, a nomogram was constructed based on the Cox regression analysis (Fig. 5F). The results demonstrated that the utility of the risk score was substantially higher than that of the other variables, while sex had the lowest utility. Additionally, calibration analysis showed a high degree of agreement between the nomogram predictions and actual observations for the 3-year OS predictive probabilities (Fig. 5G-I). In conclusion, the RASRG-related prognostic risk model is both reliable and valid for predicting the prognosis of patients with OSCC.
Prognostic analysis of the RASRGs-related risk model. A Time-dependent ROC curve for OSCC samples in the TCGA-OSCC dataset. B Prognostic Kaplan-Meier (KM) curves for high-risk and low-risk OSCC groups. C Risk factor plot of the prognostic risk model for OSCC. D-E Forest plots of risk score and clinical information in univariate and multivariate Cox regression models. F A nomogram integrating risk scores and clinical parameters for precision prediction. G-I Calibration curves of the prognostic risk model for 1-, 3-, and 5-year overall survival (OS).
3.7 Verification of expression levels of prognostic signature genes in OSCC tissues and cell lines
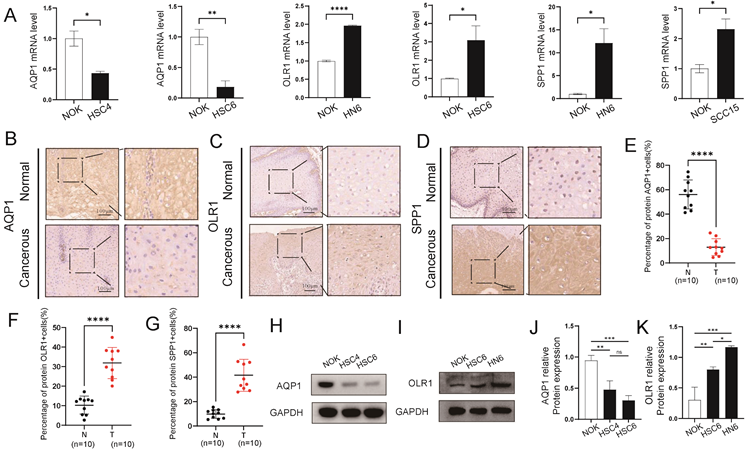
To confirm the reliability and accuracy of the results obtained from the bioinformatics analysis, we validated the mRNA and protein levels of key genes in OSCC samples. We selected three key genes (AQP1, OLR1, and SPP1) with higher discriminative ability (AUC > 0.7) for OSCC in both the TCGA-OSCC and combined GEO datasets as validation genes. Our results revealed that AQP1 exhibited low expression in OSCC cell lines, whereas the expression levels of OLR1 and SPP1 were higher in OSCC cell lines compared to normal cells (Fig. 6A, H-K). Additionally, the expression levels of AQP1, OLR1, and SPP1 in cancerous and para-cancerous tissues were significantly different. The IHC results showed that the expression trends of these genes in tissues were consistent with those observed in the cell lines (Fig. 6B-G). Overall, these results are consistent with the bioinformatics analysis.
Validation of the expression patterns of key genes in OSCC tissues and cell lines. A Comparative qPCR analysis illustrating the expression disparities of key risk genes, including AQP1, OLR1, and SPP1, between normal oral epithelial cells (NOK) and OSCC cell lines. B-G Immunohistochemical staining of AQP1 (B, E), OLR1 (C, F), and SPP1 (D, G) in OSCC cancerous tissues and adjacent normal tissues. H-K Western blot analysis of AQP1 (H, J) and OLR1 (I, K) levels in NOK and OSCC cell lines. * p < 0.05, ** p < 0.01, *** p < 0.001, **** p < 0.0001.
3.8 Construction of PPI network and regulatory network
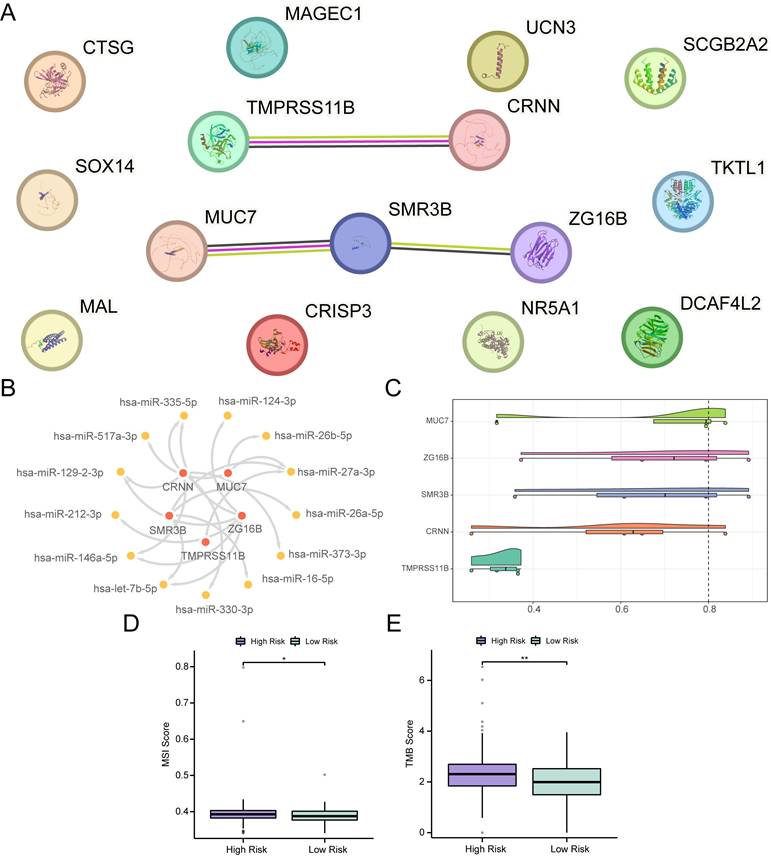
Differential expression analysis was conducted between the high- and low-risk groups of OSCC samples in the TCGA-OSCC dataset, resulting in the identification of 15 DEGs, including CTSG, NR5A1, MUC7, CRISP3, ZG16B, CRNN, TKTL1, MAL, TMPRSS11B, SCGB2A2, DCAF4L2, SOX14, MAGEC1, UCN3, and SMR3B. Among these, six genes were upregulated and nine were downregulated (Fig. S7A-B). A PPI network was constructed for these 15 DEGs, and five hub genes were identified in the PPI network, including TMPRSS11B, CRNN, MUC7, SMR3B, and ZG16B (Fig. 7A). Subsequently, 13 miRNAs associated with the five hub genes were obtained from the TarBase database to construct an mRNA-miRNA regulatory network (Fig. 7B, Table S6). Additionally, friend analysis of the hub genes revealed that MUC7 had the strongest correlation with the other hub genes (Fig. 7C). MUC7 was the gene closest to the cut-off value (cut-off value = 0.80), suggesting that it may play a central role in the biological processes of OSCC.Furthermore, mutation analysis showed that the low-risk group exhibited lower MSI and TMB scores than the high-risk group (Fig. 7D-E) (p < 0.05), indicating a potential link between the prognostic features of RASRGs and tumor somatic mutation trends.
PPI and regulatory network, MSI, and TMB analyses. A PPI network of 15 DEGs. B mRNA-miRNA regulatory network of hub genes. C Cloud and rain diagram of friend analysis. D-E Group comparison plots of MSI scores (D) and TMB scores (E) between different OSCC risk groups. * p < 0.05, ** p < 0.01.
3.9 Immune infiltration analysis and Potential molecular characteristics of prognostic risk model
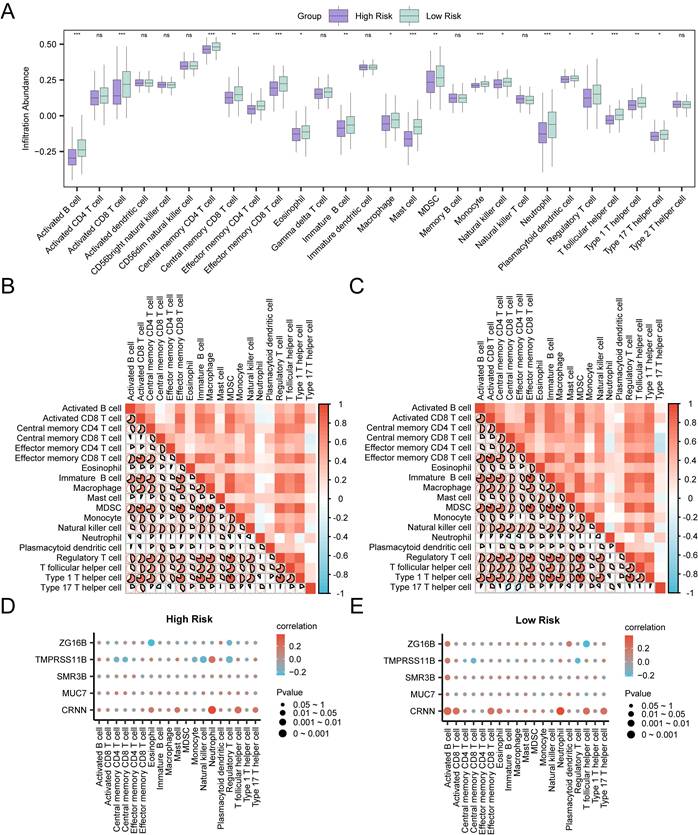
Infiltration abundance of immune cells in the high-risk group and the low-risk group was calculated through ssGSEA algorithm. As shown in the group comparison group (Fig. 8A), the infiltration abundance of nineteen immune cells in the low-risk group was statistically higher than those in the high-risk group (p < 0.05), including activated B cell, activated CD8 T cell, central memory CD4 T cell, effector memory CD4 T cell, effector memory CD8 T cell, mast cell, monocyte, neutrophil, T follicular helper cell, central memory CD8 T cell, immature B cell, MDSC, type 1 T helper cell, eosinophil, macrophage, natural killer cell, plasmacytoid dendritic cell, regulatory T cell and type 17 T helper cell. The degree of immune infiltration of nine other immune cells was not statistically significant between the two groups. In both high-risk group and low-risk group, most of the immune cells showed relatively strong positive correlation (Fig. 8B-C). In addition, the correlations between hub genes and the infiltration abundance of immune cells were also assessed. In the high-risk group, CRNN showed the strongest positive correlation with neutrophil (r = 0.383, p < 0.05), and ZG16B showed the strongest negative correlation with eosinophil (r = -0.25, p < 0.05) (Fig. 8D). In the low-risk group, CRNN showed the strongest positive correlation with neutrophil (r = 0.387, p < 0.05), and ZG16B showed the strongest negative correlation with T follicular helper cell (r = -0.215, p < 0.05) (Fig. 8E). This evidence suggested a possible association of the prognostic characteristics of RASRGs and immune regulation, in which hub genes may play a regulatory role.
Immune Infiltration analyses of Risk Groups. A Group comparison plots of immune cells in the high-risk group and the low-risk group of OSCC samples. B-C Correlation heatmaps of immune cells infiltration abundance in the high-risk group (B) and the low-risk group (C) of OSCC samples. D-E Bubble plots of correlation between immune cell infiltration abundance and Hub Genes in the high-risk (D) and low-risk (E) groups of OSCC.
3.10 Potential molecular characteristics of prognostic risk model
A total of 15 DEGs were included in the GO and KEGG enrichment analyses. The results indicated that these DEGs were primarily involved in the biological processes (BP) of hormone-mediated signaling pathway. They were also enriched in molecular functions (MF) of serine-type endopeptidase activity, serine-type peptidase activity, serine hydrolase activity, caspase binding, and peptidase regulator activity. In terms of KEGG pathways, the DEGs were enriched in the RAS, neuroactive ligand-receptor interaction, pentose phosphate pathway, cortisol synthesis and secretion, and biosynthesis of amino acids (Fig. S7C-G). More detailed results of the GO and KEGG enrichment analyses were shown in Table S7. The RAS pathway enrichment analysis was visualized using the R package Pathview (Fig. S8).Additionally, GSEA was performed to investigate potential pathway associated with RAS in OSCC, and the specific results were shown in Table S8 (Fig. S9A). As the results indicated, all genes in OSCC samples were significantly enriched in several key signaling pathways, including the PI3K-Akt signaling pathway (Fig. S9B), JAK-STAT signaling pathway (Fig. S9C), FceRI-mediated NF-κB activation (Fig. S9D), IL-2 pathway (Fig. S9E), and FceRI-mediated MAPK activation (Fig. S9F). These enriched BP, MF and other biological pathways may serve as potential therapeutic targets for OSCC treatment.
4. Discussion
OSCC remains an intractable disease with a low 5-year survival rate, primarily because most patients are diagnosed at an advanced stage, which is strongly associated with poor prognosis. Distinguishing patients with different biological characteristics will facilitate early diagnosis and intervention, as well as allow for stratified prognosis assessment, which can significantly improve patient survival. While RAS has recently been linked to OSCC, the functional landscape and mechanistic underpinnings of RASRGs in this malignancy await systematic investigation. In the present study, we applied a bioinformatics approach to elucidate the prognostic value of RASRGs in OSCC and constructed a RASRG-related risk model comprising six key genes (CMA1, CTSG, OLR1, SPP1, AQP1, and PTX3). This model was rigorously validated using data from 329 patients in the TCGA-OSCC dataset.
The key genes CMA1, CTSG, OLR1, SPP1, and PTX3 have been identified as potential prognostic markers for OSCC in previous studies. CMA1 encodes a serine protease that activates angiotensin II, a key component of the RAS [43]. CMA1 is expressed at low levels in OSCC cells and tissues, which may influence OSCC progression by regulating Ang II synthesis through ACE/Ang II/AT1R axis or ACE/Ang II/AT2R axis [44,45]. Its abnormal expression has been reported in prostate cancer [46]. CTSG inhibits HNSCC proliferation and metastasis in vivo and in vitro, which has the potential to be an oncogenic factor for HNSCC by focusing on the JAK2/STAT3 signaling pathway [47]. CTSG is considered a potential immune-related biomarker in OSCC, involved in host immune defense, tumor angiogenesis, and metastasis [48-50], and has been targeted for immunotherapy in acute myeloid leukemia (AML) [51]. Low expression levels of CMA1 and CTSG are associated with poor OS [44,48-50]. In contrast, the expression of OLR1 and SPP1 is significantly elevated in OSCC cell lines and tissues, promoting OSCC development and correlating with poor prognosis [52-56]. OLR1 may affect EMT, invasion, stemness, and proliferative activity of HNSCC [52-54]. What's more, OLR1 expression positively correlates with immune-suppressive cell infiltration and immune checkpoint molecules, while negatively correlating with effector T cells, suggesting its correlation with immune-suppressive microenvironment [57]. SPP1, also known as OPN, functions as a crucial adhesion protein and plays a major role in numerous tumors. SPP1 facilitates proliferation, metastasis, angiogenesis, and disease progression [55,56]. A recent study found that SPP1+ macrophages increase the secretion of TNF-α and IL-1β via the NF-kappa B pathway to promote HNSCC cell proliferation, and TNF-α and IL-1β in turn upregulate the expression of OPN in tumor cells and macrophages [58]. PTX3 is involved in cancer-associated inflammation, upregulated in the surgical margins of advanced OSCC, and correlates with cancer recurrence and progression [59]. In addition, PTX3 can affect cell proliferation, cycle and apoptosis, and may also affect the expression of HLA system-related proteins in esophageal squamous cell carcinoma (ESCC) [60]. Recently, AQP1 has been reported as a distinctive prognostic factor in various cancers, including breast, cervical, colorectal, hepatocellular, lung, renal, and squamous cell carcinomas [61,62]. AQP1 has traditionally been recognized as a water channel protein, and many studies have shown its association with carcinogenesis, metastasis, poor prognosis, lymph node metastasis, and cellular migration [61-63]. However, the role of AQP1 in HNSCC remains controversial. On one hand, AQP1 has been suggested to act as a tumor suppressor inhibiting the growth of HNSCC [64,65]. On the other hand, AQP1 is highly expressed in aggressive basaloid-like oro-hypopharynx squamous cell carcinomas with poor prognosis [66]. The downregulation of AQP1 in OSCC may suppress tumor cell motility, yet its specific biological functions in this malignancy require further investigation. In this study, for the first time, we found that AQP1 is downregulated in OSCC tissues and cell lines, and we demonstrate that AQP1 may serve as a potential prognostic biomarker for OSCC. The roles of the five key genes in OSCC were consistent with previous reports, with CMA1 and CTSG acting as protective genes and OLR1, PTX3, and SPP1 acting as risk-promoting genes. Additionally, AQP1 appears to function as a protective gene against OSCC. Although several key genes have been previously implicated as prognostic markers or functionally relevance in OSCC or other cancers, our study is the first to link these genes to RAS abnormalities and suggests that they may have important role in shaping the immunosuppressive microenvironment, highlighting their combined potential as therapeutic target.
Our study identified several clinically actionable applications of the RAS-related gene signature. First, the risk model has strong potential for prognostic stratification that could complement existing TNM staging by capturing biological aggressiveness beyond the anatomical range. With more accurate risk stratification, high-risk patients could be treated more aggressively, whereas low-risk patients might be spared overtreatment. Second, clinical applications could also extend to early detection strategies, with noninvasive testing of RAS-related biomarkers in saliva or other body fluid as liquid biopsy to screen high-risk populations. What's more, our findings support exploring repurposed RAS-modulating drugs, such as ACE inhibitors and angiotensin receptor blockers (ARBs). These drugs had shown promise in preclinical cancer models, and their role in OSCC required experimental exploration [67-69]. Our immune infiltration analysis showed that high-risk tumors have immunosuppressive features, suggesting a possible synergy between RAS modulation and immunotherapy-a hypothesis worthy of clinical investigation. To facilitate clinical implementation, we outline three key translational steps: prospective validation in multicenter cohorts, functional studies to elucidate mechanisms and testing the potential value of RAS-modulating drugs in OSCC.
Although no direct comparisons of current standard prognostic tools (e.g., TNM staging) were performed in this paper, we analyzed baseline TNM staging in the TCGA dataset to assess its role in prognostic modeling. In our study, a multivariate Cox regression analysis showed that the risk score as well as age, N-staging and T-staging were significant (p < 0.05) in prognosis and the utility of the risk score was substantially higher than that of the other variable. It tentatively suggested that our risk score can be combined with traditional TNM staging to provide a more comprehensive assessment of patient prognosis.
Our study indicated that the hub gene MUC7 might play a critical role in OSCC, as suggested by PPI network analysis. It was found that MUC7 expression was down-regulated in the high-risk group, suggesting that low expression of MUC7 may be detrimental to the survival of patients with OSCC. The present finding is concordant with the results of previous study proposing that high expression of MUC7 is associated with better survival in patients with HNSCC [70]. It is noteworthy that most immune cells including neutrophil, eosinophil, activated B cell, activated CD8 T cell and natural killer cell showed lower infiltration abundance in the in the high-risk group, suggesting extensive RAS-related immunosuppressive microenvironment might exist in the high-risk group. Further functional enrichment analysis revealed that a larger number of DEGs were enriched in the BP of the hormone-mediated signaling pathway and the renin-angiotensin system, reiterating the connection between RAS and OSCC prognosis. Additionally, several key pathways were identified in GSEA, including the PI3K-Akt signaling pathway, JAK-STAT signaling pathway, FceRI-mediated NF-κB activation, IL-2 pathway, and FceRI-mediated MAPK activation. Previous studies have shown that the PI3K-Akt-mTOR, JAK-STAT3, and MAPK pathways are downstream of AT1R, which promotes cell proliferation and cancer progression [6,71-73]. NF-κB synergizes with Ang II in cancer development by regulating metastasis and angiogenesis [74-76]. In our study, all of these signaling pathways were downregulated in the high-risk group compared to the low-risk group. These findings can be interpreted in several ways. First, OSCC samples from the high-risk group may represent more advanced tumor stages, where cells may reduce the activity of pathways that promote cell proliferation and survival in order to adapt to unfavorable microenvironmental conditions. Second, negative NES values may be associated with poor prognosis in OSCC patients. Tumor cells may downregulate these signaling pathways to avoid recognition and attack by the immune system. The IL-2 pathway, which was the first immunotherapy approved for cancer treatment nearly 30 years ago by the U.S. Food and Drug Administration (FDA) [77], plays a crucial role in counteracting the dysregulated immune system by targeting regulatory T cells and enhancing antitumor responses through effector, memory, and natural killer cells [78,79]. In our study, IL-2 was downregulated in the high-risk group, indicating that low expression of IL-2 may contribute to a worse prognosis. These enrichment pathways may be significant molecular mechanism for OSCC to form an immunosuppressive microenvironment and escape from immune supervision.
Our study identified RAS-related biomarkers and established a prognostic risk model for OSCC, however, there are still several limitations. First, the retrospective nature of the study and the modest sample size might limit the generalizability of the risk model. Second, clinical heterogeneity (e.g., variations in tumor stage, treatment history, and comorbidities) was not fully adjusted in the multivariate analysis. Larger prospective cohorts are needed to validate the model's robustness. Third, although we validated key RAS genes at the mRNA and protein level, functional experiments (e.g., gene knockdown/overexpression) were not performed to establish their causal roles in OSCC progression. Additionally, the results of miRNA-mRNA and PPI networks still need experimental validation of the expression patterns and binding specificity. Ultimately, the risk model's utility in guiding personalized therapy (e.g., RAS-targeted drugs) also needed lots of prospective trials to assess its predictive value for treatment response.
5. Conclusion
In conclusion, to the best of our knowledge, our study is the first to identify the significant impact of renin-angiotensin-related genes on the clinical prognosis of OSCC. We constructed a six-gene (CMA1, CTSG, OLR1, SPP1, PTX3, and AQP1) prognostic risk model and verify its accuracy and universality in predicting the prognosis of OSCC. Our findings may facilitate personalized treatment strategies for patients with OSCC at different risks.
Abbreviations
ACE: angiotensin converting enzyme; AUC: area under the ROC curve; BP: biological process; CDF: cumulative distribution function; CNV: copy number variation; DEGs: differentially expressed genes; DMEM: Dulbecco's modified eagle medium; DOI: digital object identifier; FBS: fetal bovine serum; FPKM: fragments per kilobase per million; GEO: gene expression omnibus; GO: gene ontology; GSEA: gene set enrichment analysis; HNSCC: head and neck squamous cell carcinoma; KEGG: Kyoto Encyclopedia of Genes and Genomes; LASSO: least absolute shrinkage and selection operator; MCODE: molecular complex detection; MF: molecular functions; MSI: microsatellite instability; NOK: Normal oral keratinocytes; OS: overall survival; OSCC: oral squamous cell carcinoma; PPI: protein interaction; qRT-PCR: quantitative reverse transcription-polymerase chain reaction; RAS: renin-angiotensin system; RASRG: RAS-related gene; RASRDEG: renin-angiotensin system-related differentially expressed gene; ROC: receiver operating characteristic; SM: somatic mutations; SNP: single nucleotide polymorphism; SNV: single nucleotide variant; TCGA: the cancer genome atlas; TMB: tumor mutation burden; WGCNA: weighted gene co-expression network analysis.
Supplementary Material
Supplementary figures and tables.
Acknowledgements
We sincerely thank professor Xiaoan Tao (Hospital of Stomatology, Sun Yat-sen University, China) for his gift of the cell lines.
Funding
This work was supported by grants from the Major Research Plan of Science and Technology Program of Guangzhou, China (Grant No. 202206080009) and the National Natural Science Foundation of China (Grant No. 81800969).
Author contributions
All authors made an essential contribution to the reported work. J.W. and B.C. designed the whole study and critically review the article. Z.W., J.H. and C.W. finished in vitro experiments, drafted and revised the manuscript. Z.W. and J.H. completed the bioinformatics. C.W., X.C. and J.W. participated in the statistical analysis of in vitro experiments and wrote the figure legends. All authors have read and agreed to the published version of the manuscript.
Data availability statement
The original contributions presented in this study are included in the article/supplementary material. Further inquiries can be directed to the corresponding authors.
Institutional review board statement
The acquisition of the experimental materials was approved by the Committee on Human Research of the School and Hospital of Stomatology at Sun Yat-Sen University (GHKQ-202501-K07-01).
Competing Interests
The authors have declared that no competing interest exists.
References
1. Siegel RL, Miller KD, Jemal A. Cancer statistics, 2018. CA Cancer J Clin. 2018;68(1):7-30
2. Rivera C. Essentials of oral cancer. Int J Clin Exp Pathol. 2015;8(9):11884-94
3. Sung H, Ferlay J, Siegel RL. et al. Global Cancer Statistics 2020: GLOBOCAN Estimates of Incidence and Mortality Worldwide for 36 Cancers in 185 Countries. CA Cancer J Clin. 2021;71(3):209-249
4. Kumar R, Thomas CM, Yong QC, Chen W, Baker KM. The intracrine renin-angiotensin system. Clin Sci (Lond). 2012;123(5):273-84
5. Arendse LB, Danser AHJ, Poglitsch M. et al. Novel Therapeutic Approaches Targeting the Renin-Angiotensin System and Associated Peptides in Hypertension and Heart Failure. Pharmacol Rev. 2019;71(4):539-570
6. Hassani B, Attar Z, Firouzabadi N. The renin-angiotensin-aldosterone system (RAAS) signaling pathways and cancer: foes versus allies. Cancer Cell Int. 2023;23(1):254
7. Almutlaq M, Alamro AA, Alamri HS, Alghamdi AA, Barhoumi T. The Effect of Local Renin Angiotensin System in the Common Types of Cancer. Front Endocrinol (Lausanne). 2021;12:736361
8. Nallaiah S, Lee VMY, Brasch HD. et al. Cancer stem cells within moderately differentiated head and neck cutaneous squamous cell carcinoma express components of the renin-angiotensin system. J Plast Reconstr Aesthet Surg. 2019;72(9):1484-1493
9. Ram RS, Brasch HD, Dunne JC. et al. Cancer Stem Cells in Moderately Differentiated Lip Squamous Cell Carcinoma Express Components of the Renin-Angiotensin System. Front Surg. 2017;4:30
10. Vairaktaris E, Serefoglou Z, Avgoustidis D. et al. Gene polymorphisms related to angiogenesis, inflammation and thrombosis that influence risk for oral cancer. Oral Oncol. 2009;45(3):247-53
11. Colaprico A, Silva TC, Olsen C. et al. TCGAbiolinks: an R/Bioconductor package for integrative analysis of TCGA data. Nucleic Acids Res. 2016;44(8):e71
12. Goldman MJ, Craft B, Hastie M. et al. Visualizing and interpreting cancer genomics data via the Xena platform. Nat Biotechnol. 2020;38(6):675-678
13. Davis S, Meltzer PS. GEOquery: a bridge between the Gene Expression Omnibus (GEO) and BioConductor. Bioinformatics. 2007;23(14):1846-7
14. Barrett T, Wilhite SE, Ledoux P. et al. NCBI GEO: archive for functional genomics data sets-update. Nucleic Acids Res. 2013;41(Database issue):D991-5
15. Chen C, Mendez E, Houck J. et al. Gene expression profiling identifies genes predictive of oral squamous cell carcinoma. Cancer Epidemiol Biomarkers Prev. 2008;17(8):2152-62
16. Ambatipudi S, Gerstung M, Pandey M. et al. Genome-wide expression and copy number analysis identifies driver genes in gingivobuccal cancers. Genes Chromosomes Cancer. 2012;51(2):161-73
17. Bhosale PG, Cristea S, Ambatipudi S. et al. Chromosomal Alterations and Gene Expression Changes Associated with the Progression of Leukoplakia to Advanced Gingivobuccal Cancer. Transl Oncol. 2017;10(3):396-409
18. Inchanalkar M, Srivatsa S, Ambatipudi S. et al. Genome-wide DNA methylation profiling of HPV-negative leukoplakia and gingivobuccal complex cancers. Clin Epigenetics. 2023;15(1):93
19. Peng C, Liao C, Peng S. et al. A novel molecular signature identified by systems genetics approach predicts prognosis in oral squamous cell carcinoma. PLoS One. 2011;6(8):e23452
20. Leek JT, Johnson WE, Parker HS, Jaffe AE, Storey JD. The sva package for removing batch effects and other unwanted variation in high-throughput experiments. Bioinformatics. 2012;28(6):882-3
21. Ritchie ME, Phipson B, Wu D. et al. limma powers differential expression analyses for RNA-sequencing and microarray studies. Nucleic Acids Res. 2015;43(7):e47
22. Ben Salem K, Ben Abdelaziz A. Principal Component Analysis (PCA). Tunis Med. 2021;99(4):383-389
23. Stelzer G, Plaschkes I, Oz-Levi D. et al. VarElect: the phenotype-based variation prioritizer of the GeneCards Suite. BMC Genomics. 2016 17 Suppl 2(Suppl 2):444
24. Love MI, Huber W, Anders S. Moderated estimation of fold change and dispersion for RNA-seq data with DESeq2. Genome Biol. 2014;15(12):550
25. Mayakonda A, Lin D, Assenov Y, Plass C, Koeffler HP. Maftools: efficient and comprehensive analysis of somatic variants in cancer. Genome Res. 2018;28(11):1747-1756
26. Li J, Miao B, Wang S. et al. Hiplot: a comprehensive and easy-to-use web service for boosting publication-ready biomedical data visualization. Brief Bioinform. 2022;23(4):bbac261
27. Xiao B, Liu L, Li A. et al. Identification and Verification of Immune-Related Gene Prognostic Signature Based on ssGSEA for Osteosarcoma. Front Oncol. 2020;10:607622
28. Langfelder P, Horvath S. WGCNA: an R package for weighted correlation network analysis. BMC Bioinformatics. 2008;9:559
29. Park SH, Goo JM, Jo C. Receiver operating characteristic (ROC) curve: practical review for radiologists. Korean J Radiol. 2004;5(1):11-8
30. Lock EF, Dunson DB. Bayesian consensus clustering. Bioinformatics. 2013;29(20):2610-6
31. Wilkerson MD, Hayes DN. ConsensusClusterPlus: a class discovery tool with confidence assessments and item tracking. Bioinformatics. 2010;26(12):1572-3
32. Therneau T. A Package for Survival Analysis in R. R package version. 2024
33. Engebretsen S, Bohlin J. Statistical predictions with glmnet. Clin Epigenetics. 2019;11(1):123
34. Rich JT, Neely JG, Paniello RC. et al. A practical guide to understanding Kaplan-Meier curves. Otolaryngol Head Neck Surg. 2010;143(3):331-6
35. Wu J, Zhang H, Li L. et al. A nomogram for predicting overall survival in patients with low-grade endometrial stromal sarcoma: A population-based analysis. Cancer Commun (Lond). 2020;40(7):301-312
36. Szklarczyk D, Gable AL, Lyon D. et al. STRING v11: protein-protein association networks with increased coverage, supporting functional discovery in genome-wide experimental datasets. Nucleic Acids Res. 2019;47(D1):D607-D613
37. Yu G, Li F, Qin Y. et al. GOSemSim: an R package for measuring semantic similarity among GO terms and gene products. Bioinformatics. 2010;26(7):976-8
38. Gao J, Aksoy BA, Dogrusoz U. et al. Integrative analysis of complex cancer genomics and clinical profiles using the cBioPortal. Sci Signal. 2013;6(269):pl1
39. Mi H, Muruganujan A, Ebert D, Huang X, Thomas PD. PANTHER version 14: more genomes, a new PANTHER GO-slim and improvements in enrichment analysis tools. Nucleic Acids Res. 2019;47(D1):D419-D426
40. Kanehisa M, Goto S. KEGG: kyoto encyclopedia of genes and genomes. Nucleic Acids Res. 2000;28(1):27-30
41. Yu G, Wang L, Han Y, He Q. clusterProfiler: an R package for comparing biological themes among gene clusters. OMICS. 2012;16(5):284-7
42. Subramanian A, Tamayo P, Mootha VK. et al. Gene set enrichment analysis: a knowledge-based approach for interpreting genome-wide expression profiles. Proc Natl Acad Sci U S A. 2005;102(43):15545-50
43. Ferrario CM, Groban L, Wang H. et al. The Angiotensin-(1-12)/Chymase axis as an alternate component of the tissue renin angiotensin system. Mol Cell Endocrinol. 2021;529:111119
44. Huang G, Wu Q, Zheng Z, Shao T, Lv X. Identification of Candidate Biomarkers and Analysis of Prognostic Values in Oral Squamous Cell Carcinoma. Front Oncol. 2019;9:1054
45. Liu Y, Liu Z. Emerging roles of the renin-angiotensin system in select oral diseases. Oral Dis. 2025;31(1):39-49
46. Neuhaus J, Schiffer E, Mannello F. et al. Protease Expression Levels in Prostate Cancer Tissue Can Explain Prostate Cancer-Associated Seminal Biomarkers-An Explorative Concept Study. Int J Mol Sci. 2017;18(5):976
47. Hua H, Yang X, Meng D. et al. CTSG restraines the proliferation and metastasis of head and neck squamous cell carcinoma by blocking the JAK2/STAT3 pathway. Cell Signal. 2025;127:111562
48. Huang G, Wu Q, Zheng Z. et al. Bioinformatics Analyses Indicate That Cathepsin G (CTSG) is a Potential Immune-Related Biomarker in Oral Squamous Cell Carcinoma (OSCC). Onco Targets Ther. 2021;14:1275-1289
49. Zou C, Huang D, Wei H. et al. Identification of Immune-Related Risk Signatures for the Prognostic Prediction in Oral Squamous Cell Carcinoma. J Immunol Res. 2021;2021:6203759
50. Wu F, Du Y, Hou X, Cheng W. A prognostic model for oral squamous cell carcinoma using 7 genes related to tumor mutational burden. BMC Oral Health. 2022;22(1):152
51. Alatrash G, Garber HR, Zhang M. et al. Cathepsin G is broadly expressed in acute myeloid leukemia and is an effective immunotherapeutic target. Leukemia. 2017;31(1):234-237
52. Murdocca M, De Masi C, Pucci S. et al. LOX-1 and cancer: an indissoluble liaison. Cancer Gene Ther. 2021;28(10-11):1088-1098
53. de Paula Souza DPS, Dos Reis Pereira Queiroz L, de Souza MG. et al. Identification of potential biomarkers and survival analysis for oral squamous cell carcinoma: A transcriptomic study. Oral Dis. 2023;29(7):2658-2666
54. Gao X, Zhao N, Dong L. et al. A Novel Lipid Prognostic Signature of ADCY2, LIPE, and OLR1 in Head and Neck Squamous Cell Carcinoma. Front Oncol. 2021;11:735993
55. Thakore VP, Patel KD, Vora HH, Patel PS, Jain NK. Up-regulation of extracellular-matrix and inflammation related genes in oral squamous cell carcinoma. Arch Oral Biol. 2024;161:105925
56. Yadav M, Pradhan D, Singh RP. Integrated analysis and identification of nine-gene signature associated to oral squamous cell carcinoma pathogenesis. 3 Biotech. 2021;11(5):215
57. Wu L, Liu Y, Deng W. et al. OLR1 Is a Pan-Cancer Prognostic and Immunotherapeutic Predictor Associated with EMT and Cuproptosis in HNSCC. Int J Mol Sci. 2023;24(16):12904
58. Liu C, Wu K, Li C. et al. SPP1+ macrophages promote head and neck squamous cell carcinoma progression by secreting TNF-alpha and IL-1beta. J Exp Clin Cancer Res. 2024;43(1):332
59. Suwanwela J, Osathanon T. Inflammation related genes are upregulated in surgical margins of advanced stage oral squamous cell carcinoma. J Oral Biol Craniofac Res. 2017;7(3):193-197
60. Fan Z, Zheng Y, Li X. et al. Promoting role of pentraxin-3 in esophageal squamous cell carcinoma. Mol Ther Oncolytics. 2022;24:772-787
61. Moosavi M, Elham Y. Aquaporins 1, 3 and 5 in Different Tumors, their Expression, Prognosis Value and Role as New Therapeutic Targets. Pathol Oncol Res. 2020;26(2):615-625
62. Tomita Y, Dorward H, Yool AJ. et al. Role of Aquaporin 1 Signalling in Cancer Development and Progression. Int J Mol Sci. 2017;18(2):299
63. Moon CS, Moon D, Kang SK. Aquaporins in Cancer Biology. Front Oncol. 2022;12:782829
64. Pan W, Huang W, Zheng J, Meng Z, Pan X. Construction of a prognosis model of head and neck squamous cell carcinoma pyroptosis and an analysis of immuno-phenotyping based on bioinformatics. Transl Cancer Res. 2024;13(1):299-316
65. Liu L, Liu Q. Characterization of macrophages in head and neck squamous cell carcinoma and development of MRG-based risk signature. Sci Rep. 2024;14(1):9914
66. Lehnerdt GF, Bachmann HS, Adamzik M. et al. AQP1, AQP5, Bcl-2 and p16 in pharyngeal squamous cell carcinoma. J Laryngol Otol. 2015;129(6):580-6
67. Asgharzadeh F, Geraylow KR, Khazaei M. et al. Angiotensin-converting Enzyme Inhibitors and Angiotensin Receptor Blockers as Potential Therapeutic Options for Pancreatic Cancer. Curr Cancer Drug Targets. 2022;22(10):785-795
68. Hashemzehi M, Beheshti F, Hassanian SM. et al. Therapeutic potential of renin angiotensin system inhibitors in cancer cells metastasis. Pathol Res Pract. 2020;216(7):153010
69. Pinter M, Jain RK. Targeting the renin-angiotensin system to improve cancer treatment: Implications for immunotherapy. Sci Transl Med. 2017;9(410):eaan5616
70. Meng D, Liu T, Ma F, Wang M. Screening the key genes of prognostic value in the microenvironment for head and neck squamous cell carcinoma. Medicine (Baltimore). 2021;100(4):e24184
71. Zhao Y, Wang H, Li X. et al. Ang II-AT1R increases cell migration through PI3K/AKT and NF-kappaB pathways in breast cancer. J Cell Physiol. 2014;229(11):1855-62
72. Bose SK, Gibson W, Giri S, Nath N, Donald CD. Angiotensin II up-regulates PAX2 oncogene expression and activity in prostate cancer via the angiotensin II type I receptor. Prostate. 2009;69(12):1334-42
73. Uemura H, Ishiguro H, Nagashima Y. et al. Antiproliferative activity of angiotensin II receptor blocker through cross-talk between stromal and epithelial prostate cancer cells. Mol Cancer Ther. 2005;4(11):1699-709
74. Takahashi M, Suzuki E, Takeda R. et al. Angiotensin II and tumor necrosis factor-alpha synergistically promote monocyte chemoattractant protein-1 expression: roles of NF-kappaB, p38, and reactive oxygen species. Am J Physiol Heart Circ Physiol. 2008;294(6):H2879-88
75. Huber MA, Azoitei N, Baumann B. et al. NF-kappaB is essential for epithelial-mesenchymal transition and metastasis in a model of breast cancer progression. J Clin Invest. 2004;114(4):569-81
76. Xie T, Xia Z, Zhang N, Gong W, Huang S. Constitutive NF-kappaB activity regulates the expression of VEGF and IL-8 and tumor angiogenesis of human glioblastoma. Oncol Rep. 2010;23(3):725-32
77. Rosenberg SA. IL-2: the first effective immunotherapy for human cancer. J Immunol. 2014;192(12):5451-8
78. Raeber ME, Sahin D, Boyman O. Interleukin-2-based therapies in cancer. Sci Transl Med. 2022;14(670):eabo5409
79. Hernandez R, Poder J, LaPorte KM, Malek TR. Engineering IL-2 for immunotherapy of autoimmunity and cancer. Nat Rev Immunol. 2022;22(10):614-628
Author contact
![]() Corresponding authors: Juan Wang, wangj255sysu.edu.cn; Bin Cheng, chengbinsysu.edu.cn.
Corresponding authors: Juan Wang, wangj255sysu.edu.cn; Bin Cheng, chengbinsysu.edu.cn.