Impact Factor ISSN: 1449-1907
- Issue 9; 2026
- Issue 8; 2026
- Issue 7; 2026
- Issue 6; 2026
- Issue 5; 2026
- Volume 23; 2026
- Past Issues
- Editorial Board
- Cover Images
- Index & Coverage
- Cover Suggestion
- Special Issues
Introduction
Methods
Results
Discussion
Abbreviations
Supplementary Material
Acknowledgements
References

 Global reach, higher impact
Int J Med Sci 2022; 19(13):1888-1902. doi:10.7150/ijms.76660 This issue Cite
Research Paper
A Bioinformatics Perspective on the Dysregulation of Ferroptosis and Ferroptosis-related Immune Cell Infiltration in Alzheimer's Disease
Lusi Zhang1, Jia Fang2, Zhenchu Tang2, Yingying Luo2 ![]()
1. Department of Ophthalmology, The Second Xiangya Hospital, Central South University, Changsha, Hunan, China.
2. Department of Neurology, The Second Xiangya Hospital, Central South University, Changsha, Hunan, China.
Received 2022-6-29; Accepted 2022-10-13; Published 2022-10-24
Abstract

Alzheimer's disease (AD) is the most prevalent dementia worldwide, but its pathophysiology and molecular events remain unknown. Herein, we first analyzed the differential expression pattern of patients' AD hippocampus through gene expression array data from the GEO database. Notch2nl, TGFB1I1, and LTF were up-regulated in AD patients, while ARPC1A, CHGB, and MPV17 down-regulated. Second, dysregulation of ferroptosis related genes was demonstrated from our data: PCBP2 and FTL significantly up-significant in AD hippocampus, while VDAC2, LPCAT3, GSS, ACSL4, and ACSL6 significantly down-regulated. The protein-protein interactions (PPI) network revealed that FTL was involved in iron metabolism and utilization, while ACSL4 and ACSL6 were involved in a polyunsaturated fatty acids metabolism network. Gene correlation analysis on differential expressed genes (DEGs) indicated that ferroptosis regulates a series of biological processes and pathways related to AD pathogenesis. Third, ferroptosis-related DEGs regulated the immune cell infiltration pattern in the AD hippocampus, characterized by decreased memory B cells, increased memory resting CD4+ T cells, memory activated CD4+ T cells, and resting NK cells. The altered expression of ferroptosis-related DEGs affected the infiltration of specific immune cell types. The model constructed by the seven ferroptosis-related differential genes may accurately predict the outcome of AD occurrence. Finally, qPCR validation on these ferroptosis-related DEGs in APPswe/PSEN1dE9 mice confirmed the dysregulated expression of Pcbp2, FTL, GSS, and ACSL4 in the AD hippocampus and forebrain. In conclusion, our results supported the conception that the AD brain revealed dysregulated ferroptosis and immune cell infiltration.
Keywords: Alzheimer's Disease, ferroptosis, immune cell infiltration, hippocampus
Introduction
Alzheimer's disease (AD) is the leading cause of dementia. Over 90% of AD cases have a late-onset, occurring in individuals older than 65 [1]. AD is characterized by gradual memory loss associated with progressive brain atrophy. The pathological AD hallmark is the accumulation of β-amyloid (Aβ) and neurofibrillary tangles of hyperphosphorylated tau. Several factors contributed to the disease onset. Genetic etiology has been reported to be AD cause. For example, pathogenic mutations on amyloid precursor protein (APP), presenilin 1 (PSEN1) and presenilin 2 (PSEN2) may lead to familial AD form [2]. Genetic risk factors account for approximately 70% of the risk in late-onset AD patients, with the APOE gene, which has three variants, e2, e3, and e4, being the most significant risk factor [3].
AD pathogenesis has been thoroughly studied for decades. The most prevalent AD theory is the amyloid hypothesis: the APP cleavage product Aβ is produced by γ-secretase. The imbalance between Aβ production and Aβ clearance leads to fibrillar amyloid within amyloid plaques [3]. Another crucial factor leading to AD is secondary tau pathology, which is associate with hippocampal synaptic impairments and memory deficits in animal models [4]. Furthermore, TAR DNA-binding protein 43 (TDP-43) aggregates are recurrently found in AD [5]. However, the complex AD pathophysiology remains unknown, and no effective AD treatments exists. Understanding the molecular events that lead to damage downstream of AD pathology holds great promise for developing new therapy.
Among the degeneration of the AD brain, deficits of neuronal death can be observed in the AD brain, including apoptosis [6], autophagy [7], necroptosis [8], and pyroptosis [9]. Recent evidence suggests that ferroptosis, a novel defined form of iron-dependent regulated cell death (RCD), may play a role in AD pathogenesis [10, 11]. Iron involves in maintaining normal brain functions, including mitochondrial respiration, myelin synthesis, and neurotransmitter synthesis or metabolism [11]. In AD pathogenesis, iron is crucial in oxidative stress [12]. Iron homeostasis is typically altered in AD patients, including lower serum iron levels [13] and iron overload in AD brain regions [14, 15]. Iron plays a vital role in ferroptosis. Ferroptosis is usually triggered by phospholipid peroxidation, which is produced by a process involving iron transition, reactive oxygen species (ROS), and polyunsaturated fatty acid (PUFA) chains [16]. During ferroptosis, the iron-dependent Fenton chain reaction is initiated and amplified by phospholipid hydroperoxides (PLOOHs), which react with ferrous and ferric ions to generate the free radicals PLO• and PLOO•. These free radicals, in turn, drive the destructive peroxidation chain reaction. Furthermore, iron participates in a series of redox-based metabolic processes that are contribute to the generation of cellular ROS [17]. Overall, ferroptosis is considered a pathological AD feature. Ferroptosis modulation can serve as a therapeutic avenue. However, the precise mechanism of how ferroptosis induces neural death in the brain remains unclear and must be explored.
To unravel the molecular basis underlying the loss of neurons in a specific brain region in the AD context, we used the hippocampus gene expression array data of control and AD subjects to detect the possible mechanism and the effect of ferroptosis on AD. Our results demonstrated that the expression of several ferroptosis-related genes is dysregulated in the AD hippocampus, which mainly involves networks associated with iron metabolism, iron utilization and PUFA metabolism, and is highly coexpressed with other differentially expressed genes (DEGs). Furthermore, these genes alter the infiltration of specific types of immune cells in the AD hippocampus. Therefore, our findings suggest that ferroptosis plays an essential role in AD pathogenesis and that inhibiting ferroptosis could be a potential therapeutic target for AD treatment.
Methods
Data source
Hippocampus gene expression array data of control and AD subjects and corresponding clinical features were obtained from the Gene Expression Omnibus (GEO) database (https://www.ncbi.nlm.nih.gov/geo/) in the National Center of Biotechnology Information (NCBI) (https://www.ncbi.nlm.nih.gov/). Our study comprised data from 116 subjects (65 controls and 51 AD patients) derived from GEO Datasets GSE1297, GSE5281, and GSE48350.
Forty-one ferroptosis-related genes were obtained from the Kyoto Encyclopedia of Genes and Genomes (KEGG) pathway hsa04216 (https://www.kegg.jp/pathway/hsa04216. The gene list is as follow: SLC3A2, SLC7A11, GCLC, GCLM, GSS, GPX4, ALOX15, LPCAT3, ACSL6, ACSL4, ACSL1, ACSL5, ACSL3, TP53, SAT2, SAT1, TFTFRC, STEAP3, SLC11A2, SLC39A8, SLC39A14, PCBP2, SLC40A1, CP, PCBP1, FTH1, FTL, MAP1LC3C, MAP1LC3B, MAP1LC3A, MAP1LC3B2, ATG5, ATG7, NCOA4, PRNP, HMOX1, VDAC2, VDAC3, CYBB, and FTMT.
Data combination, normalization, and differential expression analysis
To analyze publicly available data sets from different datasets, we processed expression data using the limma and sva packages in R 4.1.1, including data combine and batch effect removal. All datasets were then normalized using the R package preprocessCore. Differential expression analysis was performed using the R package limma. The threshold of DEGs was set as |log fold change (FC)| >1, P < 0.05. The R package ggplot2 was used to visualize the volcano plots and box plots of DEGs. Heatmaps were built using the R package pheatmap. The gene set used for further analysis was generated by surveying ferroptosis-related DEGs, revealing involvement of seven hub genes.
Gene Ontology and KEGG Enrichment
Gene Ontology (GO) and KEGG pathway analyses were performed with the R package clusterProfiler for all DEGs as well as 7 ferroptosis related hub genes. P values < 0.05 was considered statistically significant.
Protein-Protein Interaction Network Construction
To further explain the interactions between ferroptosis and AD pathology in the brain, we performed protein-protein interaction (PPI) network analysis was using the STRING database [18] (https://string-db.org/) on ferroptosis-related genes and our DEGs. A confidence score > 0.4 was considered significant. The PPI results were then imported into Cytoscape 3.9.1. The MCODE and Centiscape 2.2 plug-ins were used to identify out the hub genes in the network. Each network's top 5 or 10 genes were generated using the MCC algorithm with the Cytoscape plug-in cytoHubba.
Assessment of immune cell infiltration
The R package CIBERSORT was used to evaluate the immune infiltration of 22 types of immune cells from previously obtained gene expression data. The R package ggplot2 was used to visualize the proportion of each immune cell subtypes and immune cell type with significantly differential infiltrate level (P < 0.05). The relationship between the expression of seven ferroptosis-related hub genes and infiltrating immune cells was displayed using the R package ggplot2.
Gene Set Enrichment Analysis
Pairwise correlations between the seven ferroptosis-related hub genes were visualized as chord diagrams through the R package circlize. Pairwise correlations were also performed between the seven ferroptosis-related hub genes and all the DEGs we obtained from the public database. Gene set enrichment analysis (GSEA) was performed with default parameters through the GSEA software for the pairwise correlation results against the Reactome data set.
Diagnostic receiver operating characteristic curve
The diagnostic ROC curve was drawn based on AD status in our 65 controls and 51 AD patients. The area under the curve (AUC) represents the probability of estimatng the accuracy of the actual observation rate and the predicted disease probability. Logistic regression models were implemented by using the R function glm. Our logistics model = 14.128 + (-0.4337 × GSS) + (1.5223 × PCBP2) + (-0.7593 × ACSL4) + (-0.8506 × FTL) + (-0.2677 × ACSL6) + (-0.7829 × LPCAT3) + (-1.6571 × VDAC2). The ROC analysis was performed with the R package pROC, and the data visualization was performed using R package ggplot2.
qPCR validation of differentially expressed ferroptosis-related hub genes in the hippocampus and forebrain cortex of AD mice
The hippocampus and forebrain cortex tissue were obtained from 6-months-olds APPswe/PSEN1dE9 mice and C57BL/6 wildtype mice. This study was approved by the Ethics Committee of Xiangya Hospital, Central South University, China. The hippocampus and forebrain cortex were cut, homogenized, and stored at -80 °C. TRIzol RNA Isolation Reagents (Thermo Scientific™, Waltham, MA, USA) were added to the tissue homogenates, and RNA was extracted according to the manufacturer's protocol. Approximately 1 µg total RNA was used to reverse-transcript into cDNA with RevertAid First Strand cDNA Synthesis Kit (Thermo Scientific™, Waltham, MA, USA). Quantitive PCR was used to detect the expression of seven ferroptosis-related hub genes. The mouse transcripts were amplified using the following primers: 5'-AATCAATGCCAGGCTTTCCTC-3' and 5'-TTAAAACCTGGAATCGCTGACTG-3' for Pcbp2, 5'-CACCTACCTCTCTCTGGGCT-3' and 5'-CGCGATCGTTCTGAAACTCG -3' for FTL, 5'-AGAGAAGTGGAACACCGATAAC-3' and 5'-CAGCCCTCGTAACCAAAGACA-3' for Vdac2, 5'-GGCCTCTCAATTGCTTATTTCA-3' and 5'-AGCACGACACATAGCAAGGA-3' for LPCAT3, 5'- CTTCCTCTTAAGGCCGGGAC-3' and 5'-TGCCATAGCGTTTTTCTTAGATTT-3' for ACSL4, 5'-GCCCCATTCACGCTCTTCCCC-3' and 5'-ATGCCCGGCCTGCTTAGCTC-3' for GSS, 5'-AAGCAGTCGGAAGAAGTGGAG-3' and 5'-GGCATCGTCATAGTAATGGGTAAG-3' for ACSL6, 5'-CACGATGGAGGGGCCGGACTCATC-3' and 5'-TAAAGACCTCTATGCCAACACAGT-3' for β-actin. Quantitative real-time PCR was conducted using an Applied Biosystems™ StepOnePlus™ Real-Time PCR System (Roche, Inc., Waltham, MA, USA) with Roche FastStart™ Universal SYBR® Green Master Mixes (Thermo Scientific, Inc., Basel, Switzerland). Each group contained tissue from three animals. Statistically significant differences between groups were determined using an unpaired t test.
Results
Transcriptome alteration is revealed within hippocampus samples of AD patients
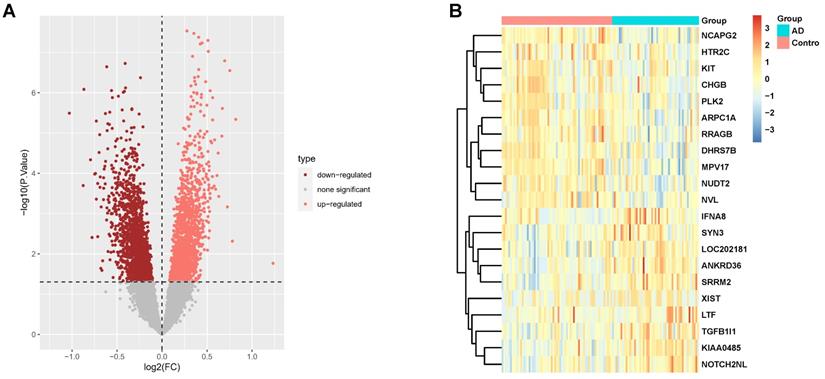
Our study incorporated 116 hippocampus gene expression array data from the GEO database including 65 control subjects and 51 AD subjects. Table 1 presents the basic information for these subjects. These data come from three separate datasets; batch effect removal and data normalization were initially conducted to combine them (Supplementary Fig. 1). There were 3331 DEGs in the AD hippocampus, where 1613 genes were down-regulated, and 1718 genes were up-regulated. The DEGs are shown in the volcano plot (Fig. 1A) and heatmap (Fig. 1B). The genes corresponding to the top 20 differences in transcriptome are listed in the heatmap. Among them, Notch2nl, TGFB1I1, and LTF were up-regulated in AD patients, while ARPC1A, CHGB, and MPV17 were down-regulated.
Demographic information between patients and controls
| Control | Patients | |
|---|---|---|
| Patients No. | 65 | 51 |
| Age (median, range) | 79 (20, 102) | 85 (60, 101) |
| Gender (%) | ||
| Female | 36.9 | 58.8 |
| Male | 63.1 | 41.2 |
DEGs screening in AD hippocampus compared to normal controls. (A, B) Volcano plot (A) and heatmap (B) in datasets GSE1297, GSE5281, and GSE4835.
Enrichment Analysis of GO and KEGG pathways reveal some crucial processes and pathways in AD pathology
Functional enrichment analysis of the DEGs from the transcriptome analysis yielded statistically significant GO terms and KEGG pathways involved in AD pathology. In AD subjects, the top ten biological processes of the DEGs are mainly related to negative regulation of the cell cycle, ATP metabolic process, cellular respiration, and IL1β-mediated signal pathway (Fig. 2A), indicating that mitotic cell cycle and cell cycle transition, mitochondrial function and respiratory electron transport chain, and IL1β-related inflammation were all affected in AD. GO terms in cellular components associated with DEGs implicated in mitochondria matrix and inner membrane, respiratory chain complex, and proteasome complex (Fig. 2A), are crucial pathways in AD pathology. DEGs involve GO molecular function, including transcription coregulator/coactivator activity, NADH-related oxidoreductase activity, and electron transfer activity, which is significantly affected (Fig. 2A).
Enrichment Analysis of GO and KEGG Pathways of DEGs in AD. (A) Results of GO enrichment analysis of the DEGs. (B) The top 20 pathways result in GO enrichment analysis of the DEGs.
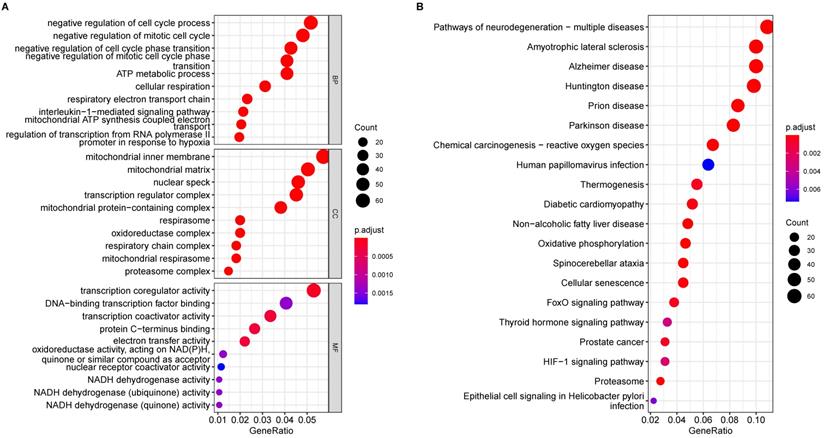
KEGG analysis of the DEGs revealed 38 significant enrichment pathways (P < 0.05) (Supplementary Table 1); Fig. 2B displays the top 20 pathways. Enriched AD categories are also involved in other neurodegenerative diseases, such as Huntington's disease, Prion disease, Spinocerebellar ataxia, and Amyotrophic lateral sclerosis. Moreover, other enriched pathways involve reactive oxygen species, oxidative phosphorylation, cellular senescence, and proteasomes.
The expression of ferroptosis related genes is dysregulated in AD hippocampus samples
Emerging research between ferroptosis and neurodegenerative disease was reported in a recent study that suggested that ferroptosis contributes to AD pathology. To identify possible roles of ferroptosis-related genes in AD, we obtained the intersection of ferroptosis-related genes and our above DEGs (Fig. 3A), which yielded a subset of nine genes in the volcano plot (Fig. 3B). As evident in Figs 3B and 3C, PCBP2, FTL, and SLC7A11 were significantly up-regulated in AD, while VDAC2, LPCAT3, GSS, ACSL4, ACSL6, and ATG7 were down-regulated, indicating that ferroptosis was altered in AD hippocampus.
Ferroptosis-related genes are dysregulated in the AD hippocampus. (A) Venn diagram showing the overlapping genes of ferroptosis-related genes and DEGs. The expression of overlapping genes in the volcano plot (B). Significant up-regulated and down-regulated genes are labeled as pink and dark red dots, respectively, in the volcano plot. (C) Heatmap displays the expression level of nine differential ferroptosis-related genes in AD and control groups. (D) The expression levels of the nine ferroptosis-related genes were visualized with a boxplot. *, P < 0.05; ***, P < 0.001; ns, not significant. (E) The correlations between DEGs. The color lines represent the correlation between gene expression. Red represents a positive correlation, while green represents a negative correlation. The dimmer the color or the thicker the line, the higher the correlation strength.
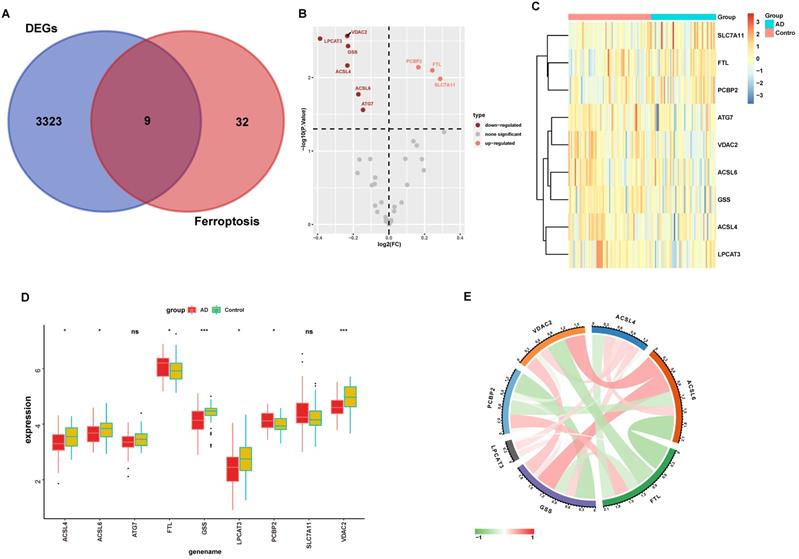
Furthermore, the expression levels of these nine ferroptosis-related genes were analyzed in these samples using boxplots (Fig. 3D), and seven ferroptosis-related genes were subsequently validated. PCBP2 and FTL were significantly up-regulated in AD hippocampus samples compared with normal tissues, while VDAC2, LPCAT3, GSS, ACSL4, and ACSL6 were significantly down-regulated. We used the circlize tool to determine the correlations between these seven significantly differential expressed genes. Strong positive correlations between these genes suggest a co-activation relationship between them. FTL and ACSL6 exhibited a negative expression correlation, while ACSL6 and GSS exhibited a positive expression correlation (Fig. 3E).
PPI Network construction of ferroptosis related genes
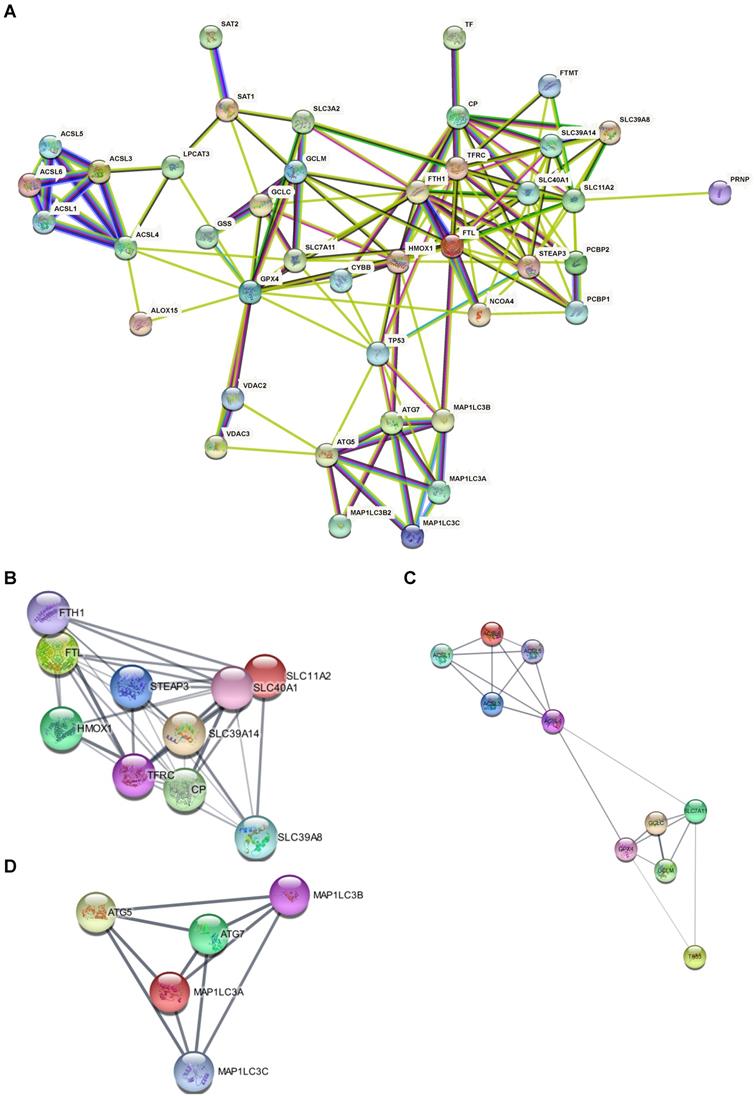
Based on the 41 ferroptosis-related genes and the PPI repository STRING, we constructed functional interaction between ferroptosis proteins (Fig. 4A). Our network demonstrated 42 nodes and 144 edges. Some distinct clusters with a high combined score were found among these ferroptosis-related genes (Table 2). The up-regulated expressed gene FTL in the AD hippocampus involved the network (Fig. 4B) which is associated with iron metabolism and utilization [19]. Likewise, down-regulated expressed genes ACSL4 and ACSL6 were involved in another network (Fig. 4C) of PUFA metabolism [20], while ATG7 was the hub gene of the third network (Fig. 4D). The PPI results suggest that dysregulation of ferroptosis is correlated with AD.
PPI Network of ferroptosis related genes suggests that dysregulation of ferroptosis was correlated with AD. (A) PPI Network of ferroptosis-related genes. (B, C, D) Subclusters of ferroptosis-related DEGs.
Clusters and subnetwork of PPI with a high combined score among the ferroptosis-related DEGs
| Rank | Gene | MCC | DMNC | MNC | Degree | EPC | BottleNeck | EcCentricity | Closeness | Radiality | Betweenness | Stress | ClusteringCoefficient |
|---|---|---|---|---|---|---|---|---|---|---|---|---|---|
| Top 10 in network 1 ranked by MCC method | |||||||||||||
| 1 | CP | 6480 | 9 | 9 | 9 | 5.172 | 2 | 1 | 9 | 2.33333 | 1.83333 | 10 | 0.86111 |
| 2 | SLC11A2 | 6480 | 9 | 9 | 9 | 5.164 | 1 | 1 | 9 | 2.33333 | 1.83333 | 10 | 0.86111 |
| 3 | SLC40A1 | 6480 | 9 | 9 | 9 | 5.274 | 1 | 1 | 9 | 2.33333 | 1.83333 | 10 | 0.86111 |
| 4 | TFRC | 6480 | 9 | 9 | 9 | 5.172 | 2 | 1 | 9 | 2.33333 | 1.83333 | 10 | 0.86111 |
| 5 | FTH1 | 5760 | 8 | 8 | 8 | 4.95 | 1 | 0.5 | 8.5 | 2.22222 | 0.66667 | 4 | 0.92857 |
| 6 | FTL | 5760 | 8 | 8 | 8 | 4.948 | 1 | 0.5 | 8.5 | 2.22222 | 0.66667 | 4 | 0.92857 |
| 7 | STEAP3 | 5760 | 8 | 8 | 8 | 5.03 | 1 | 0.5 | 8.5 | 2.22222 | 0.66667 | 4 | 0.92857 |
| 8 | SLC39A14 | 5760 | 8 | 8 | 8 | 5.018 | 1 | 0.5 | 8.5 | 2.22222 | 0.66667 | 4 | 0.92857 |
| 9 | SLC39A8 | 720 | 6 | 6 | 6 | 4.579 | 1 | 0.5 | 7.5 | 2 | 0 | 0 | 1 |
| 10 | HMOX1 | 720 | 6 | 6 | 6 | 4.335 | 1 | 0.5 | 7.5 | 2 | 0 | 0 | 1 |
| Top 3 in network 2 ranked by MCC method | |||||||||||||
| 1 | MAP1LC3B | 24 | 0.56839 | 4 | 4 | 3.357 | 1 | 1 | 4 | 1.5 | 0 | 0 | 1 |
| 2 | MAP1LC3A | 24 | 0.56839 | 4 | 4 | 3.348 | 1 | 1 | 4 | 1.5 | 0 | 0 | 1 |
| 3 | MAP1LC3C | 24 | 0.56839 | 4 | 4 | 3.324 | 1 | 1 | 4 | 1.5 | 0 | 0 | 1 |
| Top 5 in network 3 ranked by MCC method | |||||||||||||
| 1 | ACSL1 | 24 | 0.56839 | 4 | 4 | 2.038 | 1 | 1 | 4 | 1.5 | 0 | 0 | 1 |
| 2 | ACSL3 | 24 | 0.56839 | 4 | 4 | 2.014 | 1 | 1 | 4 | 1.5 | 0 | 0 | 1 |
| 3 | ACSL5 | 24 | 0.56839 | 4 | 4 | 2.016 | 1 | 1 | 4 | 1.5 | 0 | 0 | 1 |
| 4 | ACSL4 | 24 | 0.56839 | 4 | 4 | 2.042 | 1 | 1 | 4 | 1.5 | 0 | 0 | 1 |
| 5 | ACSL6 | 24 | 0.56839 | 4 | 4 | 2.03 | 1 | 1 | 4 | 1.5 | 0 | 0 | 1 |
Ferroptosis is correlated with AD
To confirm the relationship between the seven ferroptosis-related hub genes and the 41 ferroptosis-related genes in the AD patients, we performed correlation analyses of these two sets of expression data across all controls and AD patients. The heatmaps in Fig. 5 revealed the top 50 coexpressed genes to each ferroptosis-related DEGs.
Correlation between ferroptosis-related DEGs and AD DEGs. (A-G) Heatmaps of the top 50 coexpressed genes to ACSL4, ACSL6, FTL, GSS, LPCAT3, PCBP2, and VDAC2.
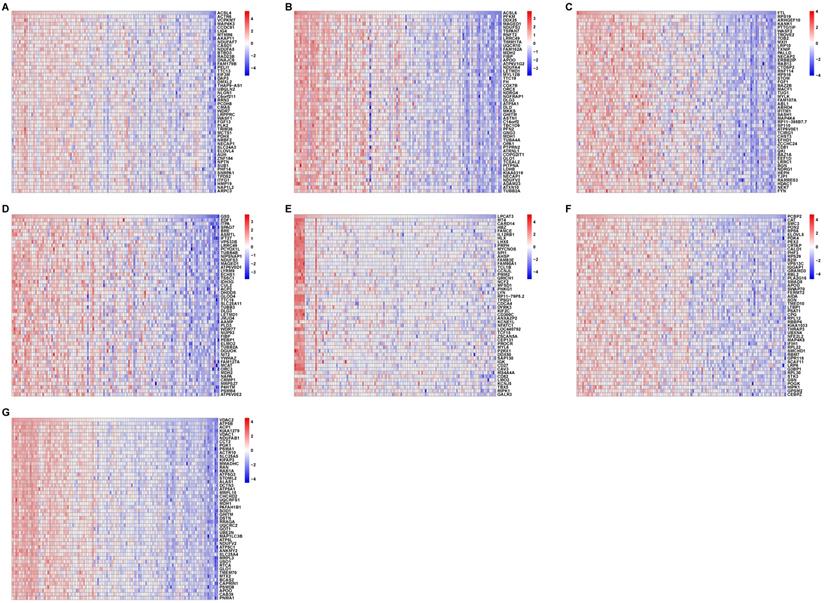
GO analysis revealed that these coexpressed genes regulated different biological functions and pathways (Fig. 6). ACSL4 is a cellular membrane protein that promotes the ferroptosis process by activating PUFAs for phospholipid biosynthesis [21]. The top 50 coexpressed genes of ACSL4 enriched in the GO categories included bounding membrane of organelle, phosphorus metabolic process, and establishment of cell localization (Fig. 6A). FTL encodes ferritin light chain, which is the subunit of a cytosolic iron storage protein. FTL protein can regulate ferroptosis by controlling free iron levels [22]. Homozygous loss of function mutation in FTL caused a neurodegenerative disease hallmarked by idiopathic generalized seizures and atypical restless leg syndrome [23]. The top 50 coexpressed genes of FTL enriched in GO terms including ribonucleotide binding, bounding membrane of organelle, and cell projection organization (Fig. 6C).
GO enrichment analysis of coexpressed genes of ferroptosis-related DEGs in AD. (A-G) GO ridge plot of the top 50 coexpressed genes to ACSL4, ACSL6, FTL, GSS, LPCAT3, PCBP2, and VDAC2.
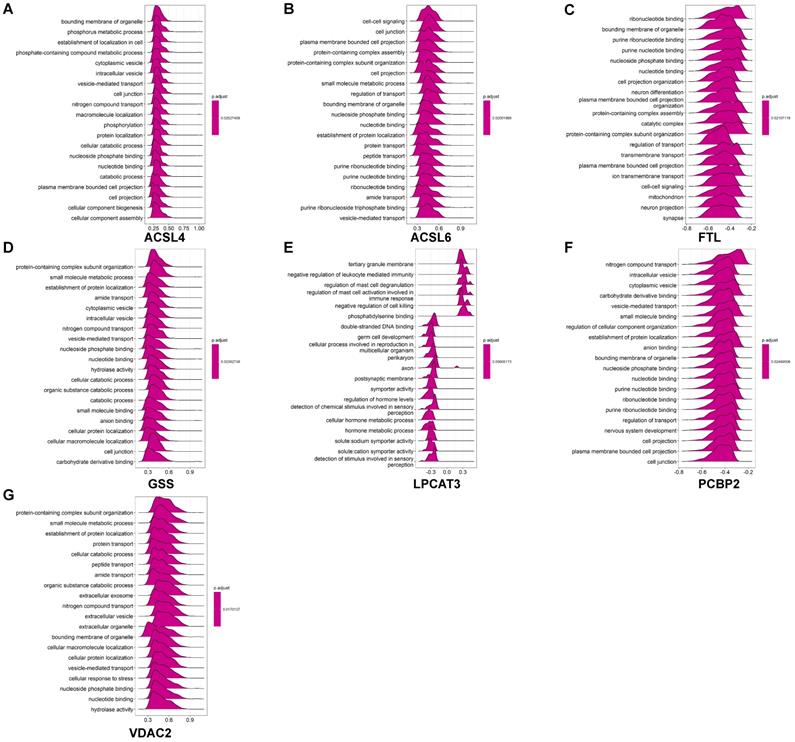
Figure 6 displays GO enrichment results for other ferroptosis-related DEGs. The coexpressed genes GSS, ACSL6 and PCBP2 (Figs. 6B, 6D, 6F, respectively) shared some GO terms, including the establishment of protein localization, cell junction, and transport regulation. The GO enrichment on coexpressed gene VDAC2 exhibited biological processes on extracellular exosomes and extracellular vesicles, whereas some immune-related GO terms (negative regulation of leukocyte mediated immunity and regulation of mast cell activation involved in immune response) are also involved in postsynaptic membrane and axon in LPCAT3 associated coexpressed genes (Figs. 6E-6G).
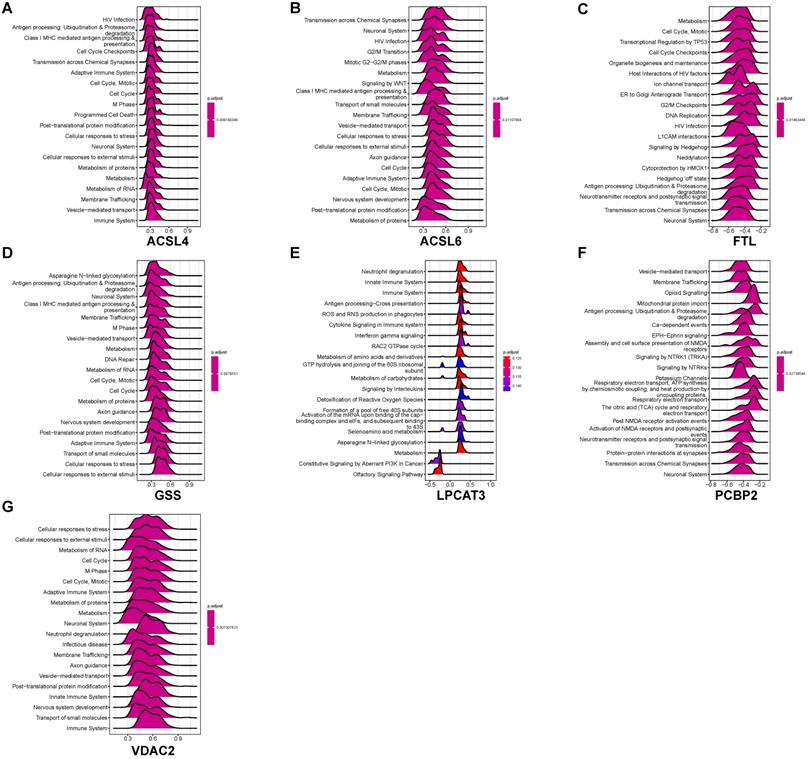
We performed GSEA to identify coexpression network modules of seven ferroptosis-related DEGs in relation to REACTOME pathways. Figure 7 depicts the ridge plot of the top 20 REACTOME pathways of seven ferroptosis-related DEGs. The genes participated in pathways closely related to AD pathological mechanism, including ubiquitination and proteasome degradation (ACSL4, GSS), programmed cell death (ACSL4), and cellular responses to stress (ACSL4, ACSL6, GSS, VDAC2). Pathways related to the biological function of nervous system, including the neuronal system (ACSL4, ACSL6, GSS, VDAC2), neurotransmitter receptors and postsynaptic signal transmission (FTL, PCBP2, ACSL4), nervous system development (VDAC2, GSS, ACSL6), were also affected. Immune pathways were also involved in AD pathology. The REACTOME pathways on seven ferroptosis-related DEGs involved the adaptive immune system (VDAC2, GSS, ACSL6, ACSL4), innate immune system (VDAC2, LPCAT3), and neutrophil degranulation (VDAC2, LPCAT3). Our results indicate that ferroptosis may directly or indirectly regulate a series of biological processes and pathways, thereby influencing the AD pathogenesis.
GSEA identifies coexpression network modules of seven ferroptosis-related DEGs to the REACTOME pathways. (A-G) GSEA of coexpressed ACSL4, ACSL6, FTL, GSS, LPCAT3, PCBP2, and VDAC2 to ferroptosis-related DEGs.
Ferroptosis-related DEGs regulate the immune cell infiltration pattern in the AD hippocampus
The infiltration of immune cells and the release of pro-and anti-inflammatory cytokines are crucial to AD pathology [24]. Our previous results suggested that LPCAT3 was down-regulated in the AD hippocampus and could regulate an immune-related biological process. Therefore, we analyzed the infiltrated immune cell category and proportion in our AD and control samples (Fig. 8A), and found that 22 types of immune cells are present among AD and normal hippocampus.
Immune cell infiltration pattern in AD hippocampus. (A) Infiltrated immune cell category and proportion in AD and control samples. (B) Four types of immune cells had significantly different proportions in AD patients compared with controls. *, P < 0.05; ns, not significant.
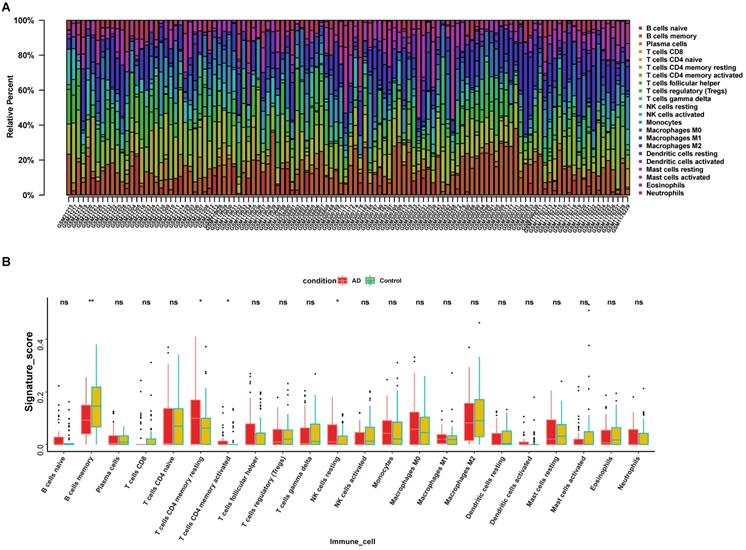
We further calculated infiltration differences of immune cells between AD and control samples among the 22 types of immune cells and found that only 4 types of immune cells had significantly different proportions in patients versus controls (Fig. 8B). Compared with control, AD hippocampus demonstrated decreased memory B cells (0.1005±0.06696 vs 0.1463±0.0961, P = 0.0049), increased memory resting CD4+ T cells (0.1166±0.1111 vs 0.0720±0.0961, P = 0.0123), increased memory activated CD4+ T cells (0.016483 ± 0.034499 vs 0.010017 ± 0.029136, P = 0.0227), and increased resting NK cells (0.0423 ± 0.0501 vs 0.0347 ± 0.029136, P = 0.0099).
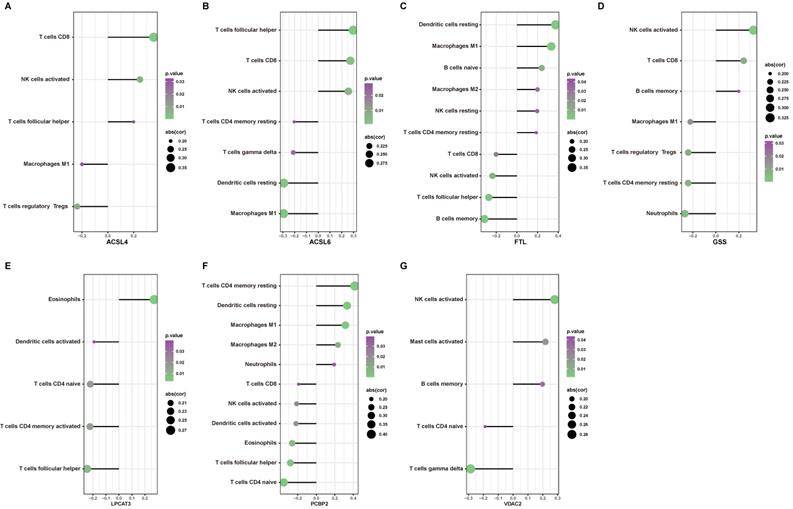
To determine the possible role of ferroptosis in the immune cell infiltration of AD hippocampus, we analyzed the correlation between previously defined ferroptosis-related DEGs and immune cell infiltration. Figure 9 depicts immune cell types with significant correlation. The expression of ACSL4 positively correlated with the infiltration of CD8+ T cells, activated NK cells, and follicular T helper cells, but negatively correlated with the infiltration of M1 macrophages and Tregs (Fig. 9A). The expression of ACSL6 positively correlated with the infiltration of CD8+ T cells, activated NK cells, and follicular T helper cells, but negatively correlated with the infiltration of CD4+ memory T cells, γδ T cells, resting dendritic cells, and M1 macrophages (Fig. 9B). The expression of FTL positively correlated with the infiltration of resting dendritic cells, M1 macrophages, naive B cells, M2 macrophages, resting NK cells, and resting memory CD4+ T cells, but was negatively correlated with CD8+ T cells, activated NK cells, follicular T helper cells, and memory B cells (Fig. 9C). The expression of GSS positively correlated with the infiltration of activated NK cells, CD8+ T cells, and memory B cells, but negatively correlated with neutrophils, resting memory CD4+ T cells, Tregs, and M1 macrophages (Fig. 9D). The expression of LPCAT3 positively correlated with the infiltration of eosinophils, but negatively correlated with activated dendritic cells, naïve CD4+ T cells, activated memory CD4+ T cells, and follicular T helper cells (Fig. 9E). The expression of PCBP2 positively correlated with the infiltration of resting memory CD4+ T cells, resting dendritic cells, M1 macrophages, M2 macrophages, and neutrophils, but negatively correlated with CD8+ T cells, activated NK cells, activated dendritic cells, eosinophils, naïve CD4+ T cells, and follicular T helper cells (Fig. 9F). The expression of VDAC2 positively correlated with the infiltration of activated NK cells, activated mast cells, and memory B cells, but negatively correlated with naïve CD4+ T cells and γδ T cells (Fig. 9G). Our findings suggest that the expression changes of ferroptosis in the AD hippocampus may alter specific types of immune cell infiltration.
The correlation between ferroptosis related DEGs and immune cell infiltration. (A-G) Significant correlations (P < 0.05) between infiltrated immune cell types and ferroptosis-related DEGs.
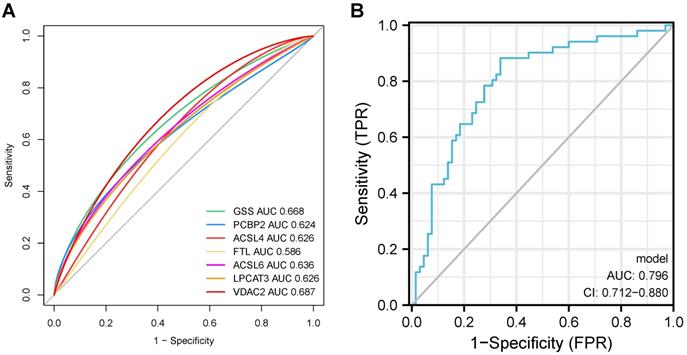
Ferroptosis-related DEGs can predict the AD probability
The predictive probabilities generated by the ferroptosis-related DEGs-related diagnostic model were used to generate a single and merged ROC curve. Every single ferroptosis-related DEG demonstrated relatively sufficient diagnostic accuracy with an AUC ranging from 0.586 to 0.687, whereas Fig. 10 displays an excellent diagnostic accuracy with an AUC of 0.796 (CI = 0.712 - 0.880). These results indicate that the model constructed by the seven ferroptosis-related DEGs may predict, to some extent, the outcome of AD occurrence.
ROC curves of seven ferroptosis-related DEGs on the outcome of AD occurrence in our datasets.
mRNA relative expression level of ferroptosis-related genes in hippocampus and forebrain cortex of AD mice compared with control. *, P < 0.05; **, P < 0.01; ***, P < 0.001; ****, P < 0.0001.
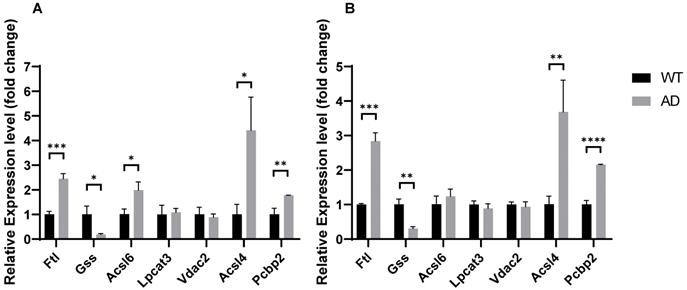
Ferroptosis-related DEGs are altered in the hippocampus and forebrain cortex of AD mice
In our previous results, the ferroptosis-related genes PCBP2 and FTL significantly up-regulated in the hippocampus of AD patients, while VDAC2, LPCAT3, GSS, ACSL4, and ACSL6 significantly down-regulated in AD patients. To further validate the ferroptosis pathway dysregulation in AD, we analyzed the expression of these genes in the brains of APPswe/PSEN1dE9 mice and wildtype mice. Transgenic mice express a chimeric mouse/human amyloid precursor protein (Mo/HuAPP695swe) and a mutant human presenilin 1 (PS1-dE9), both of which are associated with early-onset AD. We performed qPCR on RNA from the hippocampus and forebrain cortex of 6-months-old APPswe/PSEN1dE9 mice and C57BL/6 wildtype mice. As evident in Fig. 10, Pcbp2 significantly up-regulated in AD hippocampus (1.7740±0.1412, P = 0.0056) and forebrain cortex (2.1550±0.0654, P = 0.00006), while FTL significantly down-regulated in AD hippocampus (1.7740±0.1412, P = 0.0056) and forebrain cortex (2.1550±0.0654, P=0.00006). Gss was significantly decreased in AD hippocampus (0.1905± 0.1921, P = 0.0131) and forebrain cortex (0.3068± 0.0936, P = 0.0017). Acsl4 significantly up-regulated in AD hippocampus (4.415± 0.8115, P = 0.0137) and forebrain cortex (3.6830±0.5497, P =0.0083), Acsl6 significantly up-regulated only in AD mice's hippocampus (1.984± 0.8115, P = 0.2282) but not in forebrain cortex (1.240± 0.1831, P = 0.2760). Moreover, Vdac2 and Lpcat3 demonstrated no expression changes in the AD mice's hippocampus or forebrain cortex. Together, our results further support the conception that the AD brain reveals dysregulated ferroptosis gene expression and indicates ferroptosis is a potential therapeutic target for AD.
Discussion
In this study, we combined hippocampal gene expression array data of 65 controls and 51 AD subjects from the GEO database and identified the DEGs. GO and KEGG analyses were performed on these genes. In the AD hippocampus, NOTCH2NL, TGFB1I1, and LTF up-regulated, while ARPC1A, CHGB, and MPV17 down-regulated, indicating that the DEGs identified here can be used as AD pathological markers or potential treatment targets. Recent research has reported that LTF, a member of the transferrin family, can interact with APPww to regulate amyloidogenic processing and neuronal Aβ production, thereby serving as the key predictor of amyloid pathology [25]. Moreover, studies have proved that negative regulation of the cell cycle [26], ATP metabolic process [27], cellular respiration [28] and IL1β-mediated signal pathway [29] are involved in AD pathology, which is consistent with our KEGG pathway analysis on the DEGs in AD identified in our study.
AD occurrence is highly related to activated neuronal or peripheral immune inflammation within patients. Compared with controls, the infiltrated immune cell category of AD hippocampus revealed a decrease in memory B cells and an increase in memory resting CD4+ T cells, memory-activated CD4+ T cells, and resting NK cells. Studies have demonstrated that CD4+ T cells, CD8+ T cells, resting NK cells, natural killer cells, monocyte-macrophage cells, and activated dendritic cells infiltrated abnormally within AD brain [30] and peripheral blood [31]. Moreover, inhibited immune cells could mitigate AD immune dysregulation and cognitive dysfunction. In an AD mouse model, the depletion of NK cells by anti-NK1.1 antibodies drastically alleviate the immune response in the brain, thereby improving cognitive function [32]. Therefore, studying the role of immune and inflammatory cells in AD may yield anti-inflammatory and immune regulatory targets for AD treatment.
Iron dyshomeostasis and ferroptosis contribute to the AD progression of [33], indicating that anti-ferroptotic therapies may be effective in AD treatment. Our analyses discovered that nine ferroptosis-related genes significantly altered in the AD hippocampus. Functional interaction and correlation analyses indicated that ferroptosis-related genes are associated with pathways such as protein transportation and localization, extracellular exosome and extracellular vesicle, and immune response. Studies have proved the specific role of ferroptosis in AD. Ferroptosis-related pathological changes have been detected in the brain of AD patients and AD mouse models, including iron metabolic abnormality, glutamate-mediated excitotoxicity, and ROS-caused oxidized lipid accumulation [34]. Iron homeostasis disruption and elevated ferritin have been observed in AD patients, along with the increased expression of a light-chain subunit of the cystine/glutamate transporter (xCT) and lipid peroxidation [34].
Ferroptosis may impair both the cognition function and neuronal survival of AD patients. Forebrain and hippocampal neuronal-specific GPX4 KO mice demonstrated apparent cognition dysfunction and hippocampal neuron degeneration, whereas ferroptosis inhibitor Liproxstatin-1 can reverse these AD-like phenotypes [10]. Likewise, other ferroptotic inhibitors such as Forsythoside A, can partially mitigate AD pathological phenotype [35, 36]. In our AD mice, expressing dysregulation of ferroptosis-related genes can be observed, although the expression of VDAC2 and LPCAT3 remain unaltered; ACSL4 and ACSL6 down-regulated in AD mice while they up-regulated in patients' hippocampus. These results further support the conception that ferroptosis is dysregulated in the AD brain. These discordances of ferroptosis gene expression between patients and mice may be because the mice mimic specific AD types with a defined genetic background, whereas the etiology of AD patients is often caused by complex genetic and genotype-environment interactions. Together, ferroptosis is strong associated with AD, leading to AD and other neurodegenerative diseases.
The transcriptome study is always a crucial issue in AD mechanism research, as it may contribute to AD onset and progression. For example, transcriptomic analysis through Illumina RNA-Seq on total brain, frontal and temporal lobes of healthy and AD post-mortem tissue revealed an overrepresentation of neuron's cytological structure and synapse function-related genes in AD brain, and alternative splicing and promoter of the APOE gene in AD brain is correlated with the progression of neurodegeneration [37]. A recent meta-analysis of 2,114 post-mortem AD human brain transcriptomes revealed 30 perturbed coexpression modules enriched in neuronal or microglial genes in mouse models of AD, Huntington's disease, amyotrophic lateral sclerosis, and aging [38]. Very few ferroptosis-related transcriptome analyses on the human brain have been reported.
However, several limitations exist in our present study. First, our results shed some light on ferroptosis as an AD cause in patients and mice, but the core ferroptotic genes leading to AD must be clarified, and some inference research should be conducted to explain their mechanism. Moreover, potential gaps exist in the clinical implementation of ferroptosis-related mechanisms for AD treatment, requiring further investigation. For example, whether manipulating specific ferroptosis genes can reserve neural degeneration in AD patients is still unknown, although some ferroptosis inhibitors such as iron chelator DFE and anti-ferroptotic agent vitamin E are undergoing clinical trials [39]. Understanding the possible mechanisms behind AD, ferroptosis, and their intersectional relationship provides new insights for AD prevention and treatment.
Abbreviations
AD: Alzheimer's Disease; APP: amyloid precursor protein; PSEN1: presenilin 1; PSEN2: presenilin 2; Aβ: β-amyloid; phospholipid hydroperoxides: PLOOHs; TDP-43: TAR DNA-binding protein 43; differential expressed genes: DEGs; ROS: reactive oxygen species; PUFA-PLs: polyunsaturated fatty acid chains; PUFAs: polyunsaturated fatty acids; NCBI: the National Center of Biotechnology Information; GO: Gene Ontology; KEGG: Kyoto Encyclopedia of Genes and Genomes; Protein-Protein Interactions: PPI; GSEA: Gene Set Enrichment Analysis; operating characteristic curve: ROC; area under the curve: AUC; light-chain subunit of the cystine/glutamate transporter: xCT.
Supplementary Material
Supplementary figure and table.
Acknowledgements
We would like to thank Prof. Lu Shen and Dr. Xixi Liu, Department of Neurology, Xiangya Hospital of Central South University providing brains of APPswe/PSEN1dE9 mice and wildtype control.
This work was supported by National Natural Science Foundation of China [grant numbers 81600996, 2016], the Hunan Provincial Natural Science Foundation of China [grant numbers 2021JJ40892, grant numbers 2021JJ40857, 2021], and China Hunan Provincial Science and Technology Department [grant numbers 2020SK2086, 2020]. The funders had no role in the study design, data collection and analysis, decision to publish or preparation of the manuscript.
Author contributions
Yingying Luo: Conceptualization, Methodology. Lusi Zhang: Software, Data Curation, Writing - Original Draft. Jia Fang: Investigation, Visualization. Zhenchu Tang: Resources, Writing- Reviewing and Editing.
Competing Interests
The authors have declared that no competing interest exists.
References
1. Yu Q, Zhong C. Membrane Aging as the Real Culprit of Alzheimer's Disease: Modification of a Hypothesis. Neurosci Bull. 2018;34:369-81
2. Lane CA, Hardy J, Schott JM. Alzheimer's disease. Eur J Neurol. 2018;25:59-70
3. Goldberg TE, Huey ED, Devanand DP. Association of APOE e2 genotype with Alzheimer's and non-Alzheimer's neurodegenerative pathologies. Nat Commun. 2020;11:4727
4. Laurent C, Dorothee G, Hunot S, Martin E, Monnet Y, Duchamp M. et al. Hippocampal T cell infiltration promotes neuroinflammation and cognitive decline in a mouse model of tauopathy. Brain. 2017;140:184-200
5. Huang W, Zhou Y, Tu L, Ba Z, Huang J, Huang N. et al. TDP-43: From Alzheimer's Disease to Limbic-Predominant Age-Related TDP-43 Encephalopathy. Front Mol Neurosci. 2020;13:26
6. Shimohama S. Apoptosis in Alzheimer's disease-an update. Apoptosis. 2000;5:9-16
7. Nixon RA, Yang DS. Autophagy failure in Alzheimer's disease-locating the primary defect. Neurobiol Dis. 2011;43:38-45
8. Caccamo A, Branca C, Piras IS, Ferreira E, Huentelman MJ, Liang WS. et al. Necroptosis activation in Alzheimer's disease. Nat Neurosci. 2017;20:1236-46
9. Tan MS, Tan L, Jiang T, Zhu XC, Wang HF, Jia CD. et al. Amyloid-beta induces NLRP1-dependent neuronal pyroptosis in models of Alzheimer's disease. Cell Death Dis. 2014;5:e1382
10. Hambright WS, Fonseca RS, Chen L, Na R, Ran Q. Ablation of ferroptosis regulator glutathione peroxidase 4 in forebrain neurons promotes cognitive impairment and neurodegeneration. Redox Biol. 2017;12:8-17
11. Stockwell BR, Friedmann Angeli JP, Bayir H, Bush AI, Conrad M, Dixon SJ. et al. Ferroptosis: A Regulated Cell Death Nexus Linking Metabolism, Redox Biology, and Disease. Cell. 2017;171:273-85
12. Lane DJR, Ayton S, Bush AI. Iron and Alzheimer's Disease: An Update on Emerging Mechanisms. J Alzheimers Dis. 2018;64:S379-S95
13. Tao Y, Wang Y, Rogers JT, Wang F. Perturbed iron distribution in Alzheimer's disease serum, cerebrospinal fluid, and selected brain regions: a systematic review and meta-analysis. J Alzheimers Dis. 2014;42:679-90
14. Ayton S, Lei P. Nigral iron elevation is an invariable feature of Parkinson's disease and is a sufficient cause of neurodegeneration. Biomed Res Int. 2014;2014:581256
15. Ayton S, Lei P, Bush AI. Biometals and their therapeutic implications in Alzheimer's disease. Neurotherapeutics. 2015;12:109-20
16. Jiang X, Stockwell BR, Conrad M. Ferroptosis: mechanisms, biology and role in disease. Nat Rev Mol Cell Biol. 2021;22:266-82
17. Bresgen N, Eckl PM. Oxidative stress and the homeodynamics of iron metabolism. Biomolecules. 2015;5:808-47
18. Szklarczyk D, Gable AL, Lyon D, Junge A, Wyder S, Huerta-Cepas J. et al. STRING v11: protein-protein association networks with increased coverage, supporting functional discovery in genome-wide experimental datasets. Nucleic Acids Res. 2019;47:D607-D13
19. Liu J, Gao L, Zhan N, Xu P, Yang J, Yuan F. et al. Hypoxia induced ferritin light chain (FTL) promoted epithelia mesenchymal transition and chemoresistance of glioma. J Exp Clin Cancer Res. 2020;39:137
20. Lee JY, Kim WK, Bae KH, Lee SC, Lee EW. Lipid Metabolism and Ferroptosis. Biology (Basel). 2021 10
21. Doll S, Proneth B, Tyurina YY, Panzilius E, Kobayashi S, Ingold I. et al. ACSL4 dictates ferroptosis sensitivity by shaping cellular lipid composition. Nat Chem Biol. 2017;13:91-8
22. Tang D, Chen X, Kang R, Kroemer G. Ferroptosis: molecular mechanisms and health implications. Cell Res. 2021;31:107-25
23. Cozzi A, Santambrogio P, Privitera D, Broccoli V, Rotundo LI, Garavaglia B. et al. Human L-ferritin deficiency is characterized by idiopathic generalized seizures and atypical restless leg syndrome. J Exp Med. 2013;210:1779-91
24. Onyango IG, Jauregui GV, Carna M, Bennett JP Jr, Stokin GB. Neuroinflammation in Alzheimer's Disease. Biomedicines. 2021 9
25. Tsatsanis A, McCorkindale AN, Wong BX, Patrick E, Ryan TM, Evans RW. et al. The acute phase protein lactoferrin is a key feature of Alzheimer's disease and predictor of Abeta burden through induction of APP amyloidogenic processing. Mol Psychiatry. 2021;26:5516-31
26. Ippati S, Deng Y, van der Hoven J, Heu C, van Hummel A, Chua SW. et al. Rapid initiation of cell cycle reentry processes protects neurons from amyloid-beta toxicity. Proc Natl Acad Sci U S A. 2021 118
27. Patro S, Ratna S, Yamamoto HA, Ebenezer AT, Ferguson DS, Kaur A. et al. ATP Synthase and Mitochondrial Bioenergetics Dysfunction in Alzheimer's Disease. Int J Mol Sci. 2021 22
28. Park MW, Cha HW, Kim J, Kim JH, Yang H, Yoon S. et al. NOX4 promotes ferroptosis of astrocytes by oxidative stress-induced lipid peroxidation via the impairment of mitochondrial metabolism in Alzheimer's diseases. Redox Biol. 2021;41:101947
29. Ng A, Tam WW, Zhang MW, Ho CS, Husain SF, McIntyre RS. et al. IL-1beta, IL-6, TNF- alpha and CRP in Elderly Patients with Depression or Alzheimer's disease: Systematic Review and Meta-Analysis. Sci Rep. 2018;8:12050
30. Wu Y, Liang S, Zhu H, Zhu Y. Analysis of immune-related key genes in Alzheimer's disease. Bioengineered. 2021;12:9610-24
31. Xu H, Jia J. Single-Cell RNA Sequencing of Peripheral Blood Reveals Immune Cell Signatures in Alzheimer's Disease. Front Immunol. 2021;12:645666
32. Zhang Y, Fung ITH, Sankar P, Chen X, Robison LS, Ye L. et al. Depletion of NK Cells Improves Cognitive Function in the Alzheimer Disease Mouse Model. J Immunol. 2020;205:502-10
33. Derry PJ, Hegde ML, Jackson GR, Kayed R, Tour JM, Tsai AL. et al. Revisiting the intersection of amyloid, pathologically modified tau and iron in Alzheimer's disease from a ferroptosis perspective. Prog Neurobiol. 2020;184:101716
34. Ashraf A, Jeandriens J, Parkes HG, So PW. Iron dyshomeostasis, lipid peroxidation and perturbed expression of cystine/glutamate antiporter in Alzheimer's disease: Evidence of ferroptosis. Redox Biol. 2020;32:101494
35. Cong L, Dong X, Wang Y, Deng Y, Li B, Dai R. On the role of synthesized hydroxylated chalcones as dual functional amyloid-beta aggregation and ferroptosis inhibitors for potential treatment of Alzheimer's disease. Eur J Med Chem. 2019;166:11-21
36. Wang C, Chen S, Guo H, Jiang H, Liu H, Fu H. et al. Forsythoside A Mitigates Alzheimer's-like Pathology by Inhibiting Ferroptosis-mediated Neuroinflammation via Nrf2/GPX4 Axis Activation. Int J Biol Sci. 2022;18:2075-90
37. Twine NA, Janitz K, Wilkins MR, Janitz M. Whole transcriptome sequencing reveals gene expression and splicing differences in brain regions affected by Alzheimer's disease. PLoS One. 2011;6:e16266
38. Wan YW, Al-Ouran R, Mangleburg CG, Perumal TM, Lee TV, Allison K. et al. Meta-Analysis of the Alzheimer's Disease Human Brain Transcriptome and Functional Dissection in Mouse Models. Cell Rep. 2020;32:107908
39. Chen K, Jiang X, Wu M, Cao X, Bao W, Zhu LQ. Ferroptosis, a Potential Therapeutic Target in Alzheimer's Disease. Front Cell Dev Biol. 2021;9:704298
Author contact
![]() Corresponding author: No. 139 Renmin Road, Furong District, Changsha, Hunan Province, China. E-mail: luoyingyingedu.cn (Y. Luo).
Corresponding author: No. 139 Renmin Road, Furong District, Changsha, Hunan Province, China. E-mail: luoyingyingedu.cn (Y. Luo).