Impact Factor ISSN: 1449-1907
- Issue 8; 2026
- Issue 7; 2026
- Issue 6; 2026
- Issue 5; 2026
- Issue 4; 2026
- Volume 23; 2026
- Past Issues
- Editorial Board
- Cover Images
- Index & Coverage
- Cover Suggestion
- Special Issues
Introduction
Materials and Methods
Results
Discussion
Abbreviations
Supplementary Material
Acknowledgements
References

 Global reach, higher impact
Int J Med Sci 2021; 18(16):3624-3630. doi:10.7150/ijms.64458 This issue Cite
Research Paper
Radiomics based on fluoro-deoxyglucose positron emission tomography predicts liver fibrosis in biopsy-proven MAFLD: a pilot study
Zhong-Wei Chen1, Kun Tang2, You-Fan Zhao1, Yang-Zong Chen2, Liang-Jie Tang3, Gang Li3, Ou-Yang Huang3, Xiao-Dong Wang4, Giovanni Targher5, Christopher D. Byrne6, Xiang-Wu Zheng1,2 ![]() , Ming-Hua Zheng3,4,7
, Ming-Hua Zheng3,4,7 ![]()
1. Department of Radiology, the First Affiliated Hospital of Wenzhou Medical University, Wenzhou, China.
2. Department of Nuclear Medicine, the First Affiliated Hospital of Wenzhou Medical University, Wenzhou, China.
3. NAFLD Research Center, Department of Hepatology, the First Affiliated Hospital of Wenzhou Medical University, Wenzhou, China.
4. Key Laboratory of Diagnosis and Treatment for the Development of Chronic Liver Disease in Zhejiang Province, Wenzhou, China.
5. Section of Endocrinology, Diabetes and Metabolism, Department of Medicine, University and Azienda Ospedaliera Universitaria Integrata of Verona, Verona, Italy.
6. Southampton National Institute for Health Research Biomedical Research Centre, University Hospital Southampton, Southampton General Hospital, Southampton, UK.
7. Institute of Hepatology, Wenzhou Medical University, Wenzhou, China.
Received 2021-7-3; Accepted 2021-8-30; Published 2021-9-7
Abstract

Rationale: Since non-invasive tests for prediction of liver fibrosis have a poor diagnostic performance for detecting low levels of fibrosis, it is important to explore the diagnostic capabilities of other non-invasive tests to diagnose low levels of fibrosis. We aimed to evaluate the performance of radiomics based on 18F-fluorodeoxyglucose (18F-FDG) positron emission tomography (PET) in predicting any liver fibrosis in individuals with biopsy-proven metabolic dysfunction-associated fatty liver disease (MAFLD).
Methods: A total of 22 adults with biopsy-confirmed MAFLD, who underwent 18F-FDG PET/CT, were enrolled in this study. Sixty radiomics features were extracted from whole liver region of interest in 18F-FDG PET images. Subsequently, the minimum redundancy maximum relevance (mRMR) method was performed and a subset of two features mostly related to the output classes and low redundancy between them were selected according to an event per variable of 5. Logistic regression, Support Vector Machine, Naive Bayes, 5-Nearest Neighbor and linear discriminant analysis models were built based on selected features. The predictive performances were assessed by the receiver operator characteristic (ROC) curve analysis.
Results: The mean (SD) age of the subjects was 38.5 (10.4) years and 17 subjects were men. 12 subjects had histological evidence of any liver fibrosis. The coarseness of neighborhood grey-level difference matrix (NGLDM) and long-run emphasis (LRE) of grey-level run length matrix (GLRLM) were selected to predict fibrosis. The logistic regression model performed best with an AUROC of 0.817 [95% confidence intervals, 0.595-0.947] for prediction of liver fibrosis.
Conclusion: These preliminary data suggest that 18F-FDG PET radiomics may have clinical utility in assessing early liver fibrosis in MAFLD.
Keywords: Metabolic dysfunction-associated fatty liver disease, Fibrosis, Radiomics, 18F-FDG PET/CT
Introduction
Metabolic dysfunction-associated fatty liver disease (MAFLD), formerly named non-alcoholic fatty liver disease (NAFLD), is becoming the most common chronic liver disease and threatening people's health seriously [1-3]. Disease severity of MAFLD should be best evaluated by the grade of activity and the stage of fibrosis [4]. In the progression of MAFLD, the stage of liver fibrosis plays a key role [5, 6]. Stage of liver fibrosis is also a strong predictor for disease-specific mortality in MAFLD, rather than other histologic features, i.e., steatosis, hepatocellular ballooning or lobular inflammation [7-9]. Currently, liver biopsy is the gold standard to stage liver fibrosis [10]. However, due to the possible acute complications and sampling errors of liver biopsy, this invasive diagnostic method is not the optimal choice in routine clinical practice [11].
Positron emission tomography (PET) is a molecular imaging modality, which has shown an important role in diagnosis, staging, assessment of response to treatment, and detecting recurrence of various types of cancers. 18F-fluorodeoxyglucose (18F-FDG), which is the most commonly used radiotracers for PET examinations, allows a direct quantification of glucose metabolism in vivo [12]. The overall metabolic activity can be expressed semi-quantitatively as standardized uptake value (SUV). Recent studies showed that impaired hepatic glucose metabolism is associated with advanced fibrosis or cirrhosis [13, 14]. However, the mean SUV or maximum SUV used in those studies neglect the heterogeneous distribution of liver histology characteristics [11, 15].
Radiomics [16], which allows the extraction of numerous quantitative features from medical imaging, so then may possibly reflect histological characteristics. Although radiomics, based on magnetic resonance imaging (MRI) or computed tomography (CT), have already been applied for diagnosing and staging fibrosis in some chronic liver diseases [17, 18], to our knowledge, there is no study on the radiomics based on 18F-FDG PET in MAFLD. Although the routine 18F-FDG PET has shown a potential role in the diagnosis and evaluation of fibrosis/cirrhosis in MAFLD, radiomics may help to scrutinize imaging data deeply to improve the performance. Since non-invasive tests for prediction of liver fibrosis have a poor diagnostic performance for detecting low levels of fibrosis [19, 20], it is important to explore the diagnostic capabilities of other non-invasive tests to diagnose low levels of liver fibrosis. Thus, the aim of our pilot study was to evaluate the performance of radiomics based on 18F-FDG PET in predicting liver fibrosis in individuals with MAFLD.
Materials and Methods
Study population and design
Subjects with biopsy-proven MAFLD, who underwent 18F-FDG PET/CT, were consecutively enrolled in this study. MAFLD was diagnosed according to newly proposed diagnostic criteria, namely evidence of fatty liver (on liver histology) in addition to one of following three criteria: 1) overweight or obesity, 2) type 2 diabetes mellitus (T2DM), or 3) presence of metabolic dysregulation [3]. Individuals with a prior history of chronic hepatitis B or C, excessive alcohol consumption, or other chronic liver diseases were excluded from the study. The study protocol was approved by the local ethics committees. Written informed consent was obtained from each subject.
Clinical and biochemical data
Clinical and biochemical data were obtained from all participants on the same day of liver biopsies. Hypertension was diagnosed if the subject had systolic blood pressure ≥130 mmHg or diastolic blood pressure ≥85 mmHg and/or if she/he assumed anti-hypertensive drugs. T2DM was diagnosed if the subject had fasting glucose levels ≥7.0 mmol/L, or glycosylated hemoglobin (HbA1c) ≥6.5% (≥48 mmol/mol), or a history of self-reported diabetes, and/or if she/he used any glucose-lowering drugs. Biochemical parameters, including serum levels of liver enzymes (alanine aminotransferase (ALT), aspartate aminotransferase (AST), and γ-glutamyltranspeptidase), total bilirubin, albumin, insulin, glucose, HbA1c, triglycerides, total cholesterol, low-density lipoprotein cholesterol and high-density lipoprotein cholesterol, were measured for each subject in the morning after an overnight fast.
Liver histology
Percutaneous liver biopsies were performed under the guidance of ultrasound and all liver histology specimens were examined by a single experienced histopathologist, who was blinded to all participant's details. According to the NASH-Clinical Research Network Scoring System [10], liver biopsy specimens were assessed for steatosis (grades 0 to 3), ballooning (grades 0 to 2) and lobular inflammation (grades 0 to 3). Then, they were used to calculate the NAFLD activity score (NAS) by the unweighted sum [10]. Liver fibrosis was assessed (grades 0 to 4) according to the Brunt's histologic criteria [21].
18F-FDG PET/CT scans
All participants were required to fast for at least 6 hours and the levels of serum glucose were less than 110 mg/dL before the 18F-FDG PET/CT scan. PET/CT images were acquired by a hybrid PET/CT scanner (GEMINI TF 64, Philips). For attenuation correction, a low-dose plain CT scan was performed from the skull base to the middle of thigh, with the following parameters: tube voltage=120 kV, tube current=249 mA, detector collimation=64 × 0.625 mm, pitch=0.829, tube rotation time=0.5 sec, slice thickness=5.0 mm. A three-dimension mode PET scan was performed approximately 1 hour later, after intravenous injection of 18F-FDG with a dose of 3.7 MBq/kg. The PET scan parameters were as follows: field of view (FOV) of 576 mm, matrix of 144 × 144, slice thickness and interval of 5.0 mm. The PET images were reconstructed using the ordered subset expectation maximization (OSEM) method (33 subsets per iteration). All collected data were transferred into Philips Extend Brilliance Workstation 3.0 to reconstruct PET, CT, and PET/CT fusion images, respectively.
Radiomics features: extraction and selection
The whole process of radiomics features extraction was performed by the LIFEx version 6.30 software (http://www.lifexsoft.org) based on standardized practices [22]. The PET images were imported into the software in the DICOM format. A whole liver region of interest (ROI) was manually drawn at the level of porta hepatis for each subject, by two radiologists in consensus (ZWC and YFZ, both with more than 7 years of experience), who were blinded to the clinical data. If there was any distinguishable abnormal lesion on the plain CT or PET images that would affect the results of radiomics analysis, the ROI slice of PET was moved up or down until there was no distinguishable abnormal lesion. Then, the images were handled by spatial resampling (to a voxel size of 4×4×4mm), intensity discretization (with 64 of grey levels and 0.3125 of bins) and intensity rescaling (the absolute method with min bound of 0 and max bound of 20). Finally, the software program calculates and extracts 60 PET 2D radiomics features automatically, including conventional indices, discretized indices, first order features, grey-level zone length matrix (GLZLM), grey-level run length matrix (GLRLM), neighborhood grey-level difference matrix (NGLDM) and grey-level co-occurrence matrix (GLCM) (Table S1). Another radiologist (KT, with more than 15 years of experience), who was blinded to the results of the first two radiologists, repeated all ROI identifications and feature extractions, as described above, for the assessment of inter-observer agreement.
Before feature selection, all of the extracted radiomics features were z-score standardized. The event per variable (EPV), defined by the ratio of the number of observations in the smaller of the two outcome groups relative to the number of variables, is a key factor for obtaining robust performance of prediction models. Lower EPV values in prediction model development are associated with poorer predictive performance [23, 24]. According to an acceptable event per variable (EPV) value of 5 reported by previous studies [25], the method of max-relevance and min-redundancy (mRMR) [26] was used to select a subset of two features with mostly related to the output classes and low redundancy between them for further logistic regression. In addition, we also developed Support Vector Machine (SVM), Naive Bayes, 5-Nearest Neighbor and linear discriminant analysis models to classify each study participant based on the two selected features, respectively.
Statistical analysis
All the statistical tests were performed in SPSS version 22 (IBM Corp.) and R version 3.6.3 (http://www.r-project.org/). Continuous variables were expressed as means ± standard deviation (SD) or medians with inter-quartile ranges. Categorical variables were expressed as numbers (and percentages). For all models, the prediction probability ≥0.5 was as a positive prediction outcome, otherwise was negative. The receiver operator characteristic (ROC) curve analysis was used for the binary classification and the area under ROC curve (AUROC), accuracy, sensitivity, specificity, as well as positive predictive value (PPV), negative predictive value (NPV), positive likelihood ratio (PLR), negative likelihood ratio (NLR) and diagnostic odds ratio were calculated to assess the predictive performance. The logistic regression model calibration was assessed by the Hosmer-Lemeshow goodness of fit test. Kappa statistics were generated to assess the inter-observer agreement. A two-sided p-value less than 0.05 was considered to be statistically significant for all statistical tests.
Results
Patients' characteristics
Table 1 summarizes the baseline characteristics of individuals with biopsy-proven MAFLD, stratified by presence or absence of any histological stage of liver fibrosis. The mean (SD) age of the subjects was 38.5 (10.4) years and 17 of them were men. All the time-intervals between liver biopsy and PET/CT were less than 3 months. Among the 12 participants with liver fibrosis on liver biopsy, 10 subjects had F1 fibrosis and 2 subjects had F2 fibrosis. None of them had F3 or F4 fibrosis. As shown in the table, no significant differences were found in age, sex, metabolic comorbidities, laboratory parameters, as well as liver histology features (steatosis grade, ballooning grade, and lobular inflammation grade) between MAFLD subjects with and without fibrosis.
Baseline characteristics of individuals with MAFLD stratified by the presence of any histological stage of fibrosis
| With fibrosis (n=12) | Without fibrosis (n=10) | p-value | |
|---|---|---|---|
| Demographics | |||
| Age, years | 37.7 ± 9.4 | 38.8 ± 11.4 | 0.794 |
| Male sex, n (%) | 11 (91.7%) | 6 (60.0%) | 0.135 |
| Metabolic comorbidities | |||
| Type 2 diabetes, n (%) | 1 (8.3%) | 2 (20.0%) | 0.571 |
| Hypertension, n (%) | 2 (16.7%) | 1 (10.0%) | 0.999 |
| BMI, kg/m2 | 27.1 ± 3.3 | 27.8 ± 2.4 | 0.576 |
| Laboratory parameters | |||
| Alanine aminotransferase, IU/L | 127.2 ± 71.4 | 88.1 ± 52.6 | 0.167 |
| Aspartate aminotransferase, IU/L | 60.7 ± 26.8 | 48.8 ± 20.9 | 0.267 |
| γ-glutamyltranspeptidase, IU/L | 89.5 ± 50.6 | 59.6 ± 38.3 | 0.140 |
| Albumin, g/L | 48.2 ± 3.7 | 48.2 ± 4.0 | 0.994 |
| Total bilirubin, μmol/L | 13.7 ± 3.23 | 12.2 ± 3.0 | 0.290 |
| Fasting glucose, mmol/L | 5.1 (4.8-5.9) | 5.3 (5.1-5.6) | 0.628 |
| Fasting insulin, pmol/L | 112.4 (71.7-211.1) | 96.8 (78.4-325.5) | 0.923 |
| Glycosylated hemoglobin, mmol/mol | 36 (33-46) | 37 (32-42) | 0.539 |
| Total cholesterol, mmol/L | 5.0 ± 1.5 | 5.6 ± 1.6 | 0.384 |
| Triglycerides, mmol/L | 2.0 ± 1.1 | 2.1 ± 1.1 | 0.868 |
| HDL-cholesterol, mmol/L | 1.0 ± 0.2 | 1.1 ± 0.2 | 0.059 |
| LDL-cholesterol, mmol/L | 3.2 ± 1.1 | 3.5 ± 1.2 | 0.567 |
| Liver histology features | |||
| Steatosis grade, n (%) | 0.091 | ||
| S1 | 2 (16.7%) | 4 (40.0%) | |
| S2 | 8 (66.7%) | 2 (20.0%) | |
| S3 | 2 (16.7%) | 4 (40.0%) | |
| Ballooning grade, n (%) | 0.065 | ||
| B0 | 0 (0.0%) | 3 (30.0%) | |
| B1 | 7 (58.3%) | 6 (60.0%) | |
| B2 | 5 (41.7%) | 1 (10.0%) | |
| Lobular inflammation grade, n (%) | 0.107 | ||
| L0 | 0 (0.0%) | 3 (30.0%) | |
| L1 | 9 (75.0%) | 4 (40.0%) | |
| L2 | 3 (25.0%) | 3 (30.0%) | |
| L3 | 0 (0.0%) | 0 (0.0%) |
Note: Continuous variables were expressed as means ± standard deviation or medians with interquartile ranges. Categorical variables were expressed as number (percentages).
Development of radiomics models
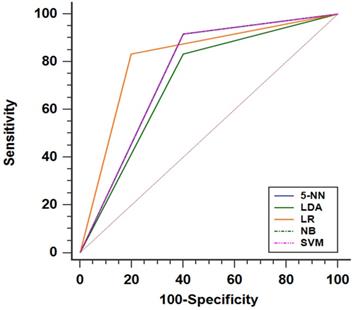
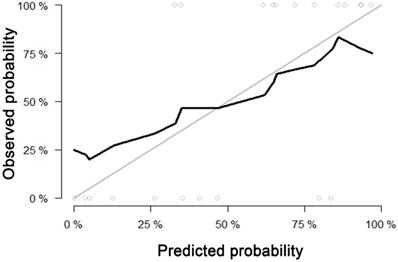
For predicting liver fibrosis in MAFLD, the coarseness of NGLDM and long-run emphasis (LRE) of GLRLM were selected for logistic regression to build the predictive model. The logistic regression model showed a good dichotomous prediction for fibrosis of any stage with an AUROC of 0.817 [95% confidence interval (CI), 0.595-0.947], sensitivity of 83.3%, specificity of 80%, and accuracy of 81.8%, respectively (Table 2). The ROC for predicting liver fibrosis is shown in Fig. 1. The Hosmer-Lemeshow goodness of fit showed a good calibration (p=0.472) (Fig. 2). The inter-observer agreement was excellent (Kappa coefficient=0.908).
Performance of 18F-FDG PET radiomics for diagnosing any stage of liver fibrosis, in different models, in biopsy-proven MAFLD
| LR | SVM | NB | 5-NN | LDA | |
|---|---|---|---|---|---|
| AUROC (95%CI) | 0.817 (0.595-0.947) | 0.758 (0.531-0.913) | 0.758 (0.531-0.913) | 0.758 (0.531-0.913) | 0.717 (0.487-0.886) |
| Sensitivity, % (n/N) | 83.3 (10/12) | 91.7 (11/12) | 91.7 (11/12) | 91.7 (11/12) | 83.3 (10/12) |
| Specificity, % (n/N) | 80.0 (8/10) | 60.0 (6/10) | 60. 0 (6/10) | 60.0 (6/10) | 60.0 (6/10) |
| Accuracy, % (n/N) | 81.8 (18/22) | 77.3 (17/22) | 77.3 (17/22) | 77.3 (17/22) | 72.7 (16/22) |
| PPV, % (n/N) | 83.3 (10/12) | 73.3 (11/15) | 73.3 (11/15) | 73.3 (11/15) | 71.4 (10/14) |
| NPV, % (n/N) | 80.0 (8/10) | 85.7 (6/7) | 85.7 (6/7) | 85.7 (6/7) | 75.0 (6/8) |
| PLR | 4.17 | 2.29 | 2.29 | 2.29 | 2.08 |
| NLR | 0.21 | 0.14 | 0.14 | 0.14 | 0.28 |
| Diagnostic odds ratio | 19.9 | 16.4 | 16.4 | 16.4 | 7.4 |
Abbreviations: 18F-FDG, fluorine-18-fluorodeoxyglucose; PET, positron emission tomography; MAFLD, metabolic dysfunction-associated fatty liver disease; LR: logistic regression; SVM: Support Vector Machine; NB: Naive Bayes; 5-NN: 5-Nearest Neighbor; LDA: linear discriminant analysis; AUROC, area under the receiver operating characteristic curve; CI, confidence interval; PPV, positive predictive value; NPV, negative predict value; PLR, positive likelihood ratio; NLR, negative likelihood ratio.
The performances of radiomics based on 18F-FDG PET models for predicting liver fibrosis (of any stage) presented as ROC curve. Note: The SVM, NB and 5-NN models had the same ROC performance. Abbreviations: LR: logistic regression; SVM: Support Vector Machine; NB: Naive Bayes; 5-NN: 5-Nearest Neighbor; LDA: linear discriminant analysis.
Calibration curve of the model built by logistic regression for predicting fibrosis. Calibration curve depict the calibration of model in terms of the agreement between the predicted probability and observed probability. The black solid line represents the performance of the model, which was closer to the diagonal grey solid line represents a better prediction. The Hosmer-Lemeshow test yielded a non-significant statistics for the model (p= 0.472), which suggested that there was no departure from perfect fit.
The SVM, Naive Bayes and 5-Nearest Neighbor models yielded the same performance, showing a slightly worse prediction for fibrosis than the logistic regression model with an AUROC of 0.758 [95% CI, 0.531-0.913], sensitivity of 91.7%, specificity of 60.0%, and accuracy of 77.3%. The linear discriminant analysis model performed worst compared with the others. The linear discriminant analysis model AUROC, sensitivity, specificity and accuracy were 0.717 (95%CI, 0.487-0.886), 83.3%, 60% and 72.7%, respectively (Fig. 1 and Table 2). Comparing the results obtained from the two sets of ROIs, the 5-Nearest Neighbor and linear discriminant analysis models showed perfect inter-observer agreements (both Kappa coefficients=0.999), and the SVM and Naive Bayes models also showed excellent inter-observer agreements (both Kappa coefficients=0.908).
Discussion
In this pilot study, we found that radiomics based on 18F-FDG PET can be used with good diagnostic performance to diagnose the presence of early liver fibrosis in MAFLD. To our knowledge, this is the first study to use radiomics based on 18F-FDG PET to diagnose liver fibrosis in people with histologically proven MAFLD.
In contrast to other imaging techniques (CT, MRI and ultrasonography), PET can evaluate physiological and biochemical changes in cell metabolism in living tissues or organs in physiological states and diseases; noninvasively, dynamically and quantitatively at a molecular level. Previous small studies have shown the usefulness of 18F-FDG PET in some chronic liver diseases. In particular, the mean SUV was found to be significantly lower in patients with cirrhosis than in healthy controls [27], and collagen fiber deposition reduced the intrahepatic blood flow [28], thus leading to a decrease in 18F-FDG uptake. Experimentally, Pan et al. [29] combined 18F-FDG PET and gadolinium-ethoxybenzyl-diethylenetriamine-pentaacetic acid (Gd-EOB-DTPA) enhanced MRI to stage liver fibrosis in animal models by intraperitoneal injection of CCl4. These investigators found that the mean SUV value of 18F-FDG alone identified severe fibrosis, but did not distinguish between mild fibrosis and no fibrosis. Combining 18F-FDG PET and Gd-EOB-DTPA enhanced MRI had good accuracy for differentiating between fibrosis and no fibrosis, which was slightly lower than the performance of the model developed in this study (AUC ~0.80 vs. 0.82) [29]. Unfortunately, due to the limited sample size of our pilot study, we did not develop a model to differentiate different fibrosis stages further as most of our MAFLD patients had F1 fibrosis.
MAFLD shows some heterogeneity [11]. Mean SUV and maximum SUV are the most commonly used parameters with PET. However, mean SUV is influenced by hepatic fat content and the maximum SUV does not take into account the heterogeneity of the disease. Keramida et al. [30] suggested that the coefficient of variation of the regional ratio of maximum SUV to mean SUV may be a marker of hepatic fat distribution heterogeneity. Besides, it has also been established that radiomics is a powerful tool for the assessment of disease heterogeneity [31]. In our study, the coarseness of NGLDM and LRE of GLRLM were selected to build the best predictive model. All of the features can reflect the distribution or adjacent relationships of pixels in the images. By describing the heterogeneity of pixels on the image, we may be able to understand the heterogeneity of liver histological characteristics but further work in this area is needed.
In this pilot study, whole liver ROIs were manually drawn by hand for analysis. Although manual delineation may be subjective, the liver is well circumscribed, which limits subjective differences between individuals and it is noteworthy that there was an excellent inter-observer agreement in our study. For a fixed size ROI, the size of the ROI will affect the extracted features, and the optimal size is not known. Thus, the size and placement of fixed ROIs may introduce more subjectivity and selection bias, due to the heterogeneity of liver histological characteristics in MAFLD. Nevertheless, it would have been preferable to have an accurate automatic segmentation method rather than the manual method used in our pilot study.
The small sample size of the study is the most important limitation of our pilot study, which may introduce bias and limits power. However, to our knowledge, this study is the first study to date to assess the performance of 18FDG PET-based radiomics for predicting liver fibrosis in individuals with MAFLD. In contrast to some previous studies that used ultrasonography or other imaging techniques for diagnosing MAFLD [32, 33], the most important strength of our study is that the diagnosis and staging of MAFLD was based on liver biopsy and we have identified a substantial number of subjects with early liver fibrosis (stage F1). Our results suggest the feasibility of PET for predicting early liver fibrosis in MAFLD but further studies are needed in this research field. Due to the small sample size of the study, no validation was conducted. However, because of the influence of EPV, we limited the number of selected features to make our predictive model as stable as possible, although that needs to be verified in further studies. We chose the mRMR method in order to control the number of selected features rather than other selection methods, e.g. the least absolute shrinkage and selection operator. Although the developed model in our pilot study may not be optimal, the results suggest that radiomics-based 18F-FDG PET may be a promising tool for the assessment of early liver fibrosis in MAFLD.
In conclusion, the results of this pilot study suggest that 18F-FDG PET radiomics may offer a potential tool for the assessment of early liver fibrosis in individuals with biopsy-proven MAFLD, which is worthy to be further evaluation in larger multicenter studies in different ethnic groups.
Abbreviations
ALT: alanine aminotransferase; AST: aspartate aminotransferase; AUROC: area under ROC curve; CT: computed tomography; CI: confidence interval; EPV: event per variable; 18F-FDG: 18F-fluorodeoxyglucose; FOV: field of view; GLCM: grey-level co-occurrence matrix; GLRLM: grey-level run length matrix; GLZLM: grey-level zone length matrix; MAFLD: metabolic dysfunction-associated fatty liver disease; MRI: magnetic resonance imaging; mRMR: max-relevance and min-redundancy; NAFLD: non-alcoholic fatty liver disease; NAS: NAFLD activity score; NGLDM: neighborhood grey-level difference matrix; OSEM: ordered subset expectation maximization; PET: positron emission tomography; ROC: receiver operator characteristic; ROI: region of interest; SUV: standardized uptake value; SVM: Support Vector Machine; T2DM: type 2 diabetes mellitus.
Supplementary Material
Supplementary table.
Acknowledgements
Funding sources
This work was supported by grants from the National Natural Science Foundation of China (82070588), High Level Creative Talents from Department of Public Health in Zhejiang Province (S2032102600032), Project of New Century 551 Talent Nurturing in Wenzhou. GT is supported in part by grants from the University School of Medicine of Verona, Verona, Italy. CDB is supported in part by the Southampton NIHR Biomedical Research Centre (IS-BRC-20004), UK.
Author Contributions
Zhong-Wei Chen and Ming-Hua Zheng conceived and designed the project. Kun Tang, Liang-Jie Tang, Gang Li, Yang-Zong Chen, Ou-Yang Huang and Xiang-Wu Zheng collected the data. Xiao-Dong Wang, Zhong-Wei Chen and You-Fan Zhao analysed and interpreted the data. Zhong-Wei Chen and Ming-Hua Zheng drafted the manuscript and Giovanni Targher and Christopher D. Byrne revised it critically. All authors read and approved the final manuscript.
Competing Interests
The authors have declared that no competing interest exists.
References
1. Younossi Z, Anstee QM, Marietti M, Hardy T, Henry L, Eslam M. et al. Global burden of NAFLD and NASH: trends, predictions, risk factors and prevention. Nature reviews Gastroenterology & hepatology. 2018;15:11-20
2. Zheng KI, Fan JG, Shi JP, Wong VW, Eslam M, George J. et al. From NAFLD to MAFLD: a "redefining" moment for fatty liver disease. Chinese medical journal. 2020;133:2271-3
3. Eslam M, Sanyal AJ, George J. MAFLD: A Consensus-Driven Proposed Nomenclature for Metabolic Associated Fatty Liver Disease. Gastroenterology. 2020;158:1999-2014.e1
4. McPherson S, Hardy T, Henderson E, Burt AD, Day CP, Anstee QM. Evidence of NAFLD progression from steatosis to fibrosing-steatohepatitis using paired biopsies: implications for prognosis and clinical management. J Hepatol. 2015;62:1148-55
5. Lee UE, Friedman SL. Mechanisms of hepatic fibrogenesis. Best practice & research Clinical gastroenterology. 2011;25:195-206
6. Hernandez-Gea V, Friedman SL. Pathogenesis of liver fibrosis. Annual review of pathology. 2011;6:425-56
7. Angulo P, Kleiner DE, Dam-Larsen S, Adams LA, Bjornsson ES, Charatcharoenwitthaya P. et al. Liver Fibrosis, but No Other Histologic Features, Is Associated With Long-term Outcomes of Patients With Nonalcoholic Fatty Liver Disease. Gastroenterology. 2015;149:389-97.e10
8. Ekstedt M, Hagström H, Nasr P, Fredrikson M, Stål P, Kechagias S. et al. Fibrosis stage is the strongest predictor for disease-specific mortality in NAFLD after up to 33 years of follow-up. Hepatology (Baltimore, Md). 2015;61:1547-54
9. Hagström H, Nasr P, Ekstedt M, Hammar U, Stål P, Hultcrantz R. et al. Fibrosis stage but not NASH predicts mortality and time to development of severe liver disease in biopsy-proven NAFLD. J Hepatol. 2017;67:1265-73
10. Kleiner DE, Brunt EM, Van Natta M, Behling C, Contos MJ, Cummings OW. et al. Design and validation of a histological scoring system for nonalcoholic fatty liver disease. Hepatology (Baltimore, Md). 2005;41:1313-21
11. Ratziu V, Charlotte F, Heurtier A, Gombert S, Giral P, Bruckert E. et al. Sampling variability of liver biopsy in nonalcoholic fatty liver disease. Gastroenterology. 2005;128:1898-906
12. Alavi A, Kung JW, Zhuang H. Implications of PET based molecular imaging on the current and future practice of medicine. Seminars in nuclear medicine. 2004;34:56-69
13. Verloh N, Einspieler I, Utpatel K, Menhart K, Brunner S, Hofheinz F. et al. In vivo confirmation of altered hepatic glucose metabolism in patients with liver fibrosis/cirrhosis by (18)F-FDG PET/CT. EJNMMI research. 2018;8:98
14. Hernandez-Martinez A, Marin-Oyaga VA, Salavati A, Saboury B, Codreanu I, Lam MG. et al. Quantitative assessment of global hepatic glycolysis in patients with cirrhosis and normal controls using 18F-FDG-PET/CT: a pilot study. Annals of nuclear medicine. 2014;28:53-9
15. Eriksen PL, Thomsen KL, Larsen LP, Grønbaek H, Vilstrup H, Sørensen M. Non-alcoholic steatohepatitis, but not simple steatosis, disturbs the functional homogeneity of the liver - a human galactose positron emission tomography study. Aliment Pharmacol Ther. 2019;50:84-92
16. Lambin P, Rios-Velazquez E, Leijenaar R, Carvalho S, van Stiphout RG, Granton P. et al. Radiomics: extracting more information from medical images using advanced feature analysis. European journal of cancer (Oxford, England: 1990). 2012;48:441-6
17. Homayounieh F, Saini S, Mostafavi L, Doda Khera R, Sühling M, Schmidt B. et al. Accuracy of radiomics for differentiating diffuse liver diseases on non-contrast CT. International journal of computer assisted radiology and surgery. 2020;15:1727-36
18. Park HJ, Lee SS, Park B, Yun J, Sung YS, Shim WH. et al. Radiomics Analysis of Gadoxetic Acid-enhanced MRI for Staging Liver Fibrosis. Radiology. 2019;290:380-7
19. Boursier J, Vergniol J, Guillet A, Hiriart JB, Lannes A, Le Bail B. et al. Diagnostic accuracy and prognostic significance of blood fibrosis tests and liver stiffness measurement by FibroScan in non-alcoholic fatty liver disease. J Hepatol. 2016;65:570-8
20. Chan WK, Nik Mustapha NR, Mahadeva S. A novel 2-step approach combining the NAFLD fibrosis score and liver stiffness measurement for predicting advanced fibrosis. Hepatology international. 2015;9:594-602
21. Brunt EM, Janney CG, Di Bisceglie AM, Neuschwander-Tetri BA, Bacon BR. Nonalcoholic steatohepatitis: a proposal for grading and staging the histological lesions. The American journal of gastroenterology. 1999;94:2467-74
22. Nioche C, Orlhac F, Boughdad S, Reuzé S, Goya-Outi J, Robert C. et al. LIFEx: A Freeware for Radiomic Feature Calculation in Multimodality Imaging to Accelerate Advances in the Characterization of Tumor Heterogeneity. Cancer research. 2018;78:4786-9
23. Steyerberg EW, Eijkemans MJ, Harrell FE Jr, Habbema JD. Prognostic modeling with logistic regression analysis: in search of a sensible strategy in small data sets. Medical decision making: an international journal of the Society for Medical Decision Making. 2001;21:45-56
24. Harrell FE Jr, Lee KL, Mark DB. Multivariable prognostic models: issues in developing models, evaluating assumptions and adequacy, and measuring and reducing errors. Statistics in medicine. 1996;15:361-87
25. Vittinghoff E, McCulloch CE. Relaxing the rule of ten events per variable in logistic and Cox regression. American journal of epidemiology. 2007;165:710-8
26. Jain A, Zongker D. Feature selection: evaluation, application, and small sample performance. IEEE transactions on pattern analysis and machine intelligence. 1997;19:153-8
27. Yue X, Wang J, Ye F, Xiao D. Mean standardized uptake value (SUVmean) and global hepatic glycolysis as potential imaging markers reflecting hepatic functional capacity: evidence from 18F-FDG PET/CT. Hippokratia. 2018;22:122-6
28. Lutz HH, Gassler N, Tischendorf FW, Trautwein C, Tischendorf JJ. Doppler ultrasound of hepatic blood flow for noninvasive evaluation of liver fibrosis compared with liver biopsy and transient elastography. Digestive diseases and sciences. 2012;57:2222-30
29. Pan S, Wang L, Xin J. Combining (18)F-FDG PET and Gd-EOB-DTPA-enhanced MRI for staging liver fibrosis. Life sciences. 2021;269:119086
30. Keramida G, Hunter J, Dizdarevic S, Peters AM. Heterogeneity of intrahepatic fat distribution determined by (18)F-FDG PET and CT. Annals of nuclear medicine. 2016;30:200-6
31. Wei J, Jiang H, Gu D, Niu M, Fu F, Han Y. et al. Radiomics in liver diseases: Current progress and future opportunities. Liver international: official journal of the International Association for the Study of the Liver. 2020;40:2050-63
32. Dostbil Z, Varoğlu E, Serdengeçti M, Kaya B, Onder H, Sari O. Evaluation of hepatic metabolic activity in non-alcoholic fatty livers on 18FDG PET/CT. Revista espanola de medicina nuclear e imagen molecular. 2013;32:156-61
33. Hu L, Shao X, Qiu C, Shao X, Wang X, Niu R. et al. Hepatic steatosis is associated with abnormal hepatic enzymes, visceral adiposity, altered myocardial glucose uptake measured by (18)F-FDG PET/CT. BMC endocrine disorders. 2020;20:75
Author contact
![]() Corresponding authors: Ming-Hua Zheng, MD, PhD, NAFLD Research Center, Department of Hepatology, the First Affiliated Hospital of Wenzhou Medical University; No. 2 Fuxue Lane, Wenzhou 325000, China. E-mail: zhengmhedu.cn; fax: (86) 577-55578522; Tel.: (86) 577-55579611. Xiang-Wu Zheng, MD, Department of Radiology, the First Affiliated Hospital of Wenzhou Medical University; No. 2 Fuxue Lane, Wenzhou 325000, China. E-mail: zxwu111com.
Corresponding authors: Ming-Hua Zheng, MD, PhD, NAFLD Research Center, Department of Hepatology, the First Affiliated Hospital of Wenzhou Medical University; No. 2 Fuxue Lane, Wenzhou 325000, China. E-mail: zhengmhedu.cn; fax: (86) 577-55578522; Tel.: (86) 577-55579611. Xiang-Wu Zheng, MD, Department of Radiology, the First Affiliated Hospital of Wenzhou Medical University; No. 2 Fuxue Lane, Wenzhou 325000, China. E-mail: zxwu111com.