Impact Factor ISSN: 1449-1907

 Global reach, higher impact
Int J Med Sci 2021; 18(15):3470-3477. doi:10.7150/ijms.63180 This issue Cite
Research Paper
Sex Difference in the Associations among Obesity-Related Indices with Metabolic Syndrome in Patients with Type 2 Diabetes Mellitus
Hsiu-Fen Jao1, Chih-Hsuan Wung2, Hui-Chen Yu3, Mei-Yueh Lee4,8, Po-Chih Chen1,5, Szu-Chia Chen6,7,8 ![]() , Jer-Ming Chang1,7,8
, Jer-Ming Chang1,7,8 ![]()
1. Department of Laboratory Medicine, Kaohsiung Medical University Hospital, Kaohsiung Medical University, Kaohsiung, Taiwan.
2. Department of post baccalaureate medicine, Kaohsiung Medical University, Kaohsiung, Taiwan.
3. Department of Medical Imaging, Kaohsiung Medical University Hospital, Kaohsiung Medical University, Kaohsiung, Taiwan.
4. Division of Endocrinology and Metabolism, Department of Internal Medicine, Kaohsiung Medical University Hospital, Kaohsiung Medical University, Kaohsiung, Taiwan.
5. Department of Medical Laboratory Science and Biotechnology, College of Health Sciences, Kaohsiung Medical University, Kaohsiung, Taiwan.
6. Department of Internal Medicine, Kaohsiung Municipal Siaogang Hospital, Kaohsiung Medical University, Kaohsiung, Taiwan.
7. Division of Nephrology, Department of Internal Medicine, Kaohsiung Medical University Hospital, Kaohsiung Medical University, Kaohsiung, Taiwan.
8. Faculty of Medicine, College of Medicine, Kaohsiung Medical University, Kaohsiung, Taiwan.
Received 2021-5-26; Accepted 2021-7-29; Published 2021-8-13
Abstract

Background: The aim of this study was to investigate the associations among obesity-related indices and MetS in diabetic patients, and explore sex differences in these associations.
Methods: Patients with type 2 DM were included from two hospitals in southern Taiwan. The Adult Treatment Panel III criteria for an Asian population were used to define MetS. In addition, the following obesity-related indices were evaluated: waist-to-height ratio, waist-hip ratio (WHR), conicity index (CI), body mass index (BMI), body roundness index, body adiposity index, lipid accumulation product (LAP), abdominal volume index, visceral adiposity index (VAI), abdominal volume index and triglyceride-glucose index.
Results: A total of 1,872 patients with type 2 DM (mean age 64.0 ± 11.3 years, 808 males and 1,064 females) were enrolled. The prevalence rates of MetS were 59.8% and 76.4% in the males and female (p < 0.001), respectively. All of the obesity-related indices were associated with MetS in both sex (all p < 0.001). LAP and BMI had the greatest areas under the receiver operating characteristic curves in both sex. In addition, the interactions between BMI and sex (p = 0.036), WHR and sex (p = 0.016), and CI and sex (p = 0.026) on MetS were statistically significant.
Conclusions: In conclusion, this study demonstrated significant relationships between obesity-related indices and MetS among patients with type 2 DM. LAP and VAI were powerful predictors in both sex. The associations of BMI, WHR and CI on MetS were more significant in the men than in the women.
Keywords: sex difference, obesity-related indices, metabolic syndrome, diabetes mellitus
Introduction
Metabolic syndrome (MetS) is a cluster of metabolic abnormalities including hypertension, insulin resistance (IR) and dyslipidemia [1], with an estimated global prevalence of around 25% [2]. In Taiwan, the age-standardized prevalence according to the modified criteria for Asians is 16.4% [3]. MetS has been reported to double the risk of atherosclerotic cardiovascular disease and increase the risk of type 2 diabetes mellitus (DM) by five-fold in patients without diabetes [4]. In addition, prospective observational studies have demonstrated a strong association between MetS and the incidence of type 2 DM [5]. In China and Ghana, 72.5% and 55.9% of patients with type 2 DM have been reported to have MetS, respectively [6, 7]. Patients with the presence of both type 2 DM and MetS have been reported to be at a significant risk of developing cardiovascular complications [8]. Moreover, MetS may be involved in the pathogenesis of both macro- and microvascular complications of DM [9].
Anthropometric indices such as waist-to-height ratio (WHtR), waist-hip ratio (WHR), conicity index (CI), body mass index (BMI), body roundness index (BRI), body adiposity index (BAI), lipid accumulation product (LAP), abdominal volume index (ABSI), visceral adiposity index (VAI), abdominal volume index (AVI) and triglyceride-glucose index (TyG) can easily be calculated and quantified using factors such as triglycerides (TGs), body height (BH), hip circumference (HC), waist circumference (WC) and body weight (BW) [10]. These indices have been reported to be effective indicators of MetS in non-overweight/obese adults, vegetarians and in Nigeria [11-14]. We recently identified associations between these obesity-related indices and nonalcoholic fatty liver disease and heavy metals [15, 16]. However, few studies have investigated sex differences in the relationships among MetS and these obesity-related indices in patients with diabetes. Therefore, in this study, we collected the data of more than 1,800 patients with DM in southern Taiwan to investigate the associations among obesity-related indices and MetS, and further explored sex differences in these associations.
Materials and methods
Study Patients
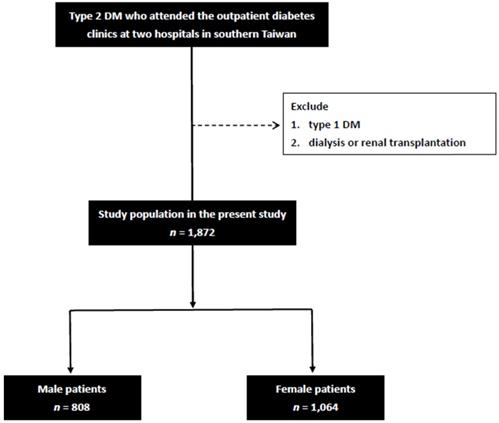
All patients with type 2 DM who attended the outpatient diabetes clinics at two hospitals in southern Taiwan were included in this study. The exclusion criteria were patients who: 1) had type 1 DM (defined as the presence of diabetic ketoacidosis, symptoms of severe hyperglycemia and ketonuria [≥3], or the continuous need for insulin in the year after the diagnosis), and 2) were receiving dialysis or had undergone a renal transplantation. Finally, 1,872 patients (mean age 64.0 ± 11.3 years, 808 males and 1,064 females) were included in this study (Figure 1). All of the included patients provided written informed consent to participate in this study, and the study protocol was approved by the Institutional Review Board of Kaohsiung Medical University Hospital. In addition, this study was conducted in accordance with the approved guidelines.
Flowchart of study population.
Collection of demographic, medical, and laboratory data
All of the patients were interviewed, and their demographic and medical data including age, sex, and co-morbidities were recorded during these interviews and from medical records. Fasting blood samples were obtained from all of the patients, and laboratory tests were conducted using an autoanalyzer (Roche Diagnostics GmbH, D-68298 Mannheim COBAS Integra 400) for fasting glucose, TGs, total cholesterol, high-density lipoprotein cholesterol [HDL-C], low-density lipoprotein cholesterol [LDL-C] and estimated glomerular filtration rate (eGFR). Serum levels of creatinine were calculated using the compensated Jaffé (kinetic alkaline picrate) method using a calibrator that could traced in isotope-dilution mass spectrometry [17]. EGFR values were calculated using the Chronic Kidney Disease Epidemiology Collaboration equation (CKD-EPI eGFR) [18]. In addition, information on the use of the following medications during the study period was also obtained from medical records: insulin, oral anti-diabetic drugs, angiotensin II receptor blockers (ARBs), angiotensin converting enzyme inhibitors (ACEIs), fibrates and statins.
Definition of MetS
The presence of MetS was defined according to the National Cholesterol Education Program Adult Treatment Panel (NCEP‑ATP) III guidelines [19] and modified criteria for Asians [20] as having three of the following five criteria: (1) elevated blood pressure (systolic blood pressure ≥ 130 mmHg, diastolic blood pressure ≥ 85 mmHg), a diagnosis of hypertension, or receiving treatment for hypertension; (2) hyperglycemia (fasting plasma glucose level ≥ 110 mg/dL or having been diagnosed with diabetes); (3) hypertriglyceridemia (TG concentration ≥ 150 mg/dL); (4) low concentration of HDL-C (< 40 mg/dL in men and < 50 mg/dL in women); and (5) abdominal obesity (WC > 90 cm in men and > 80 cm in women).
Calculation of obesity-related indices
- BMI was calculated as:
BMI = BW (kg)/BH2 (m);
- WHR was calculated as:
WHR = WC (cm)/HC (cm);
- WHtR was calculated as:
WHtR = WC (cm)/BH (cm);
- LAP was calculated as:
LAP =in males, and
LAP =in females [21]
- BRI was calculated as:
BRI =[22]
- CI was calculated using the Valdez equation based on BW, BH and WC as:
CI =[23]
- VAI was calculated as described previously [24] using the following sex-specific equations (with TG levels in mmol/l and HDL-C levels in mmol/l):
VAI =in males, and;
VAI =in females
- BAI was calculated according to the method of Bergman and colleagues as:
BAI =[25]
- AVI was calculated as:
AVI =[26]
- ABSI was calculated as:
ABSI = WC (m)/ [BMI2/3(kg/m2) × BH1/2(m)] [27]
- TyG index was calculated as:
TyG index = Ln [fasting TG (mg/dL) × fasting plasma glucose (mg/dL)/2] [28]
Statistical analysis
Statistical analysis was performed using SPSS 26.0 for Windows (SPSS Inc. Chicago, USA). Data are presented as number (percentage), mean (± standard deviation), or median (25th-75th percentile) for TGs. Differences between groups were analyzed using the independent t-test for continuous variables and chi-square test for categorical variables. Multiple logistic regression analysis was used to identify factors associated with MetS. Covariates in the multivariable model included age, systolic and diastolic blood pressures, total cholesterol, LDL-C, eGFR and medications use. An interaction p in Logistic analysis: Model disease (y)= x1 +x2 + x1*x2 +covariates x1*x2 was interaction term. In this study, y = MetS; x1 = sex; x2 = each obesity-related index; covariates = age, systolic and diastolic blood pressures, total cholesterol, LDL-C, eGFR and medications use. Receiver operating characteristic (ROC) curves and areas under the ROC curves (AUCs) were used to assess the performance and predictive ability, respectively, of the obesity-related indices in identifying MetS. A difference was considered significant if the p value was less than 0.05.
Results
A total of 1,872 patients were enrolled in this study. The mean age of the patients was 64.0 ± 11.3 years, and there were 808 males and 1,064 females. The prevalence rates of MetS were 59.8% and 76.4% in the males and females (p < 0.001), respectively.
Comparison of baseline characteristics between the patients with and without MetS
The clinical characteristics of the patients with and without MetS and by sex are compared in Table 1. Compared to the male patients without MetS, the male patients with MetS were older, had higher systolic and diastolic blood pressures, higher BH, BW, WC, HC, and TG level, and lower HDL-C and eGFR. In addition, they had higher use rates of medications including oral anti-diabetic drugs, ACEIs and/or ARBs, statins and fibrates. Regarding the obesity-related indices, the male patients with MetS had higher BMI, WHR, WHtR, LAP, BRI, CI, VAI, BAI, AVI, ABSI and TyG index. Similar results were found in the female patients, except that the female patients with MetS did not have a higher BH than those without MetS.
Clinical characteristics of the study participants classified by the presence of different sex and MetS
| Characteristics | Male (n = 808) | Female (n = 1064) | ||||
|---|---|---|---|---|---|---|
| MetS (-) (n = 325) | MetS (+) (n = 483) | p | MetS (-) (n = 251) | MetS (+) (n = 813) | p | |
| Age (year) | 61.0 ± 12.1 | 62.8 ± 10.8 | 0.034 | 60.8 ± 12.6 | 66.9 ± 12.1 | < 0.001 |
| Systolic BP (mmHg) | 126.1 ± 15.2 | 138.8 ± 18.8 | < 0.001 | 124.2 ± 14.5 | 139.5 ± 18.7 | < 0.001 |
| Diastolic BP (mmHg) | 75.6 ± 10.6 | 81.5 ± 11.5 | < 0.001 | 73.0 ± 8.9 | 78.2 ± 11.3 | < 0.001 |
| Body height (cm) | 165.1 ± 6.5 | 166.4 ± 6.0 | 0.003 | 153.9 ± 5.6 | 153.7 ± 5.5 | 0.530 |
| Body weight (Kg) | 65.1 ± 9.4 | 74.2 ± 10.1 | < 0.001 | 56.8 ± 8.4 | 63.3 ± 9.2 | < 0.001 |
| Waist circumference (cm) | 86.1 ± 7.5 | 95.4 ± 8.1 | < 0.001 | 80.8 ± 9.0 | 90.4 ± 8.6 | < 0.001 |
| Hip circumference (cm) | 95.3 ± 6.0 | 100.5 ± 7.4 | < 0.001 | 94.5 ± 7.1 | 99.8 ± 7.7 | < 0.001 |
| Laboratory parameters | ||||||
| Fasting glucose (mg/dL) | 148.6 ± 54.7 | 146.3 ± 52.3 | 0.546 | 144.6 ± 50.4 | 151.1 ± 51.0 | 0.077 |
| HbA1c (%) | 7.6 ± 1.9 | 7.7 ± 1.6 | 0.830 | 7.5 ± 1.6 | 7.7 ± 1.6 | 0.056 |
| Triglyceride (mg/dL) | 91 (68.5-120) | 158 (112-214) | < 0.001 | 92 (68-135) | 146 (106-196) | < 0.001 |
| Total cholesterol (mg/dL) | 178.0 ± 35.6 | 181.6 ± 40.8 | 0.204 | 189.1 ± 30.4 | 189.9 ± 39.4 | 0.769 |
| HDL-cholesterol (mg/dL) | 51.5 ± 11.4 | 41.9 ± 9.8 | < 0.001 | 62.9 ± 12.1 | 49.5 ± 12.2 | < 0.001 |
| LDL-cholesterol (mg/dL) | 103.8 ± 28.5 | 103.5 ± 28.4 | 0.894 | 102.6 ± 25.0 | 105.7 ± 28.9 | 0.099 |
| eGFR (mL/min/1.73 m2) | 73.3 ± 17.7 | 65.5 ± 20.3 | < 0.001 | 76.2 ± 19.8 | 65.4 ± 20.7 | < 0.001 |
| Medications | ||||||
| Oral anti-diabetic drugs (%) | 85.2 | 90.9 | 0.013 | 85.1 | 93.1 | < 0.001 |
| Insulin (%) | 37.3 | 41.2 | 0.277 | 37.5 | 41.5 | 0.261 |
| ACEI and/or ARB (%) | 57.4 | 80.2 | < 0.001 | 52.0 | 82.5 | < 0.001 |
| Statins use (%) | 48.1 | 58.0 | 0.006 | 56.0 | 66.1 | 0.004 |
| Fibrate use (%) | 4.6 | 26.6 | < 0.001 | 6.0 | 18.1 | < 0.001 |
| Obesity-related indices | ||||||
| BMI (kg/m2) | 23.8 ± 2.8 | 26.7 ± 3.2 | < 0.001 | 23.9 ± 3.3 | 26.7 ± 3.6 | < 0.001 |
| WHR | 0.90 ± 0.05 | 0.95 ± 0.05 | < 0.001 | 0.86 ± 0.07 | 0.91 ± 0.06 | < 0.001 |
| WHtR | 0.52 ± 0.05 | 0.57 ± 0.05 | < 0.001 | 0.53 ± 0.06 | 0.59 ± 0.0 | < 0.001 |
| LAP | 23.6 ± 13.3 | 64.6 ± 57.2 | < 0.001 | 24.6 ± 13.6 | 60.9 ± 39.1 | < 0.001 |
| BRI | 3.8 ± 0.9 | 4.9 ± 1.1 | < 0.001 | 3.9 ± 1.3 | 5.2 ± 1.4 | < 0.001 |
| CI | 1.26 ± 0.06 | 1.31 ± 0.06 | < 0.001 | 1.22 ± 0.09 | 1.30 ± 0.09 | < 0.001 |
| VAI | 1.1 ± 0.6 | 2.9 ± 3.3 | < 0.001 | 1.3 ± 0.7 | 3.3 ± 3.1 | < 0.001 |
| BAI | 27.0 ± 3.1 | 28.9 ± 4.0 | < 0.001 | 31.6 ± 4.1 | 34.5 ± 4.7 | < 0.001 |
| AVI | 15.0 ± 2.6 | 18.4 ± 3.2 | < 0.001 | 13.4 ± 3.0 | 16.6 ± 4.1 | < 0.001 |
| ABSI | 0.081 ± 0.004 | 0.083 ± 0.004 | < 0.001 | 0.079 ± 0.006 | 0.082 ± 0.006 | < 0.001 |
| TyG index | 8.8 ± 0.5 | 9.3 ± 0.7 | < 0.001 | 8.7 ± 0.5 | 9.3 ± 0.7 | < 0.001 |
| Components of MetS | ||||||
| Central obesity (%) | 20.4 | 77.0 | < 0.001 | 42.2 | 89.8 | < 0.001 |
| High BP (%) | 30.8 | 82.6 | < 0.001 | 21.2 | 83.4 | < 0.001 |
| Low HDL-cholesterol (%) | 6.8 | 51.3 | < 0.001 | 8.0 | 58.1 | < 0.001 |
| High triglyceride (%) | 6.5 | 55.7 | < 0.001 | 2.0 | 48.2 | < 0.001 |
Abbreviations: MetS, metabolic syndrome; BP, blood pressure; HbA1c, glycated hemoglobin A1c; HDL, high-density lipoprotein; LDL, low-density lipoprotein; eGFR, estimated glomerular filtration rate; ACEI, angiotensin converting enzyme inhibitor; ARB, angiotensin II receptor blocker; BMI, body mass index; WHR, waist-hip ratio; WHtR, waist-to-height ratio; LAP, lipid accumulation product; BRI, body roundness index; CI, conicity index; VAI, visceral adiposity index; BAI, body adiposity index; AVI, abdominal volume index; ABSI, a body shape index; TyG index, triglyceride glucose index.
Determinants of MetS
Table 2 shows the determinants of MetS in the study patients. In the male patients, after adjusting for age, systolic and diastolic blood pressures, total cholesterol, LDL-C, eGFR and medication use, high BMI (per 1 kg/m2; odds ratio [OR] = 1.382; p < 0.001), high WHR (per 0.1; OR = 7.027; p < 0.001), high WHtR (per 0.1; OR = 11.445; p < 0.001), high LAP (per 1; OR = 1.124; p < 0.001), high BRI (per 1; OR = 3.213; p < 0.001), high CI (per 0.01; OR = 1.175; p < 0.001), high VAI (per 1; OR = 9.020; p < 0.001), high BAI (per 1; OR = 1.174; p < 0.001), high AVI (per 1; OR = 1.560; p < 0.001), high ABSI (per 0.01; OR = 3.978; p < 0.001), and high TyG index (per 1; OR = 7.370; p < 0.001) were significantly associated with MetS. In the female patients, after multivariable adjustments, high BMI (per 1 kg/m2; OR = 1.273; p < 0.001), high WHR (per 0.1; OR = 3.241; p < 0.001), high WHtR (per 0.1; OR = 5.868; p < 0.001), high LAP (per 1; OR = 1.118; p < 0.001), high BRI (per 1; OR = 2.265; p < 0.001), high CI (per 0.01; OR = 1.103; p < 0.001), high VAI (per 1; OR = 6.870; p < 0.001), high BAI (per 1; OR = 1.141; p < 0.001), high AVI (per 1; OR = 1.471; p < 0.001), high ABSI (per 0.01; OR = 2.620; p < 0.001), and high TyG index (per 1; OR = 8.210; p < 0.001) were significantly associated with MetS.
Association of obesity-related indices with MetS using multivariable logistic regression analysis
| Obesity-related indices | Multivariate | Interaction p | |||||
|---|---|---|---|---|---|---|---|
| Male (n = 808) | Female (n = 1064) | ||||||
| OR | 95% confidence interval | p | OR | 95% confidence interval | p | ||
| BMI (per 1 kg/m2) | 1.382 | 1.294-1.476 | < 0.001 | 1.273 | 1.201-1.350 | < 0.001 | 0.036 |
| WHR (per 0.1) | 7.027 | 4.685-10.540 | < 0.001 | 3.241 | 2.371-4.430 | < 0.001 | 0.016 |
| WHtR (per 0.1) | 11.445 | 7.255-18.052 | < 0.001 | 5.868 | 4.101-8.397 | < 0.001 | 0.111 |
| LAP (per 1) | 1.124 | 1.103-1.145 | < 0.001 | 1.118 | 1.098-1.139 | < 0.001 | 0.666 |
| BRI (per 1) | 3.213 | 2.572-4.012 | < 0.001 | 2.265 | 1.907-2.690 | < 0.001 | 0.078 |
| CI (per 0.01) | 1.175 | 1.136-1.215 | < 0.001 | 1.103 | 1.077-1.129 | < 0.001 | 0.026 |
| VAI (per 1) | 9.020 | 6.294-12.926 | < 0.001 | 6.870 | 4.869-9.692 | < 0.001 | 0.096 |
| BAI (per 1) | 1.174 | 1.113-1.237 | < 0.001 | 1.141 | 1.093-1.190 | < 0.001 | 0.761 |
| AVI (per 1) | 1.560 | 1.442-1.688 | < 0.001 | 1.471 | 1.364-1.587 | < 0.001 | 0.470 |
| ABSI (per 0.01) | 3.978 | 2.485-6.370 | < 0.001 | 2.620 | 1.870-3.671 | < 0.001 | 0.583 |
| TyG index (per 1) | 7.370 | 5.012-10.838 | < 0.001 | 8.210 | 5.663-11.902 | < 0.001 | 0.745 |
Values expressed as odds ratio (OR) and 95% confidence interval. Abbreviations are the same as in Table 1.
Covariates in the multivariable model included age, systolic and diastolic blood pressures, total cholesterol, LDL-cholesterol, eGFR and medications use.
Interactions among sex and obesity-related indices on MetS
Analysis of the interactions among sex and the obesity-related indices on MetS is also shown in Table 2. The interactions between BMI and sex (p = 0.036), WHR and sex (p = 0.016), and CI and sex (p = 0.026) on MetS were statistically significant. However, there were no significant differences in the interactions between the other indices and sex.
ROC curve analysis for the obesity-related indices in identifying MetS
Figure 2 shows the ROC curves and AUCs of the 11 obesity-related indices in identifying MetS in the male (A) and female (B) patients. In the male patients, LAP had the greatest AUC (AUC = 0.886), followed by VAI (AUC = 0.852), AVI (AUC = 0.814), WHtR and BRI (AUC = 0.786), BMI (AUC = 0.761), WHR (AUC = 0.743), TyG index (AUC = 0.740), CI (AUC = 0.723), BAI (AUC = 0.647) and ABSI (AUC = 0.615). In the female patients, LAP also had the greatest AUC (AUC = 0.873), followed by VAI (AUC = 0.847), AVI (AUC = 0.785), WHtR and BRI (AUC = 0.781), TyG index (AUC = 0.759), BMI (AUC = 0.727), CI (AUC = 0.725), WHR (AUC = 0.717), BAI (AUC = 0.691) and ABSI (AUC = 0.659).
Comparison of the predictive value of 11 obesity-related indices for diagnosis of MetS among (A) males and (B) females.
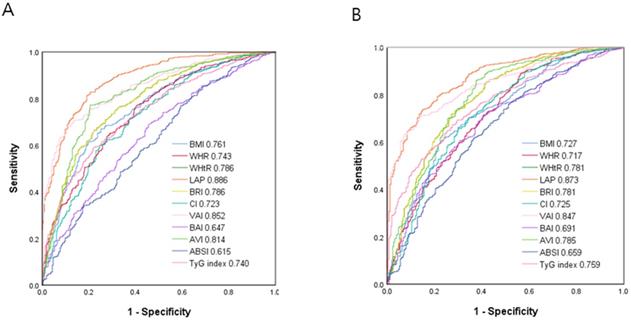
Table 3 and 4 demonstrate the ROC analysis and AUCs, cutoff values, sensitivity, specificity and Youden index of the 11 obesity-related indices for MetS in the male and female patients, respectively.
Area under curve (AUC), cutoff value, Youden index, sensitivity and specificity of 11 obesity-related indices in male patients
| Obesity-related indices | AUC (95% Confidence Interval) | Cutoff Value | Sensitivity (%) | Specificity (%) | Youden Index |
|---|---|---|---|---|---|
| BMI (kg/m2) | 0.761 (0.728-0.795)* | 25.021 | 69.2 | 69.2 | 0.384 |
| WHR | 0.743 (0.709-0.778)* | 0.929 | 67.3 | 67.4 | 0.347 |
| WHtR | 0.786 (0.754-0.818)* | 0.542 | 71.8 | 71.7 | 0.435 |
| LAP | 0.886 (0.863-0.909)* | 33.236 | 81.4 | 80.9 | 0.623 |
| BRI | 0.786 (0.754-0.818)* | 4.187 | 71.8 | 71.6 | 0.434 |
| CI | 0.723 (0.687-0.759)* | 1.286 | 65.6 | 65.6 | 0.311 |
| VAI | 0.852 (0.826-0.877)* | 1.509 | 76.2 | 76.3 | 0.525 |
| BAI | 0.647 (0.609-0.685)* | 27.563 | 60.5 | 60.0 | 0.205 |
| AVI | 0.814 (0.784-0.845)* | 16.240 | 77.4 | 77.2 | 0.564 |
| ABSI | 0.615 (0.576-0.655)* | 0.820 | 57.3 | 58.2 | 0.155 |
| TyG index | 0.740 (0.706-0.774)* | 8.988 | 67.7 | 67.1 | 0.348 |
*p < 0.001. Abbreviations are the same as in Table 1.
Area under curve (AUC), cutoff value, Youden index, sensitivity and specificity of 11 obesity-related indices in female patients
| Obesity-related indices | AUC (95% Confidence Interval) | Cutoff Value | Sensitivity (%) | Specificity (%) | Youden Index |
|---|---|---|---|---|---|
| BMI (kg/m2) | 0.727 (0.691-0.763)* | 24.969 | 67.5 | 67.6 | 0.351 |
| WHR | 0.717 (0.679-0.754)* | 0.874 | 65.3 | 64.8 | 0.301 |
| WHtR | 0.781 (0.746-0.815)* | 0.552 | 71.9 | 72.0 | 0.439 |
| LAP | 0.873 (0.850-0.896)* | 33.428 | 79.3 | 78.8 | 0.581 |
| BRI | 0.781 (0.746-0.815)* | 4.392 | 71.9 | 72.0 | 0.439 |
| CI | 0.725 (0.687-0.762)* | 1.251 | 67.0 | 67.2 | 0.342 |
| VAI | 0.847 (0.823-0.871)* | 1.643 | 76.1 | 76.0 | 0.521 |
| BAI | 0.691 (0.654-0.728)* | 32.446 | 63.4 | 63.2 | 0.266 |
| AVI | 0.785 (0.750-0.820)* | 14.527 | 72.3 | 71.2 | 0.435 |
| ABSI | 0.659 (0.619-0.698)* | 0.794 | 62.4 | 62.0 | 0.244 |
| TyG index | 0.759 (0.727-0.790)* | 8.960 | 69.3 | 70.0 | 0.393 |
*p < 0.001. Abbreviations are the same as in Table 1.
Discussion
In this study, we evaluated sex differences in the associations among various obesity-related indices and MetS in patients with type 2 DM. We found that all of the studied obesity-related indices were associated with MetS, and that the interactions between BMI, WHR, and CI and sex on MetS were statistically significant.
The first important finding of this study is that all 11 obesity-related indices (BMI, WHR, WHtR, LAP, BRI, CI, VAI, BAI, AVI, ABSI and TyG index) were associated with MetS in both sex, and that LAP and VAI were the strongest predictors of MetS in both sex. An increase in the prevalence of obesity has been reported in most Asian countries during the last two decades [29]. Several studies among different populations have shown that obesity-related indices can be used to predict MetS [11, 13, 14, 30]. Xia et al. demonstrated that LAP is a powerful marker of IR among people without diabetes [31]. In addition, two other studies found that LAP was an accurate and simple predictor of MetS in a Taiwanese population and children in China [32, 33]. We also found that LAP was a powerful predictor of MetS among patients with diabetes. In our study, we found that LAP was also associated with MetS in diabetic population. It is beneficial for LAP to predict the MetS in both diabetic and non-diabetic populations. Several potential mechanisms have been proposed for the association between visceral fat and IR. First, compared to subcutaneous fat, visceral fat has a higher rate of lipolysis. This can lead to higher levels of free fatty acids and subsequently fat accumulation in the liver, and this in turn can induce IR. Second, adipocytokines secreted by visceral fat may induce IR [34]. On the other hand, a systematic review indicated that VAI may be a useful predictor of type 2 DM in Asian populations [35]. In addition, Baveicy et al. reported that VAI was a valuable predictor of MetS [36]. The reason why VAI appears to be a good predictor of MetS may partly be because VAI is highly correlated with WC, TGs and HDL-C, three major components of MetS. Compared to MetS, the advantage of VAI is the reflection of visceral fat distribution. Although computed tomography and magnetic resonance imaging are considered gold standards for the measurement of fat distribution, it takes time and cost to acquire the information. Therefore, non-invasive and inexpensive calculation of VAI can evaluate the adiposity and MetS [11]. In addition, VAI has been shown to be inversely associated with adiponectin and highly associated with inflammatory cytokines, all of which can lead to IR [37]. Taken together, these findings indicate that LAP and VAI are excellent predictors of MetS among different populations.
The second important finding of this study is that the interactions between BMI, WHR and CI and sex on MetS were statistically significant. Moreover, these associations were more significant in the men than in the women. Numerous studies have investigated the predictive ability of obesity-related indices in identifying MetS in men and women [38-40]. However, there is currently no consensus on which obesity-related index is the most powerful predictor. It may depend on age, sex, ethnicity, or diagnostic criteria of MetS [40]. Zhang et al. demonstrated that WHtR was the best predictor of MetS in men, while WC and WHtR were equally good predictors in women [41]. In addition, Yu et al. reported that WC was a superior index for predicting MetS in men and that WHtR was superior in women [42], and Gu et al. reported that WHtR, BMI and WC had similar predictive ability to identify MetS in men [43]. Our findings indicated that the associations of BMI, WHR and CI on MetS were more significant in the men than in the women. One possible explanation is that men are more prone to accumulate fat in the abdomen, whereas women are more prone to accumulate fat in the gluteal region [44]. This difference in fat distribution can result in relatively higher WHR and CI in men compared to women. Moreover, sex hormones including estrogen and testosterone have also been associated with body fat distribution [45, 46]. Estrogen modulates lipolysis and lipogenesis mainly via estrogen receptor α, and this affects adipose tissue expansion and remodeling. Likewise, androgen modulates lipolysis by suppressing lipoprotein lipase activity and directing fat away from the gluteofemoral region. However, the detailed molecular mechanism by which sex hormones regulate body fat distribution is still unclear [47].
There are several limitations to this study. First, the study included patients with DM regardless of its duration, and the duration of DM can affect the inhomogeneity of the effects of diabetes on MetS. However, DM duration, especially in type 2 diabetes, is a very unreliable subjective statement from patients, and this can lead to bias in studies of diabetes. Nonetheless, the results may help to shed light on the importance of obesity-related indices on MetS in this population. Second, some important variables influencing MetS, such as smoking history, exercise and economic status were lacking. These factors may also be associated with the development of MetS. In addition, all of the participants in this study were recruited in Taiwan, and therefore our results may not be generalizable to other populations. Finally, this study was cross-sectional in design, and therefore we could not confirm causal relationships or long-term clinical outcomes. Further prospective studies are required to evaluate the development and progression of MetS in patients with diabetes.
In conclusion, our results demonstrated significant relationships among obesity-related indices including BMI, WHR, WHtR, LAP, BRI, CI, VAI, BAI, AVI, ABSI and TyG index, and MetS among patients with type 2 DM. Among them, LAP and VAI were the strongest predictors of MetS in both men and women. BMI, WHR and CI were associated with MetS more obviously in the men than in the women. In clinical, these obesity-related indices can be easily calculated by simple anthropometric measurements and laboratory data survey, and then used as predictive tools for MetS.
Competing Interests
The authors have declared that no competing interest exists.
References
1. Rochlani Y, Pothineni NV, Kovelamudi S, Mehta JL. Metabolic syndrome: pathophysiology, management, and modulation by natural compounds. Ther Adv Cardiovasc Dis. 2017;11:215-25
2. Saklayen MG. The Global Epidemic of the Metabolic Syndrome. Curr Hypertens Rep. 2018;20:12
3. Huang LC, Bai CH. et al. Prevalence of obesity and metabolic syndrome in Taiwan. J Formos Med Assoc. 2006;105:626-35
4. Grundy SM. Metabolic syndrome update. Trends Cardiovasc Med. 2016;26:364-73
5. Lee MK, Han K, Kim MK, Koh ES, Kim ES, Nam GE. et al. Combinations of metabolic syndrome components and the risk of type 2 diabetes mellitus: A nationwide cohort study. Diabetes Res Clin Pract. 2020;165:108237
6. Ji M, Ren D, Gary-Webb TL, Dunbar-Jacob J, Erlen JA. Characterizing a Sample of Chinese Patients With Type 2 Diabetes and Selected Health Outcomes. Diabetes Educ. 2019;45:105-15
7. Nsiah K, Shang VO, Boateng KA, Mensah FO. Prevalence of metabolic syndrome in type 2 diabetes mellitus patients. Int J Appl Basic Med Res. 2015;5:133-8
8. Ji M, Ren D, Dunbar-Jacob J, Gary-Webb TL, Erlen JA. Self-Management Behaviors, Glycemic Control, and Metabolic Syndrome in Type 2 Diabetes. Nurs Res. 2020;69(E):9-17
9. Metascreen Writing C, Bonadonna R, Cucinotta D, Fedele D, Riccardi G, Tiengo A. The metabolic syndrome is a risk indicator of microvascular and macrovascular complications in diabetes: results from Metascreen, a multicenter diabetes clinic-based survey. Diabetes Care. 2006;29:2701-7
10. Cheng CH, Ho CC, Yang CF, Huang YC, Lai CH, Liaw YP. Waist-to-hip ratio is a better anthropometric index than body mass index for predicting the risk of type 2 diabetes in Taiwanese population. Nutr Res. 2010;30:585-93
11. Wu Y, Li H, Tao X, Fan Y, Gao Q, Yang J. Optimised anthropometric indices as predictive screening tools for metabolic syndrome in adults: a cross-sectional study. BMJ Open. 2021;11:e043952
12. Adejumo EN, Adejumo AO, Azenabor A, Ekun AO, Enitan SS, Adebola OK. et al. Anthropometric parameter that best predict metabolic syndrome in South west Nigeria. Diabetes Metab Syndr. 2019;13:48-54
13. Wu L, Zhu W, Qiao Q, Huang L, Li Y, Chen L. Novel and traditional anthropometric indices for identifying metabolic syndrome in non-overweight/obese adults. Nutr Metab (Lond). 2021;18:3
14. Ching YK, Chin YS, Appukutty M, Gan WY, Chan YM. Comparisons of conventional and novel anthropometric obesity indices to predict metabolic syndrome among vegetarians in Malaysia. Sci Rep. 2020;10:20861
15. Lin IT, Lee MY, Wang CW, Wu DW, Chen SC. Gender Differences in the Relationships among Metabolic Syndrome and Various Obesity-Related Indices with Nonalcoholic Fatty Liver Disease in a Taiwanese Population. Int J Environ Res Public Health. 2021 18
16. Wen WL, Wang CW, Wu DW, Chen SC, Hung CH, Kuo CH. Associations of Heavy Metals with Metabolic Syndrome and Anthropometric Indices. Nutrients. 2020 12
17. Vickery S, Stevens PE, Dalton RN, van Lente F, Lamb EJ. Does the ID-MS traceable MDRD equation work and is it suitable for use with compensated Jaffe and enzymatic creatinine assays? Nephrol Dial Transplant. 2006;21:2439-45
18. Levey AS, Stevens LA, Schmid CH, Zhang YL, Castro AF 3rd, Feldman HI. et al. A new equation to estimate glomerular filtration rate. Annals of internal medicine. 2009;150:604-12
19. Isomaa B, Henricsson M, Almgren P, Tuomi T, Taskinen MR, Groop L. The metabolic syndrome influences the risk of chronic complications in patients with type II diabetes. Diabetologia. 2001;44:1148-54
20. Tan CE, Ma S, Wai D, Chew SK, Tai ES. Can we apply the National Cholesterol Education Program Adult Treatment Panel definition of the metabolic syndrome to Asians? Diabetes Care. 2004;27:1182-6
21. Kahn HS. The "lipid accumulation product" performs better than the body mass index for recognizing cardiovascular risk: a population-based comparison. BMC cardiovascular disorders. 2005;5:26
22. Thomas DM, Bredlau C, Bosy-Westphal A, Mueller M. Shen W, Gallagher D, et al. Relationships between body roundness with body fat and visceral adipose tissue emerging from a new geometrical model. Obesity (Silver Spring). 2013;21:2264-71
23. Valdez R. A simple model-based index of abdominal adiposity. Journal of clinical epidemiology. 1991;44:955-6
24. Amato MC, Giordano C, Galia M, Criscimanna A, Vitabile S, Midiri M. et al. Visceral Adiposity Index: a reliable indicator of visceral fat function associated with cardiometabolic risk. Diabetes Care. 2010;33:920-2
25. Bergman RN, Stefanovski D, Buchanan TA, Sumner AE, Reynolds JC, Sebring NG. et al. A better index of body adiposity. Obesity (Silver Spring, Md.). 2011;19:1083-9
26. Guerrero-Romero F, Rodríguez-Morán M. Abdominal volume index. An anthropometry-based index for estimation of obesity is strongly related to impaired glucose tolerance and type 2 diabetes mellitus. Archives of medical research. 2003;34:428-32
27. Krakauer NY, Krakauer JC. A new body shape index predicts mortality hazard independently of body mass index. PloS one. 2012;7:e39504
28. Guerrero-Romero F, Simental-Mendia LE, Gonzalez-Ortiz M, Martinez-Abundis E, Ramos-Zavala MG, Hernandez-Gonzalez SO. et al. The product of triglycerides and glucose, a simple measure of insulin sensitivity. Comparison with the euglycemic-hyperinsulinemic clamp. The Journal of clinical endocrinology and metabolism. 2010;95:3347-51
29. Gill TP. Cardiovascular risk in the Asia-Pacific region from a nutrition and metabolic point of view: abdominal obesity. Asia Pac J Clin Nutr. 2001;10:85-9
30. Seloka MA, Matshipi M, Mphekgwana PM, Monyeki KD. Obesity Indices to Use for Identifying Metabolic Syndrome among Rural Adults in South Africa. Int J Environ Res Public Health. 2020 17
31. Xia C, Li R, Zhang S, Gong L, Ren W, Wang Z. et al. Lipid accumulation product is a powerful index for recognizing insulin resistance in non-diabetic individuals. Eur J Clin Nutr. 2012;66:1035-8
32. Chiang JK, Koo M. Lipid accumulation product: a simple and accurate index for predicting metabolic syndrome in Taiwanese people aged 50 and over. BMC Cardiovasc Disord. 2012;12:78
33. Zhang Y, Hu J, Li Z, Li T, Chen M, Wu L. et al. A Novel Indicator Of Lipid Accumulation Product Associated With Metabolic Syndrome In Chinese Children And Adolescents. Diabetes Metab Syndr Obes. 2019;12:2075-83
34. Jensen MD. Adipose tissue as an endocrine organ: implications of its distribution on free fatty acid metabolism. European Heart Journal Supplements. 2006;8(B):13-19
35. Nusrianto R, Tahapary DL, Soewondo P. Visceral adiposity index as a predictor for type 2 diabetes mellitus in Asian population: A systematic review. Diabetes Metab Syndr. 2019;13:1231-5
36. Baveicy K, Mostafaei S, Darbandi M, Hamzeh B, Najafi F, Pasdar Y. Predicting Metabolic Syndrome by Visceral Adiposity Index, Body Roundness Index and a Body Shape Index in Adults: A Cross-Sectional Study from the Iranian RaNCD Cohort Data. Diabetes Metab Syndr Obes. 2020;13:879-87
37. Amato MC, Pizzolanti G, Torregrossa V, Misiano G, Milano S, Giordano C. Visceral adiposity index (VAI) is predictive of an altered adipokine profile in patients with type 2 diabetes. PLoS One. 2014;9:e91969
38. Ji XW, Feng GS, Li HL, Fang J, Wang J, Shen QM. et al. Gender differences of relationship between serum lipid indices and type 2 diabetes mellitus: a cross-sectional survey in Chinese elderly adults. Ann Transl Med. 2021;9:115
39. Yi Y, An J. Sex Differences in Risk Factors for Metabolic Syndrome in the Korean Population. Int J Environ Res Public Health. 2020;17:24
40. Liu L, Liu Y, Sun X, Yin Z, Li H, Deng K. et al. Identification of an obesity index for predicting metabolic syndrome by gender: the rural Chinese cohort study. BMC Endocr Disord. 2018;18:54
41. Zhang ZQ, Deng J, He LP, Ling WH, Su YX, Chen YM. Comparison of various anthropometric and body fat indices in identifying cardiometabolic disturbances in Chinese men and women. PLoS One. 2013;8:e70893
42. Yu J, Tao Y, Tao Y, Yang S, Yu Y, Li B. et al. Optimal cut-off of obesity indices to predict cardiovascular disease risk factors and metabolic syndrome among adults in Northeast China. BMC Public Health. 2016;16:1079
43. Gu Z, Li D, He H, Wang J, Hu X, Zhang P. et al. Body mass index, waist circumference, and waist-to-height ratio for prediction of multiple metabolic risk factors in Chinese elderly population. Sci Rep. 2018;8:385
44. Fox CS, Massaro JM, Hoffmann U, Pou KM, Maurovich-Horvat P, Liu CY. et al. Abdominal visceral and subcutaneous adipose tissue compartments: association with metabolic risk factors in the Framingham Heart Study. Circulation. 2007;116:39-48
45. Gambineri A, Pelusi C. Sex hormones, obesity and type 2 diabetes: is there a link? Endocr Connect. 2019;8(R):1-9
46. Gavin KM, Bessesen DH. Sex Differences in Adipose Tissue Function. Endocrinol Metab Clin North Am. 2020;49:215-28
47. Frank AP, de Souza Santos R, Palmer BF, Clegg DJ. Determinants of body fat distribution in humans may provide insight about obesity-related health risks. J Lipid Res. 2019;60:1710-9
Author contact
![]() Corresponding authors: Szu-Chia Chen, Department of Internal Medicine, Kaohsiung Municipal Siaogang Hospital, Kaohsiung Medical University, Kaohsiung, Taiwan. 482, Shan-Ming Rd., Hsiao-Kang Dist., 812 Kaohsiung, Taiwan, R.O.C. TEL: 886- 7- 8036783 - 3440; FAX: 886- 7- 8063346; E-mail: scarchenonecom.tw. Jer-Ming Chang, MD, PhD, Division of Nephrology, Department of Internal Medicine, Kaohsiung Medical University Hospital, Kaohsiung Medical University, Kaohsiung, Taiwan. No.100, Tzyou 1st Rd., Sanmin Dist., Kaohsiung City 80756, Taiwan (R.O.C.). TEL: 886- 7-3121101 ext. 7351; E-mail: jemichedu.tw.
Corresponding authors: Szu-Chia Chen, Department of Internal Medicine, Kaohsiung Municipal Siaogang Hospital, Kaohsiung Medical University, Kaohsiung, Taiwan. 482, Shan-Ming Rd., Hsiao-Kang Dist., 812 Kaohsiung, Taiwan, R.O.C. TEL: 886- 7- 8036783 - 3440; FAX: 886- 7- 8063346; E-mail: scarchenonecom.tw. Jer-Ming Chang, MD, PhD, Division of Nephrology, Department of Internal Medicine, Kaohsiung Medical University Hospital, Kaohsiung Medical University, Kaohsiung, Taiwan. No.100, Tzyou 1st Rd., Sanmin Dist., Kaohsiung City 80756, Taiwan (R.O.C.). TEL: 886- 7-3121101 ext. 7351; E-mail: jemichedu.tw.