Impact Factor ISSN: 1449-1907
- Issue 8; 2026
- Issue 7; 2026
- Issue 6; 2026
- Issue 5; 2026
- Issue 4; 2026
- Volume 23; 2026
- Past Issues
- Editorial Board
- Cover Images
- Index & Coverage
- Cover Suggestion
- Special Issues
Introduction
Materials and Methods
Results
Discussion
Abbreviations
Supplementary Material
Acknowledgements
References

 Global reach, higher impact
Int J Med Sci 2021; 18(14):3290-3298. doi:10.7150/ijms.62425 This issue Cite
Research Paper
Analysis of the Relationship between the Expression Levels of Neutrophil Gelatinase-Associated Lipocalin and Cytokine Genes in Bone Marrow
Sungchul Mun1#, Min-Chul Park2#, Chi-Hyun Cho3 ![]()
1. Department of Industrial Engineering, Jeonju University, 303 Cheonjam-ro, Wansan-gu, Jeonju-si, 55069, Republic of Korea;
2. Center for Opto-Electronic materials and devices, Korea Institute of Science and Technology, Seoul, Republic of Korea;
3. Department of Laboratory Medicine, College of Medicine, Korea University Ansan Hospital, 123, Jeokgeum-ro, Danwon-gu, Ansan-si, Gyeonggi-do 15355, Republic of Korea.
# These authors contributed equally to this study.
Received 2021-5-7; Accepted 2021-7-10; Published 2021-7-23
Abstract

Background: Recently, various associations of NGAL with several hematological cancers have been reported. However, given that the regulation of NGAL gene expression by cytokines is tissue-specific, NGAL expression in relation to those of cytokine genes has not been analyzed in bone marrow (BM) tissue. The purpose of this study was to analyze the association between NGAL and 48 cytokine gene expression levels in mononuclear cells (MNCs) of BM at the time of diagnosis of hematological malignancy and to explore the expression pattern of NGAL and related cytokine genes in patients with hematological malignancies and controls.
Methods: BM MNCs were isolated from 48 patients, who were classified as patients presenting myeloproliferative neoplasm, acute myeloid leukemia, myelodysplastic syndrome, and as controls. NGAL and cytokine genes were analyzed using NanoString. Data on hematological parameters were collected from medical records. Single and multiple regression analyses were performed to analyze relationships.
Results: Normalized counts of 26 cytokine genes were related to NGAL normalized counts, while STAT3 and TLR4 normalized counts had the highest explanatory power. The following multiple regression model was developed: NGAL normalized counts=4316.825 + 9.056 × STAT3 normalized counts + 844.226 × IL5 normalized counts + 17.540 × TLR1 normalized counts - 28.206 × TLR2 normalized counts - 42.524 × IRAK4 normalized counts. In the multiple regression analysis, STAT3 and TLR4 normalized counts showed multicollinearity. NGAL, STAT3, IL5, and TLR4 normalized counts showed similar intergroup patterns.
Conclusions: NGAL normalized counts was predicted by a multiple regression model, while they showed similar intergroup patterns to STAT3, IL5, and TLR4 normalized counts.
Keywords: neutrophil gelatinase associated lipocalin, cytokine, myeloproliferative neoplasm, acute myeloid leukemia, myelodysplastic syndrome, bone marrow
Introduction
Neutrophil gelatinase-associated lipocalin (NGAL), a member of the lipocalin superfamily, is a glycoprotein originally isolated from the secondary granules of human neutrophils [1]. While NGAL is useful as a biomarker especially in kidney injury, it is also expressed in other tissues in response to various pathological conditions, such as ischemia, tissue injury, and cancer [1-3]. Being a pleiotropic mediator of various inflammatory processes [4, 5], NGAL acted at different levels as a regulator of multiple responses [6]. Recently, association of NGAL with several hematologic cancers have been reported [1, 5-8].
A few studies measuring NGAL protein levels in the bone marrow (BM) of patients with hematological cancer reported that NGAL levels were significantly lower in patients with acute myeloid leukemia (AML) and myelodysplastic syndromes (MDS) than in controls [8-10]. Given that neutrophilic precursors are the major source of NGAL synthesis and these exist primarily in the BM but not the peripheral blood, such studies have enabled an accurate comparative analysis of NGAL levels according to the hematological malignant disease entity [8].
Nevertheless, NGAL expression has not been analyzed in BM aspirate cells of patients with hematological malignancies. In particular, although NGAL expression is regulated by various types of inflammatory cytokines, it should be noted that the regulation of NGAL expression is tissue-specific [1]. Accordingly, analysis of the relationship between NGAL and inflammatory cytokines in BM cells is important for elucidating the mechanism of the regulation of NGAL in the BM.
The purpose of this study was to identify the expression profile of NGAL and 48 cytokine genes in mononuclear cells (MNCs) of BM aspirate at the time of the diagnosis of a hematological malignancy using the nCounter system [11] and analyze the relationship between NGAL expression and those of 48 cytokine genes. Additionally, we explored the expression patterns of NGAL and related cytokine genes in patients with hematological malignancies and controls.
Materials and Methods
Sample collection and preparation
The study was approved by the Institutional Review Board of Korea University Ansan Hospital and performed in accordance with the Declaration of Helsinki. Patients were enrolled between May 2018 and July 2019. Informed consent was obtained from all participants (n=48). Aliquots of leftover BM aspirate samples were collected from patients who underwent BM examination for the diagnosis of hematological malignancies. Patients were classified into myeloproliferative neoplasm (MPN), AML, and MDS groups based on the WHO diagnostic criteria, after the BM smear and pathological review. The control group (n=9) consisted of patients with lymphoma without BM involvement (n=7) or normocellular marrow without hematological malignancy (n=2) [8, 9]. None of the patients manifested symptoms of active infections, inflammatory diseases, or kidney failure [7].
BM aspirates were collected in BD Vacutainer tubes (Becton Dickinson, Franklin, NJ, USA) containing EDTA and centrifuged (2399 × g, 10 min). After centrifugation, BM infranatants (including BM hematopoietic cells) were used for MNC isolation.
MNC isolation
Isolation of MNCs from BM aspirates was performed using Lymphoprep in SepMate tubes (STEMCELL Technologies, Vancouver, Canada) [12]. First, 4.5 mL of Lymphoprep (density gradient medium; density: 1.077 g/mL; STEMCELL Technologies) was added to 15 mL of SepMate tubes and pipetted through the central hole of the insert. The BM aspirate sample was diluted with an equal volume of phosphate-buffered saline (PBS) and mixed gently, then pipetted down the side of the (vertically held) tube. The tubes were then centrifuged (1200 × g, 10 min) and the top layer containing the enriched MNCs was poured into a new tube (15-mL conical polypropylene tube; Becton Dickinson), and PBS was added, resulting in a total volume of 14.5 mL. After centrifugation (300 × g, 8 min), the supernatant was carefully removed, and 2 mL of PBS was added to the infranatant (including BM MNCs). The solutions were mixed well, and the mixture was transferred to 1.5-mL Eppendorf tubes and centrifuged (400 × g, 5 min). The supernatant was then removed and the infranatant and isolated BM MNCs were stored at -80 °C until mRNA extraction.
mRNA extraction from BM MNCs
Frozen cell pellets were thawed slowly in a pre-chilled bead bath. Then, 1 mL Trizol (#79306-200mL; Qiagen, Valencia, CA, USA) was added to the thawed cell pellets. The mixture was briefly vortexed and incubated for 5 min at 20-24 °C, and 200 μL chloroform (#34854-1L; Sigma Aldrich, St. Louis, MO, USA) was added. The mixture was shaken for 15 s and incubated for 5 min at 20-24 °C. After centrifugation (13,000 × g, 15 min, 4 °C), the aqueous phase was transferred to new 1.5-mL tubes and an equal volume of isopropanol was added. The tubes were inverted manually four times, incubated at 20-24 °C for 10 min, and centrifuged (13,000 × g, 10 min, 4 °C). The supernatant was discarded. The pellets were washed twice with 1 mL of 70% ethanol and centrifuged (7,500 × g, 5 min, 4 °C). RNA pellets were air-dried. RNA was resuspended in 10-20 μL RNase-free water, transferred to new 1.5-mL tubes, and RNA quality was determined using a 2100 Bioanalyzer capillary electrophoresis system (Agilent Technologies, Santa Clara, CA).
mRNA expression analysis
Extracted RNA samples were run on an nCounter Analysis System (NanoString Technologies Inc., Seattle, WA, USA) according to the manufacturer's instructions. A cytokine panel was used, which included the following genes: BAX, BCL2L1, CASP8, CRP, CXCL1, CXCL10, CXCL2, CASPASE-1, ETS like transcription factor-1 (ELK1), FOS, IL10, IL11, IL18, IL1A, IL1B, IL1R1, IL1R2, IL2, IL28A/B, IL29, IL3, IL4, IL5, IL6, IL7, IL8, IL9, INFB, IRAK1, IRAK2, IRAK4, interferon regulatory factor 7 (IRF7), MyD88, NF-κB, NFKB1A, NGAL, NLRP3, RAGE, STAT1, STAT2, STAT3, STAT4, TLR1, TLR2, TLR4, TLR5, TNF, TRAF3, and TRAF6.
A reaction mixture containing RNA (5 μL; 100-300 ng), Master Mix (8 μL; reporter CodeSet and hybridization buffer), and capture probeSet (2 μL) was prepared, and the solution was mixed and spun down. It was incubated at 65 °C in a thermocycler (Bio-Rad Laboratories Inc., Hercules, CA, USA) for 16 h (maximum hybridization, 48 h). Samples were then transferred to the preparation station (NanoString Technologies, Inc.) with a prepared nCounter Master Kit and cartridge. After binding the sample to the cartridge, 12 lanes per run of the nCounter prep station were run for approximately 2.5‒3 h. Cartridges were transferred to the Digital Analyzer (NanoString Technologies Inc.) for analysis and scanned on a digital analyzer at 555 fields of view.
As quality checks for raw data, we confirmed the following: (i) Imaging quality control (QC): Field of View>75%; (ii) Binding Density QC: 0.1<Binding Density<2.25; (iii) Positive Control Linearity QC: R2>0.95; (iv) Limit of Detection QC: 0.5 fM positive control probe>2 standard deviation + mean of the negative controls. Data were normalized using the control probes from Codeset. Normalized expression values of NGAL and 48 cytokine genes were used for the statistical analysis.
Clinical data collection
Baseline demographic data and data about hematological parameters, including hemoglobin levels, white blood cell (WBC) counts, neutrophil and platelet counts, and C-reactive protein (CRP) levels, were collected from medical records. The estimated glomerular filtration rate (eGFR) was calculated using the Chronic Kidney Disease Epidemiology Collaboration equation.
Statistical analyses
Quantitative data are presented as median [quartile1 (Q1), Q3] values. To ascertain that the data were normally distributed, the Shapiro-Wilk test was used. For the statistical analysis of patient demographic features and laboratory parameters, either a parametric or non-parametric test was performed to obtain reliable statistical results. In general, statistical power is higher in parametric tests. However, when collected samples deviated from a normal distribution, non-parametric tests lead to stronger relative power than their parametric counterparts. Consequently, better protection against type II errors relative to parametric tests was ensured. The Kruskal-Wallis H test, a non-parametric counterpart of one-way ANOVA, was conducted on the sample data in which normality was untenable.
For pairwise comparisons when a significant difference was found among groups, Scheffé's post-hoc test or Dunn's pairwise test was applied. In the parametric post-hoc analysis, we applied Scheffé's method because the test is robust for different sample sizes between groups.
A simple regression analysis was performed to analyze the relationship between NGAL expression levels and other cytokine gene levels. Multiple regression analysis was performed to simultaneously analyze the relationship between NGAL gene counts and all statistically significant cytokine gene normalized counts.
To control the inflated Type I error caused by performing multiple comparisons and multiple simple regressions, a Benjamini-Hochberg false discovery rate (FDR) correction was applied [13-18]. The correction method adjusts the p values in a simpler but more efficient way than the traditional Bonferroni correction. The adjusted alphas were determined to be 0.018 for pairwise comparisons and 0.026 for multiple simple regressions. The procedure to determine the adjusted alpha has been detailed [13].
In the multiple regression analysis, multicollinearity was also analyzed to identify closely related independent variables. When independent variables presented variance influence factor (VIF) values>10, the independent variables were considered to have multicollinearity. The predictive accuracy of the multiple regression models was assessed using Akaike's information criterion (AIC) and adjusted R2 values. Statistical significance was set at p<0.05. Statistical analyses were performed using SPSS version v25.0 (IBM SPSS Statistics, Armonk, NY, USA).
Results
Patient characteristics
BM aspirates were collected from 48 patients with a median age of 62 years (range 22-89 years). All 48 patients were at the initial diagnosis stage. Patient demographics, hematological parameters, and normalized counts of NGAL are presented in Table 1. Six variables exhibited significant differences among the four groups. For numerical data, the significant results of the pairwise comparison tests between the groups are shown in Supplementary Table S1.
Patient demographic features and laboratory parameters of each hematological malignancy and control group (n=48)
| MPN† (n=20) | AML (n=12) | MDS (n=7) | Control‡ (n=9) | p-value* | |
|---|---|---|---|---|---|
| Gender | 10 males, 10 females | 11 males, 1 females | 2 males, 5 females | 8 males, 1 females | |
| Age | 55 (39, 63) | 59 (43, 72) | 70 (59, 81) | 63 (47, 66) | 0.335 |
| Hb (g/L) | 124 (105, 144) | 79 (69, 83) | 86 (66, 93) | 135 (131, 146) | <0.0001 |
| WBC count (109/L) | 19.31 (10.45, 107.23) | 3.37 (2.36, 9.61) | 2.38 (1.61, 3.12) | 6.22 (4.32, 7.30) | <0.0001 |
| Neutrophil count (109/L) | 14.43 (7.49, 68.80) | 0.74 (0.23, 1.65) | 0.50 (0.43, 1.09) | 3.78 (2.55, 4.31) | <0.0001 |
| Platelet count (109/L) | 620 (404, 849) | 49 (24, 116) | 78 (52, 127) | 255 (209, 300) | <0.0001 |
| CRP (mg/dL) | 0.100 (0.030, 0.465) | 8.390 (1.202, 12.255) | 0.400 (0.324, 0.845) | 0.080 (0.058, 0.161) | 0.001 |
| eGFR|| (mL/min/1.73 m2) | 94.50 (79.81, 109.68) | 86.72(69.36, 94.50) | 80.95 (66.37, 99.18) | 92.15(85.24, 102.29) | 0.453 |
| NGAL gene normalized counts | 40032.64 (18328.19, 79735.56) | 211.72 (25.07, 3631.79) | 1638.79 (1129.19, 4946.41) | 13965.96 (11045.95, 44238.40) | <0.0001 |
Quantitative data are presented as the median [quartile1 (Q1), Q3] values; †MPN included CML (n=8), PV (n=4), ET (n=4), PMF (n=3), and MPN-U (n=1); ‡The control group comprised patients with lymphoma without BM involvement (n=7) or normocellular marrow without hematological malignancy according to the BM smear and pathological review (n=2); *for age and Hb variable, the one-way ANOVA test was performed, and for WBC count, neutrophil count, platelet count, CRP, eGFR, and NGAL gene normalized count variable, the Kruskal-Wallis H-Test was performed; ||, eGFR was calculated using the CKD-EPI equation.
Abbreviations: AML, acute myeloid leukemia; BM, bone marrow; CKD-EPI, Chronic Kidney Disease Epidemiology Collaboration equation; CML, chronic myeloid leukemia; CRP, C-reactive protein; eGFR, estimated glomerular filtration rate; ET, essential thrombocythemia; Hb, hemoglobin; MDS, myelodysplastic syndrome; MPN, myeloproliferative neoplasm; MPN-U, MPN-unclassifiable; PMF, primary myelofibrosis; PV, polycythemia vera; WBC, white blood cell.
Simple regression analysis of the relationship of NGAL gene normalized counts with those of cytokine genes
The normalized counts of NGAL [median (Q1, Q3)] in BM MNCs (n=48) were 11978.32 (2106.77, 41460.04). Among 48 cytokine genes, simple regression analysis identified 26 significant predictors of NGAL normalized counts (Table 2). Table 2 presents the normalized counts of each of the 48 cytokine genes.
Simple regression analysis of normalized counts of neutrophil gelatinase‐associated lipocalin (NGAL) and 48 cytokine genes in 48 bone marrow mononuclear cells
| Gene Name | R2 | P-value† | Normalized counts‡ |
|---|---|---|---|
| BAX | 0.361 | <0.001 | 430.30 (129.17, 921.12) |
| BCL2L1 | 0.005 | 0.650 | 1161.90 (445.83, 3083.26) |
| CASP8 | 0.602 | <0.001 | 1829.57 (1060.55, 3199.58) |
| CRP | 0.004 | 0.657 | 1.15 (1.00, 2.41) |
| CXCL1 | 0.405 | <0.001 | 41.38 (20.53, 149.78) |
| CXCL10 | 0.085 | 0.044 | 4.26 (1.19, 16.08) |
| CXCL2 | 0.002 | 0.792 | 65.42 (28.43, 235.26) |
| Caspase-1 | 0.010 | 0.508 | 140.78 (51.02, 600.28) |
| ELK1 | 0.407 | <0.001 | 44.86 (31.60, 86.38) |
| FOS | 0.252 | <0.001 | 1907.91 (822.54, 5739.86) |
| IL10 | 0.004 | 0.669 | 4.30 (1.96, 9.44) |
| IL11 | 0.033 | 0.218 | 4.15 (1.91, 5.64) |
| IL18 | 0.495 | <0.001 | 160.25 (71.47, 346.07) |
| IL1A | 0.506 | <0.001 | 4.60 (1.75, 8.30) |
| IL1B | 0.095 | 0.033 | 36.69 (16.44, 157.54) |
| IL1R1 | 0.550 | <0.001 | 19.69 (7.74, 71.20) |
| IL1R2 | 0.537 | <0.001 | 313.50 (45.26, 1513.25) |
| IL2 | 0.017 | 0.373 | 2.62 (1.05, 4.12) |
| IL28A/B | 0.001 | 0.864 | 1.62 (1.01, 2.87) |
| IL29 | 0.001 | 0.803 | 1.00 (1.00, 1.16) |
| IL3 | 0.001 | 0.840 | 1.10 (1.00, 1.39) |
| IL4 | 0.187 | 0.002 | 14.08 (6.35, 45.30) |
| IL5 | 0.342 | <0.001* | 4.63 (1.86, 10.76) |
| IL6 | 0.002 | 0.791 | 1.17 (1.00, 2.75) |
| IL7 | 0.021 | 0.328 | 10.47 (4.38, 19.29) |
| IL8 | 0.336 | <0.001 | 488.11 (140.69, 2125.02) |
| IL9 | 0.462 | <0.001 | 1.15 (1.00, 2.03) |
| INFB | 0.003 | 0.704 | 3.28 (1.85, 4.99) |
| IRAK1 | 0.549 | <0.001 | 444.39 (268.83, 743.36) |
| IRAK2 | 0.223 | 0.001 | 57.38 (36.08, 159.63) |
| IRAK4 | 0.170 | 0.004* | 182.62 (51.42, 431.18) |
| IRF7 | 0.065 | 0.080 | 110.71 (43.56, 228.80) |
| MyD88 | 0.262 | <0.001 | 616.36 (276.34, 1634.68) |
| NF-kB | 0.027 | 0.264 | 41.94 (18.64, 131.04) |
| NFKB1A | 0.127 | 0.013 | 1744.90 (772.39, 4030.14) |
| NLRP3 | 0.215 | 0.001 | 344.61 (120.15, 766.43) |
| RAGE | 0.001 | 0.798 | 22.01 (8.80, 54.45) |
| STAT1 | 0.103 | 0.026 | 767.49 (378.39, 1864.03) |
| STAT2 | 0.236 | <0.001 | 858.11 (479.27, 1579.37) |
| STAT3 | 0.799 | <0.001* | 2387.19 (1319.69, 4416.35) |
| STAT4 | 0.023 | 0.309 | 213.48 (53.50, 467.81) |
| TLR1 | 0.303 | <0.001* | 266.94 (117.14, 819.62) |
| TLR2 | 0.193 | 0.002* | 356.11 (171.76, 737.90) |
| TLR4 | 0.833 | <0.001* | 425.17 (184.17, 1145.19) |
| TLR5 | 0.048 | 0.136 | 18.35 (6.64, 47.35) |
| TNF | 0.097 | 0.031 | 115.23 (51.74, 295.85) |
| TRAF3 | 0.721 | <0.001 | 501.40 (304.37, 891.38) |
| TRAF6 | 0.271 | <0.001 | 119.15 (59.24, 288.61) |
† Adjusted alpha was determined as 0.026; ‡Normalized counts are presented as the median [quartile1 (Q1), Q3] values; * they were indicated, because those cytokine genes were included as independent factors in multiple regression models; P-values > 0.05 were typed in boldface.
Abbreviations: AML, acute myeloid leukemia; BAX, bcl-2-associated X protein; BCL2L1, bcl-2-like 1; CXCL, chemokine (C-X-C motif) ligand; ELK1, ETS like transcription factor-1; IL, interleukin; IL1A, IL 1 alpha; IL1R2, IL1 receptor, type 2; IRF7, interferon regulatory factor 7; MDS, myelodysplastic syndrome; NGAL, neutrophil gelatinase-associated lipocalin; Q, quartile; RAGE, receptor for advanced glycation end products; TLR4, Toll-like receptor 4.
Multiple regression analysis of the normalized counts of NGAL and those of other cytokine genes
Using normalized counts of NGAL as the dependent variable and 26 significant predictors (normalized counts of 26 cytokine genes) identified in the simple regression analysis as independent variables, multiple regression analysis was performed. Two multiple regression models were developed (Table 3).
Regression analysis models of the relationship between the normalized counts of NGAL and those of cytokine genes in the bone marrow
| Coefficient | t‐value | P‐value† | VIF | Adj R2 | AIC | |
|---|---|---|---|---|---|---|
| Model 1 | ||||||
| Constant | 4165.283 | 1.718 | 0.093 | 0.936 | 885.642 | |
| TLR4 | 7.676 | 1.602 | 0.117 | 17.277 | ||
| IL5 | 882.859 | 3.769 | 0.001 | 1.374 | ||
| STAT3 | 6.792 | 4.532 | <0.001 | 22.683 | ||
| TLR2 | -27.477 | -5.789 | <0.001 | 5.534 | ||
| TLR1 | 16.348 | 4.567 | <0.001 | 8.671 | ||
| IRAK4 | -35.902 | -4.424 | <0.001 | 4.539 | ||
| Model 2 | ||||||
| Constant | 4316.825 | 1.749 | 0.088 | 0.933 | 886.557 | |
| IL5 | 844.226 | 3.558 | 0.001 | 1.359 | ||
| STAT3 | 9.056 | 17.792 | <0.001 | 2.522 | ||
| TLR2 | -28.206 | -5.862 | <0.001 | 5.484 | ||
| TLR1 | 17.540 | 4.919 | <0.001 | 8.296 | ||
| IRAK4 | -42.524 | -5.979 | <0.001 | 3.362 |
Abbreviations: Adj, adjusted; AIC, Akaike's information criterion; VIF, variance influence factor.
†Statistically significant (P<0.05).
(Model 1) NGAL normalized counts=4165.283 + 7.676 × TLR4 normalized counts + 882.859 × IL5 normalized counts + 6.792 × STAT3 normalized counts - 27.477 × TLR2 normalized counts + 16.348 × TLR1 normalized counts - 35.902 × IRAK4 normalized counts
(Model 2) NGAL normalized counts=4316.825 + 9.056 × STAT3 normalized counts + 844.226 × IL5 normalized counts + 17.540 × TLR1 normalized counts - 28.206 × TLR2 normalized counts - 42.524 × IRAK4 normalized counts
The adjusted R2 and AIC values are listed in Table 3. The AIC value was lower for Model 1 than for Model 2, and the adjusted R2 value for Model 1 was higher than that for Model 2. This suggested that model 1 had higher predictive accuracy for NGAL normalized counts than model 2 (Table 3) [19, 20]. However, multiple regression analysis showed multicollinearity between TLR4 (VIF=17.277) and STAT3 (VIF=22.683), two independent variables in model 1 (Table 3). Thus, model 2, in which TLR4 was removed from the predictor variables, was interpreted as more appropriate for predicting NGAL normalized counts than model 1. Because TLR4 and STAT3 normalized counts exhibited multicollinearity, a scatter plot between TLR4 and STAT3 normalized counts was created (Figure 1).
Scatter plot between TLR4 and STAT3 normalized counts in bone marrow.
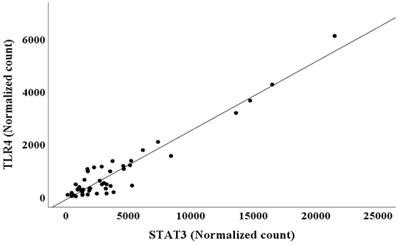
The relationship between the two variables in BM was further analyzed by simple regression analysis, which showed the following relationship:
TLR4 normalized counts=-105.521 + 0.262 × STAT3 normalized counts (R2=0.919, p<0.001)
NGAL, STAT3, IL5, and TLR4 normalized counts in hematological malignant disease groups compared to the control
The median (Q1, Q3) NGAL normalized counts according to disease entities are presented in Table 1. The NGAL normalized count in the control group was 13965.96 (11045.95, 44238.40). MPN (n=20) showed the highest NGAL normalized counts [40032.64 (18328.19, 79735.56)]. The MPN group showed statistically higher NGAL normalized counts than the AML and MDS groups (Figure 2A). Acute myeloid leukemia had the lowest NGAL normalized counts [211.72 (25.07, 3631.79)]. The AML groups exhibited statistically significant lower NGAL normalized counts than the control group (Figure 2A).
Comparison of NGAL (A), STAT3 (B), IL5 (C), and TLR4 (D) normalized counts in BM mononuclear cells of the hematological malignancy and control groups. The control group comprised patients with normal BM. (A) NGAL normalized counts in the AML and MDS groups are statistically lower than those in the MPN group. NGAL normalized counts in the AML group are statistically lower than those in the control group. (B) STAT3 normalized counts in the MDS group are statistically lower than those in the MPN group. (C) IL5 normalized counts in the AML group are statistically lower than those in the MPN group. (D) TLR4 normalized counts in the AML and MDS groups are statistically lower than those in the MPN group. Abbreviations: AML, acute myeloid leukemia; BM, bone marrow; MDS, myelodysplastic syndrome; MPN, myeloproliferative neoplasm; NGAL, neutrophil gelatinase-associated lipocalin.
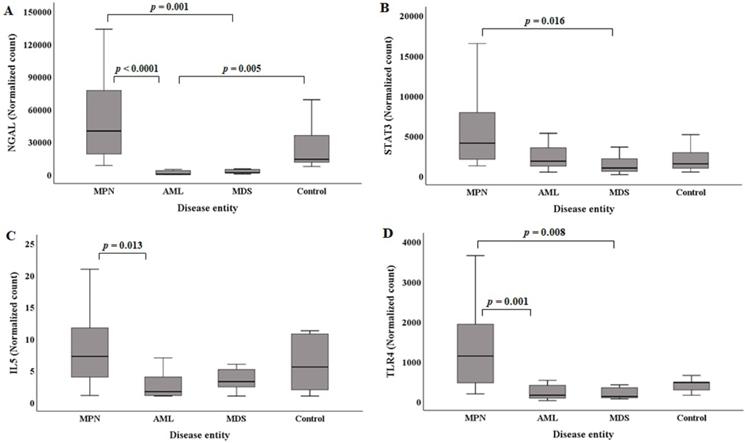
The median (Q1, Q3) of STAT3 normalized counts in the control group was 1506.65 (882.89, 3092.34). MPN (n=20) showed the highest STAT3 normalized counts [4087.45 (1982.02, 8171.37)]. The MPN group exhibited statistically higher STAT3 normalized counts than the MDS group (Figure 2B). The MDS group had the lowest STAT3 normalized counts [982.35 (489.12, 2499.36)].
The median (Q1, Q3) of IL5 normalized counts in the control group was 5.57 (1.52, 11.02). MPN (n=20) had the highest IL5 normalized counts [7.25 (3.80, 11.96)]. The MPN group showed statistically higher IL5 normalized counts than the AML group (Figure 2C). The AML group exhibited the lowest IL5 normalized counts [1.69 (1.04, 4.57)].
The median (Q1, Q3) of the TLR4 normalized counts in the control group was 477.72 (270.69, 566.27). MPN (n=20) had the highest TLR4 normalized counts [1138.15 (393.43, 2012.43)]. The MPN group showed statistically higher TLR4 normalized counts than the AML and MDS groups (Figure 2D). The MDS group exhibited the lowest TLR4 normalized counts [127.36 (82.84, 417.55)].
Discussion
We analyzed the association of cytokines' expressions, using BM MNCs at the diagnostic time of myeloid malignancies, which represent clonal diseases of hematopoietic stem cells (HSCs) [21]. BM MNCs include not only hematopoietic progenitor cells at different stages of maturation (drived by HSCs) but also mesenchymal stromal cells (MSCs) comprising the HSC niche [22]. HSC niches are local tissue microenvironments that maintain and regulate stem cells, being often located near trabecular bone and created partly by MSCs and endothelial cells [23]. Recent studies showed that myeloid malignancies are caused by different genetic and epigenetic changes of HSCs and functional changes in HSC niche cells such as MSCs, while the interplay by various kinds of cytokines between HSCs and the niche play an important role [24]. Especially the interplay between both of them were reported to change during disease evolution [24]. In this context, our study displayed the association of cytokines in MNCs (including HSCs and MSCs) involved in the interplay at the diagnostic time of myeloid malignancy, especially presenting the association of NGAL with the relatively well known cytokine genes such as STAT3, TLR4, IL5, TLR1 and TLR2.
Demographic and clinical data showed that AML and MDS groups had significantly lower Hb levels than the control (Table 1; Supplementary Table S1). Hb, neutrophil counts, platelet counts, and NGAL normalized counts were significantly lower in the AML and MDS groups than in the MPN group (Table 1; Supplementary Table S1). NGAL normalized counts showed a pattern similar to BM NGAL protein levels in previous studies [8, 10].
CRP levels were significantly higher in the AML group than those in the control group (Table 1; Supplementary Table 1). Although CRP levels (protein levels measured in peripheral blood, Table 1) were higher in the AML group, there was no significant difference between the AML and control groups with respect to CRP expression in BM MNCs (Supplementary Table 2). This is because plasma CRP is mainly produced in hepatocytes, but CRP gene expression in our study was measured in BM mononuclear cells [25]. In line with that, in our study, CRP gene showed very low normalized counts among all 49 genes (Table 2), and did not show significant differences between the groups (Supplementary Table 2).
Normalized counts of NGAL had the highest statistical association with those of STAT3 (R2=0.799, p<0.001) and TLR4 (R2=0.833, p<0.001). However, normalized counts of NGAL were not significantly associated with those of BCL2L1, CRP, CXCL2, CASPASE-1, IL10, IL11, IL2, IL28A/B, IL29, IL3, IL6, IL7, INFB, IRF7, NF-kB, RAGE, STAT4, or TLR5 (Table 2). In a previous study using human macrophages, IL-10 affected the expression of NGAL [26], but its normalized counts in our study did not show an association with the normalized counts of NGAL. This will be probably because IL-10 does not directly affect NGAL expression [26]. IL-10 has been reported to affect NGAL expression through the Janus kinase-STAT pathway [26].
Multiple regression model 2 (Table 3) for predicting NGAL normalized counts included five independent factors, among which, STAT3 normalized counts had the highest explanatory power (R2=0.799, Table 2). In sequence, IL5 (R2=0.342, Table 2), TLR1 (R2=0.303, Table 2), TLR2 (R2=0.193, Table 2), and IRAK4 (R2=0.170, Table 2) normalized counts exhibited explanatory power. In a previous study using human macrophages, STAT3 was an important transcription factor for NGAL expression [26]. Additionally, NGAL has been suggested to induce the growth and proliferation of breast cancer cells, lung cancer cells, and hepatoblatoma [26]. Similarly, our study based on human BM MNCs showed that NGAL normalized counts had a statistically high association with STAT3 normalized counts. Additionally, NGAL and STAT3 normalized counts showed similar patterns based on disease entity, especially in the MPN and MDS groups (Figure 2 A and B). Further studies including more human BM MNC specimens in several hematological malignancy entities could identify the association between NGAL and STAT3 more clearly, helping to elucidate their developmental mechanisms.
In multiple regression model 2, the TLR4 normalized count was removed as an independent factor because it exhibited multicollinearity with the STAT3 normalized count. However, the TLR4 normalized count was an independent factor with higher explanatory power (R2=0.833, Table 2) for the NGAL normalized count than the STAT3 normalized count (R2=0.799, Table 2) in simple regression analysis. Additionally, the pattern of NGAL normalized counts in the disease and control groups was more similar to that of TLR4 normalized counts than to that of STAT3 normalized counts (Figure 2 A, B, and D). Although the relationship between TLR4 and NGAL has been reported in previous studies, it was found in organs or tissues other than BM, such as the urinary system and A549 cells [1, 27]. In the urinary system, TLR4 expression is crucial for the secretion of urinary NGAL but does not directly affect NGAL expression [27]. In A549 cells (adenocarcinomic human alveolar basal epithelial cells), the transfection of both TLR4 and its cofactor MD2 led to the upregulation of NGAL expression [1]. Studies using human macrophages and monocytes showed an association between TLR4 and STAT3, but not a direct relationship of TLR4 to NGAL [28, 29]. Previous studies based on human monocytes and macrophages suggested that TLR4 does not affect NGAL expression as directly as STAT3 [26, 28, 29]. Accordingly, TLR4 normalized counts, but not STAT3 normalized counts, were finally removed as an independent factor in our multiple regression model.
In multiple regression model 2, IL5 normalized counts had the second highest explanatory power (R2=0.342, Table 2), and if the pattern of the STAT3 normalized counts was combined with the pattern of IL5 normalized counts, the combined pattern became more similar to that of the NGAL normalized counts (Figure 2 A, B, and C).
There was no sign of severe infections in AML group of our study. Nevertheless, AML group showed high CRP and low NGAL expression (Table 1), which seems contradictory. As for high CRP levels at the diagnostic time of AML, AML patients with high WHO performance score were reported to have higher CRP levels than those with low score (patients with performance score 3/4 had 6.81 mg/dL higher CRP compared to patients with performance score 0), while in that previous study patients who had a bacteraemic episode within 30 days of AML diagnosis were excluded [30].
However, WHO performance scores of AML patients in our study could not be identified accurately from medical records. Only given that four, two and one AML patients had over 70 years of age, PML-RARA rearrangement and brain hemorrhage, respectively, it could be speculated that AML group in our study would have had relatively high WHO scores. This possibly could lead to high CRP in AML group of our study.
As for low NGAL, a previous study using BM supernatant showed that AML group had low NGAL and high CRP levels [8]. That study suggested that the reason to low NGAL levels in AML group would be due to neutrophils or neutrophilic precursors as synthesis and storage sites of NGAL being suppressed by increased leukemic cells [8].
Nevertheless, as the limitation of our study, since MNCs were isolated from the BM via density, neutrophils would not have been necessarily preserved in the buffy coat and this could have biased the NGAL expression level in our study (more lymphocytes and less myeloid cells). To prevent such bias, future studies measuring the expression of cytokines and analyzing their association at single cell level are needed, which will also help elucidate the association of cytokines in myeloid malignancy more accurately and specifically.
In conclusion, to the best of our knowledge, the present study analyzed for the first time, the association between the normalized counts of NGAL and those of the cytokine genes in human BM MNCs. First, simple regression analysis identified 26 cytokine gene normalized counts that were statistically significantly related to NGAL normalized counts, although STAT3 and TLR4 normalized counts had the highest explanatory power. Stepwise multiple regression analysis was used to develop a multiple regression model as follows: NGAL normalized counts=4316.825 + 9.056 × STAT3 normalized counts + 844.226 × IL5 normalized counts + 17.540 × TLR1 normalized counts - 28.206 × TLR2 normalized counts - 42.524 × IRAK4 normalized counts. Multiple regression analysis showed that STAT3 and TLR4 normalized counts exhibited multicollinearity and a statistically high association. STAT3, IL5, and TLR4 normalized counts showed similar patterns to NGAL normalized counts in hematological malignancy and control groups. Future studies are warranted to identify and confirm these relationships more accurately and specifically in hematological malignancy diseases, which would help elucidate their developmental mechanisms.
Abbreviations
Adj, adjusted; AIC, Akaike's information criterion; AML, acute myeloid leukemia; BM, bone marrow; BAX, bcl-2-associated X protein; BCL2L1, bcl-2-like 1; CKD-EPI, Chronic Kidney Disease Epidemiology Collaboration equation; CML, chronic myeloid leukemia; CRP, C-reactive protein; CXCL, chemokine (C-X-C motif) ligand; DEG, differentially expressed gene; eGFR, estimated glomerular filtration rate; ELK1, ETS like transcription factor-1; ET, essential thrombocythemia; Hb, hemoglobin; IL, interleukin; IL1A, IL 1 alpha; IL1R2, IL1 receptor, type 2; IRF7, interferon regulatory factor 7; MDS, myelodysplastic syndrome; MNC, mononuclear cell; MPN, myeloproliferative neoplasm; MPN-U, MPN-unclassifiable; NGAL, neutrophil gelatinase-associated lipocalin; PMF, primary myelofibrosis; PV, polycythemia vera; Q, quartile; RAGE, receptor for advanced glycation end-products; TLR4, Toll-like receptor 4; VIF, variance influence factor; WBC, white blood cell.
Supplementary Material
Supplementary tables.
Acknowledgements
The authors thank Editage (www.editage.co.kr) for English language editing. This research was supported by the National Research Foundation of Korea (NRF) grant funded by the Korean government (MSIT) (No.2018R1C1B5029760), the Research Grant of Jeonju University (No. 1120 0279), and Korea Institute of Science and Technology (KIST) grant (No. 2E31041, Development of brain-inspired neuromorphic technologies). The NRF, Jeonju University, and KIST grant provided financial support for the research.
Competing Interests
The authors have declared that no competing interest exists.
References
1. Chakraborty S, Kaur S, Guha S. et al. The multifaceted roles of neutrophil gelatinase associated lipocalin (NGAL) in inflammation and cancer. Biochim Biophys Acta. 2012;1826:129-69
2. Cai L, Rubin J, Han W. et al. The origin of multiple molecular forms in urine of HNL/NGAL. Clin J Am Soc Nephrol. 2010;5:2229-35
3. Candido S, Maestro R, Polesel J. et al. Roles of neutrophil gelatinase-associated lipocalin (NGAL) in human cancer. Oncotarget. 2014;5:1576-94
4. Kashani K, Cheungpasitporn W, Ronco C. Biomarkers of acute kidney injury: the pathway from discovery to clinical adoption. Clin Chem Lab Med. 2017;55:1074-89
5. Moschen AR, Adolph TE, Gerner RR. et al. Lipocalin-2: A master mediator of intestinal and metabolic inflammation. Trends Endocrinol Metab. 2017;28:388-97
6. Abella V, Scotece M, Conde J. et al. The potential of lipocalin-2/NGAL as biomarker for inflammatory and metabolic diseases. Biomarkers. 2015;20:565-71
7. Allegra A, Alonci A, Bellomo G. et al. Increased serum levels of neutrophil gelatinase-associated lipocalin in patients with essential thrombocythemia and polycythemia vera. Leuk Lymphoma. 2011;52:101-7
8. Cho CH, Cha J, Chang EA. et al. Analysis of bone marrow supernatant neutrophil gelatinase-associated lipocalin and hematological parameters in hematological malignancy. J Clin Lab Anal. 2020: e23253.
9. Yang WC, Lin PM, Yang MY. et al. Higher lipocalin 2 expression may represent an independent favorable prognostic factor in cytogenetically normal acute myeloid leukemia. Leuk Lymphoma. 2013;54:1614-25
10. Cho CH, Cha J. Analysis of neutrophil gelatinase-associated lipocalin, vascular endothelial growth factor, and soluble receptor for advanced glycation end-products in bone marrow supernatant in hematologic malignancies. Clin Biochem. 2020;80:19-24
11. Veldman-Jones MH, Brant R, Rooney C. et al. Evaluating robustness and sensitivity of the NanoString Technologies nCounter Platform to enable multiplexed gene expression analysis of clinical samples. Cancer Res. 2015;75:2587-93
12. Grievink HW, Luisman T, Kluft C. et al. Comparison of three isolation techniques for human peripheral blood mononuclear cells: Cell Recovery and viability, population composition, and cell functionality. Biopreserv Biobank. 2016;14:410-15
13. Benjamini Y, Hochberg Y. Controlling the false discovery rate: a practical and powerful approach to multiple testing. J R Stat Soc Series B Stat Methodol. 1995;57:289-300
14. Lage-Castellanos A, Martinez-Montes E, Hernandez-Cabrera JA. et al. False discovery rate and permutation test: an evaluation in ERP data analysis. Stat Med. 2010;29:63-74
15. Causeur D, Chu MC, Hsieh S. et al. A factor-adjusted multiple testing procedure for ERP data analysis. Behav Res Methods. 2012;44:635-43
16. Mun S, Kim ES, Park MC. Effect of mental fatigue caused by mobile 3D viewing on selective attention: an ERP study. Int J Psychophysiol. 2014;94:373-81
17. Mun S, Whang M, Park S. et al. Effects of mental workload on involuntary attention: A somatosensory ERP study. Neuropsychologia. 2017;106:7-20
18. Korthauer K, Kimes PK, Duvallet C. et al. A practical guide to methods controlling false discoveries in computational biology. Genome Biol. 2019;20:118
19. Takenaka Y, Oya R, Aoki K. et al. Pretreatment serum lactate dehydrogenase as a prognostic indicator for oral cavity squamous cell carcinoma. Acta Otolaryngol. 2018;138:433-6
20. Hao K, Chen YC, Cao YG. et al. Pharmacokinetic-pharmacodynamic modeling of telmisartan using an indirect response model in spontaneously hypertensive rats. Acta Pharmacol Sin. 2007;28:738-43
21. Mitroulis I, Kalafati L, Bornhauser M. et al. Regulation of the Bone Marrow Niche by Inflammation. Front Immunol. 2020;11:1540
22. Cuende N, Rico L, Herrera C. Concise review: bone marrow mononuclear cells for the treatment of ischemic syndromes: medicinal product or cell transplantation? Stem Cells Transl Med. 2012;1:403-8
23. Morrison SJ, Scadden DT. The bone marrow niche for haematopoietic stem cells. Nature. 2014;505:327-34
24. Korn C, Mendez-Ferrer S. Myeloid malignancies and the microenvironment. Blood. 2017;129:811-22
25. Pepys MB, Hirschfield GM. C-reactive protein: a critical update. J Clin Invest. 2003;111:1805-12
26. Jung M, Weigert A, Tausendschon M. et al. Interleukin-10-induced neutrophil gelatinase-associated lipocalin production in macrophages with consequences for tumor growth. Mol Cell Biol. 2012;32:3938-48
27. Paragas N, Kulkarni R, Werth M. et al. α-Intercalated cells defend the urinary system from bacterial infection. J Clin Invest. 2014;124:2963-76
28. Bode JG, Ehlting C, Haussinger D. The macrophage response towards LPS and its control through the p38(MAPK)-STAT3 axis. Cell Signal. 2012;24:1185-94
29. Hildebrand D, Uhle F, Sahin D. et al. The interplay of notch signaling and STAT3 in TLR-activated human primary monocytes. Front Cell Infect Microbiol. 2018;8:241
30. Gradel KO, Povoa P, Garvik OS. et al. Longitudinal trajectory patterns of plasma albumin and C-reactive protein levels around diagnosis, relapse, bacteraemia, and death of acute myeloid leukaemia patients. BMC Cancer. 2020;20:249
Author contact
![]() Corresponding author: Chi-Hyun Cho, Department of Laboratory Medicine, College of Medicine, Korea University Ansan Hospital, 123, Jeokgeum-ro, Danwon-gu, Ansan-si, Gyeonggi-do 15355, Republic of Korea; Tel: +82-31-412-5300; Fax: +82-31-412-5314; Email: 9754091ac.kr
Corresponding author: Chi-Hyun Cho, Department of Laboratory Medicine, College of Medicine, Korea University Ansan Hospital, 123, Jeokgeum-ro, Danwon-gu, Ansan-si, Gyeonggi-do 15355, Republic of Korea; Tel: +82-31-412-5300; Fax: +82-31-412-5314; Email: 9754091ac.kr