Impact Factor ISSN: 1449-1907
- Issue 9; 2026
- Issue 8; 2026
- Issue 7; 2026
- Issue 6; 2026
- Issue 5; 2026
- Volume 23; 2026
- Past Issues
- Editorial Board
- Cover Images
- Index & Coverage
- Cover Suggestion
- Special Issues
Introduction
Materials and methods
Results
Discussion
Supplementary Material
Acknowledgements
References

 Global reach, higher impact
Int J Med Sci 2021; 18(1):256-269. doi:10.7150/ijms.48123 This issue Cite
Research Paper
Upregulation of peroxisome proliferator-activated receptor-α and the lipid metabolism pathway promotes carcinogenesis of ampullary cancer
Chih-Yang Wang1,2, Ying-Jui Chao3,4, Yi-Ling Chen5, Tzu-Wen Wang3, Nam Nhut Phan6, Hui-Ping Hsu3,7 ![]() , Yan-Shen Shan3, Ming-Derg Lai8,9,10
, Yan-Shen Shan3, Ming-Derg Lai8,9,10
1. PhD Program for Cancer Molecular Biology and Drug Discovery, College of Medical Science and Technology, Taipei Medical University, Taipei 11031, Taiwan.
2. Graduate Institute of Cancer Biology and Drug Discovery, College of Medical Science and Technology, Taipei Medical University, Taipei 11031, Taiwan.
3. Department of Surgery, National Cheng Kung University Hospital, College of Medicine, National Cheng Kung University, Tainan 70403, Taiwan.
4. Institute of Clinical Medicine, College of Medicine, National Cheng Kung University, Tainan 70101, Taiwan.
5. Senior Citizen Service Management, Chia-Nan University of Pharmacy and Science, Tainan 71710, Taiwan.
6. NTT Institute of Hi-Technology, Nguyen Tat Thanh University, Ho Chi Minh City, Vietnam.
7. Department of Biostatistics, Vanderbilt University Medical Center, Nashville, TN 37232, USA.
8. Department of Biochemistry and Molecular Biology, College of Medicine, National Cheng Kung University, Tainan 70101, Taiwan.
9. Institute of Basic Medical Sciences, National Cheng Kung University, Tainan 70101, Taiwan.
10. Center for Infectious Diseases and Signaling Research, College of Medicine, National Cheng Kung University, Tainan 70101, Taiwan.
Received 2020-5-13; Accepted 2020-10-28; Published 2021-1-1
Abstract
Ampullary cancer is a rare periampullary cancer currently with no targeted therapeutic agent. It is important to develop a deeper understanding of the carcinogenesis of ampullary cancer. We attempted to explore the characteristics of ampullary cancer in our dataset and a public database, followed by a search for potential drugs. We used a bioinformatics pipeline to analyze complementary (c)DNA microarray data of ampullary cancer and surrounding normal duodenal tissues from five patients. A public database from the National Center for Biotechnology Information Gene Expression Omnibus (NCBI GEO) was applied for external validation. Bioinformatics tools used included the Gene Set Enrichment Analysis (GSEA), Database for Annotation, Visualization and Integrated Discovery (DAVID), MetaCore, Kyoto Encyclopedia of Genes and Genomes (KEGG), Hallmark, BioCarta, Reactome, and Connectivity Map (CMap). In total, 9097 genes were upregulated in the five ampullary cancer samples compared to normal duodenal tissues. From the MetaCore analysis, genes of peroxisome proliferator-activated receptor alpha (PPARA) and retinoid X receptor (RXR)-regulated lipid metabolism were overexpressed in ampullary cancer tissues. Further a GSEA of the KEGG, Hallmark, Reactome, and Gene Ontology databases revealed that PPARA and lipid metabolism-related genes were enriched in our specimens of ampullary cancer and in the NCBI GSE39409 database. Expressions of PPARA messenger (m)RNA and the PPAR-α protein were higher in clinical samples and cell lines of ampullary cancer. US Food and Drug Administration (FDA)-approved drugs, including alvespimycin, trichostatin A (a histone deacetylase inhibitor), and cytochalasin B, may have novel therapeutic effects in ampullary cancer patients as predicted by the CMap analysis. Trichostatin A was the most potent agent for ampullary cancer with a half maximal inhibitory concentration of < 0.3 μM. According to our results, upregulation of PPARA and lipid metabolism-related genes are potential pathways in the carcinogenesis and development of ampullary cancer. Results from the CMap analysis suggested potential drugs for patients with ampullary cancer.
Keywords: Ampullary cancer, Lipid metabolism, Carcinogenesis, PPARA gene, Bioinformatics
Introduction
Ampullary cancer is a rare type of cancer with an incidence of 0.0004%~0.0006% in the general population and 0.5% among total gastrointestinal cancer cases [1]. The 5-year survival rate of ampullary cancer patients ranges 30%~50%, and adjuvant chemotherapy or radiotherapy fails to improve survival [2-4]. Adjuvant therapy provides only small benefits for ampullary cancer patients with poor prognostic factors [5]. Certain regimens of chemotherapy may be beneficial in advanced or metastatic ampullary cancers [6]. Therefore, new therapeutic agents for ampullary cancer patients imperatively need to be discovered.
In recent years, mechanisms of carcinogenesis have been extensively studied in cancer research. Several potential pathways were examined in ampullary cancer [7,8]. Previous research suggested a correlation between survival of ampullary cancer patients and expressions of membrane receptors for bile acids [9]. Genetic polymorphisms of lipid metabolism-related genes were correlated with the development of biliary tract cancer and ampullary cancer [10,11]. The mechanism of development of ampullary cancer remains inexplicit, and comprehensive analyses are required.
In cancer research, databases are used to speculate on disease-drug-gene interactions and discover potential therapeutic agents [12]. The Connectivity Map (CMap) comprises over 1300 drugs and small molecules approved by the US Food and Drug Administration (FDA). The CMap provides information about gene expression patterns of four types of cancer cell lines treated with FDA-approved drugs and/or small molecules [13]. In the present study, we exploited an Agilent microarray to compare gene expressions in ampullary cancer tissues to those of surrounding normal duodenal tissues. MetaCore was utilized to analyze potential signaling pathways in ampullary cancer patients. Based on our bioinformatics analysis, we found that peroxisome proliferator-activated receptor (PPAR) and its related lipid metabolism pathway were involved in the development of ampullary cancer. The PPAR family protein, known as ligand-inducible transcription factors, comprises three members: PPAR-α, PPAR-β, and PPAR-γ (PPARA, PPARD, and PPARG gene, respectively). These are members of the nuclear hormone receptor superfamily and can be partially distinguished by their tissue distributions, ligands, and target specificities [14-16]. Depending on the type of ligand or tissue of origin, activation of PPAR-α either strengthens or attenuates tumor progression [17]. Although PPAR-α acts as a key factor of tumorigenesis, its role in ampullary cancer is unknown. The aim of the present study was to explore the function of PPAR-α in ampullary cancer from our dataset and public databases, followed by a search for potential drugs using CMap. These results were confirmed in cell lines and clinical samples of ampullary cancer.
Materials and methods
Study design and patient population
Five patients with an ampullary adenocarcinoma (two women with T2N0, stage IB cancer and three men with T3N0, stage IIA cancer) who underwent a radical resection in our hospital from 2003 to 2012 were selected. The pathological stage followed guidelines defined by the American Joint Committee on Cancer (AJCC) Cancer Staging Manual, 7th edition [18]. Fresh specimens of ampullary cancer and surrounding normal duodenal tissues were collected. General characteristics of patients such as demographics, histopathological findings, and outcomes were collected by a retrospective chart review (Supplementary Table 1). Patients received regular follow-up and routine examinations every 3~6 months according to the clinician's suggestion. Formal written informed consent was obtained. This study was approved by the Institutional Review Board of our hospital (NCKUH IRB no. A-ER-100-395).
Total RNA extraction and microarray analysis of gene expressions
TRIzol reagent (Invitrogen, Carlsbad, CA, USA) was used to extract total RNA. The RNA integrity of each sample was evaluated by an Agilent 2100 Bioanalyzer (Agilent, Santa Clara, CA, USA). A MaestroNano spectrophotometer (Maestrogen, Las Vegas, NV, USA) was used to check if A260/A230 and A260/A280 ratios of RNA ranged 1.8~2.1. Fresh samples of ampullary cancer and surrounding normal duodenal tissues were analyzed by a complementary (c)DNA microarray. During the in vitro transcription process, RNA from normal samples was labeled with Cy3, and that from ampullary adenocarcinomas was tagged with Cy5 dye (PerkinElmer, Waltham, MA, USA). An Agilent SurePrint G3 Human GE 8×60K microarray was hybridized with Cy-labeled cDNA. The scanning wavelength of the microarray was set to 535 nm for Cy3 and 625 nm for Cy5. Lowes' method with a rank-consistency filter was used to normalize scanned images. Data were analyzed with Agilent Genespring software as we previously described [19-22].
Bioinformatics analyses
MetaCore was used to construct biological networks and associated diseases from expressed gene sets in the cDNA microarray. The cutoff level was set to a p value of < 0.05 to determine significant enrichment in the MetaCore database. Gene Set Enrichment Analysis (GSEA) software was applied for enrichment of gene sets that had a common biological function, chromosomal location, or regulation [23,24]. The Database for Annotation, Visualization and Integrated Discovery (DAVID) was used to perform enrichment analyses for signal pathways [25-27]. We used Fisher's test to select significantly enriched pathways in ampullary cancer. Statistical significance of Gene Ontology (GO) terms was set to a p value of < 0.05. REVIGO software was used to remove any redundancy of GO terms [28,29]. Simulation of Multivariate Linear Model Data (SimRel) for measuring semantic similarity was used with a median of 0.7 for similarity between enriched GO terms. A list of potential genes was mapped to the Kyoto Encyclopedia of Genes and Genomes (KEGG), Hallmark, BioCarta, and Reactome for the biological pathway analysis, with a p value of < 0.05 accepted as being statistically significant [30-32]. A flowchart of the analysis is summarized in Supplementary Figure 1.
Drug response profiles
The CMap, a huge database containing 7000 expression profiles of human cell lines treated with more than 1300 compounds, was exploited to speculate on drug responses after overexpression of particular genes. Five hundred of the most and least highly expressed genes from the cDNA microarray of ampullary cancer were input to CMap to predict potential drugs. To reveal meaningful biological connections of the gene list, the gene-signature perturbation approach was performed in the present study [33,34]. A two-sided t-test was applied to classify the effectiveness of compounds for differential gene expressions. Chemicals with a negative correlation with ampullary cancer were classified by a standardized connection score, perturbation stability, and p value.
Cell lines
The TGBC-18 TKB cell line was established from human cancer of the papilla of Vater and was obtained from the RIKEN Bioresource Center (Ibaraki, Japan). Importation of a cancer cell line was complied with national legislation and was approved by the Centers for Disease Control, Taiwan. The SNU-478 cell line derived from an ampullary adenocarcinoma was a kind gift from Prof. Li-Tzong Chen (National Institute of Cancer Research, Taiwan). Pancreatic cancer cell lines (Pan1 and MIA-Pan2), gastric cancer cell lines (AGS and MKN45), and a colon cancer cell line (HCT-116) were obtained from the Bioresource Collection and Research Center at the Food Industry Research and Development Institute (Hsinchu, Taiwan). Cells were maintained in Dulbecco's modified Eagle's medium with 10% heat-inactivated fetal bovine serum.
Real-time quantitative polymerase chain reaction (qPCR) and reverse-transcription (RT)-PCR
Total RNA was extracted from cultured cells using a RNeasy Mini kit (Qiagen, Hilden, Germany) and single-stranded cDNA was synthesized from total RNA using M-MuLV reverse transcriptase (Roche, Basel, Switzerland) and oligo-dT random primers. cDNA was amplified with primers for specific genes, and an RT-PCR was performed with 35 cycles of denaturing for 30 s at 94 ºC, annealing for 45 s at 60 ºC, and extension for 30 s at 72 ºC in a commercial PCR system. The RT-PCR primers are listed below: PPARA forward, 5'-TCT GGC CAA GAG AAT CTA CGA G-3' and reverse, 5'-CAG CCA TAC ACA GTG TCT CCA T-3' and actin forward, 5'-AGC GGG AAA TCG TGC GTG-3' and reverse, 5'-CAG GGT ACA TGG TGG TGG TGC C-3'. PCR products were visualized after electrophoresis on a 1.9% agarose gel and stained with SAFE DNA gel stain (Invitrogen). Bands on the gels were quantified by a densitometric analysis, normalized relative to the β-actin band, and compared to the control group. For the qPCR, specific primers and cyber-green probes were selected. qPCR parameters were as follows: 45 cycles of 95 ºC for 10 min, 95 ºC for 10 s, 60 ºC for 30 s, and 72 ºC for 1 s, followed by 40 ºC for 30 s. The increase in the fluorescence of fluorescein was automatically measured during the PCR. All samples were amplified in duplicate, and the CT value was recorded. The 2-Δ-Δ CT value was calculated following GAPDH normalization. The qPCR primers were as follows: ACAA1 forward, 5'-TGA CAG TGA GTG ACG TGG AC-3' and reverse, 5'-TTC CAG TCC CGA TGC ACA TG-3'; FABP1 forward, 5'-TGC CAC CAT GAG TTT CTC CG-3' and reverse, 5'-GAT TTC CGA CAC CCC CTT G-3'; FABP2 forward, 5'-AAC GGA CAG ACA ATG GAA AC-3' and reverse, 5'-CGC CAA GAA TAA TGC TCA ATC-3'; PPARA forward, 5'-GGC GAG GAT AGT TCT GGA AG-3' and reverse, 5'-AGG ATA AGT CAC CGA GGA GG-3; and GAPDH forward, 5'-AGC CAC ATC GCT CAG ACA C-3' and reverse, 5'-GCC CAA TAC GAC CAA ATC C-3'.
Cell proliferation assay
Cancer cells were seeded into each well of 96-well plates a day prior to treatment. After treatment with alvespimycin, cytochalasin B, or trichostatin A, 180 μL of a 3-(4,5-dimethylthiazol-2-yl)-2,5-diphenyltetrazolium bromide (MTT) solution was added to each well and incubated for 4 h. The absorbance of the solution was quantified by measuring at a 595-nm wavelength with a spectrophotometer.
Immunohistochemical (IHC) staining
Formalin-fixed paraffin-embedded sections of ampullary cancer were obtained from the Human Biobank of National Cheng Kung University Hospital. Slides were deparaffinized, rehydrated, and underwent heat-retrieval in a pressure boiler. Expression of the PPAR-α protein was detected by a polyclonal rabbit anti-PPAR-α antibody (GeneTex, Irvine, CA, USA) and a goat anti-rabbit secondary antibody conjugated with a peroxidase-labeled polymer (EnVisionTM System, Dako, Denmark). Color was developed with 3-amino-9-ethyl carbazole (Zymed, Waltham, MA, USA), and nuclei were counterstained with Mayer's hematoxylin. Slides were evaluated as low or high expression of PPAR-α.
Statistical analysis
All statistical analyzes were performed with STATA 16 (StataCorp, College Station, TX, USA). The nonparametric Kruskal-Wallis test was utilized for continuous variables. The half maximal inhibitory concentration (IC50) was calculated and graphed using PRISM 5.0 (GraphPad, San Diego, CA, USA). The level of statistical significance was set to p < 0.05.
Results
PPAR and the lipid metabolism-related pathway in ampullary cancer
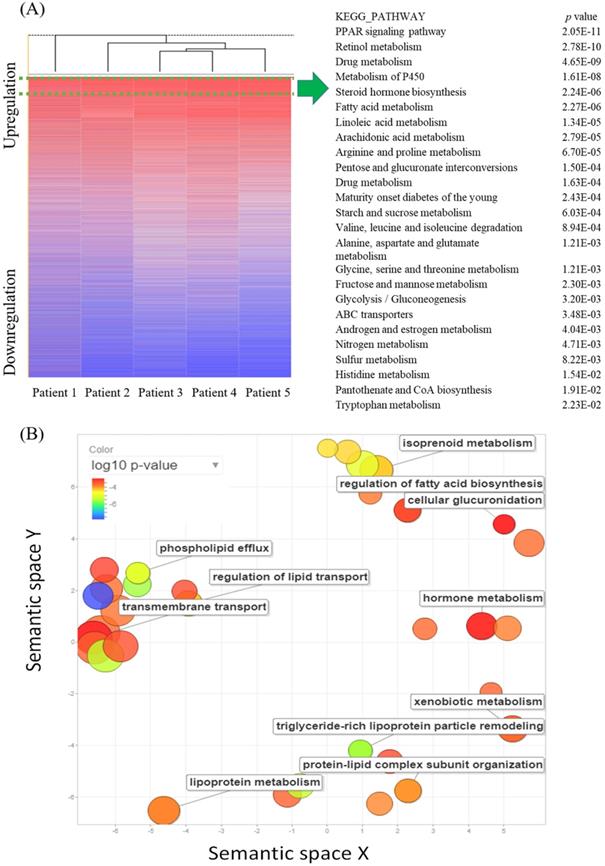
The cDNA microarray consisting of five pairs of ampullary cancer and normal duodenal tissues was screened to identify novel pathways with an absolute multiple of change of cancer-to-normal ratio of > 1.5. In total, 9097 genes were upregulated in the five cancer specimens, while 4891 genes were downregulated. In a comparison of the recurrence status of ampullary cancer patients, we found that 675 genes were upregulated in patients with recurrence, whereas 895 genes had high expression in patients without recurrence. The 9097 upregulated genes in all five specimens were uploaded to the online DAVID software and compared with KEGG pathways to match gene signatures. Table 1 and Supplementary Table 2 list enriched pathways of upregulated genes in ampullary cancer as analyzed by the KEGG. Upregulated genes were enriched in the PPAR signaling pathway, retinol metabolism, drug metabolism, metabolism of P450, and steroid hormone biosynthesis (Figure 1A). We used REVIGO to summarize long lists of GO terms from overexpressed genes in the cDNA microarray. Based on semantic similarities after merging and replacing the representative subset, non-redundant GO terms were displayed in a semantic space with a cutoff point of 1% (Figure 1B). Relevant biological processes comprised regulation of fatty acid biosynthesis, metabolism of hormones or lipoproteins, the cellular transport system, and lipid catabolic processes. Detailed GO terms and related genes are listed in Supplementary Table 3.
Kyoto Encyclopedia of Genes and Genomes (KEGG) pathway enrichment analysis in ampullary cancer microarray by the Database for Annotation, Visualization and Integrated Discovery (DAVID). This table contains only pathways with p values of < 0.0001
| KEGG_PATHWAY | p value | Genes |
|---|---|---|
| PPAR signaling pathway | 2.05E-11 | ME1, ACOX2, ACOX1, PPARA, ACADM, CPT2, AQP7, PCK2, PCK1, APOA1, CD36, CYP27A1, HMGCS2, CYP7A1, APOC3, FABP1, FABP2, GK, SCP2, SLC27A2, ACSL6, ACSL5, ACAA1, NR1H3, SLC27A4 |
| Retinol metabolism | 2.78E-10 | CYP3A4, CYP3A5, CYP3A7, CYP1A1, CYP2C19, CYP2C18, CYP2C9, CYP2B6, ADH6, RDH5, ALDH1A1, UGT1A6, UGT1A8, DGAT1, LRAT, DGAT2, ADH4, UGT2B11, UGT2A3, UGT2B10, UGT2B7, RETSAT |
| Drug metabolism | 4.65E-09 | CYP3A4, GSTA2, CYP3A5, CYP3A7, CYP2C19, GSTA5, CYP2C18, CYP2C9, CYP2B6, MAOA, MAOB, CYP2D6, ADH6, FMO4, FMO5, UGT1A6, UGT1A8, ADH4, UGT2B11, UGT2B10, UGT2A3, UGT2B7 |
| Metabolism of xenobiotics by cytochrome P450 | 1.61E-08 | CYP3A4, GSTA2, CYP3A5, CYP3A7, CYP1A1, CYP2C19, GSTA5, CYP2C18, CYP2C9, CYP2B6, CYP2S1, ADH6, DHDH, AKR1C3, UGT1A6, UGT1A8, ADH4, UGT2B11, UGT2B10, UGT2A3, UGT2B7 |
| Steroid hormone biosynthesis | 2.24E-06 | CYP3A4, CYP3A5, CYP3A7, CYP1A1, HSD17B2, AKR1C3, UGT1A6, UGT1A8, CYP7A1, UGT2B11, HSD11B2, HSD17B3, UGT2B10, SULT1E1, UGT2A3, UGT2B7 |
| Fatty acid metabolism | 2.27E-06 | ACAA2, ACOX1, ACADSB, CPT2, ACADM, ACADS, ADH4, ADH6, ACAT1, HADHA, ACSL6, ACAA1, ACSL5, HADHB |
| Linoleic acid metabolism | 1.34E-05 | CYP3A4, CYP3A5, CYP2J2, AKR1B15, CYP3A7, CYP2C19, CYP2C18, CYP2C9, AKR1B10, PLA2G12B, PLA2G1B, PLA2G2A |
| Arachidonic acid metabolism | 2.79E-05 | CYP2J2, CYP2C19, CYP2C18, CYP2C9, CYP2B6, EPHX2, GGT1, AKR1C3, CBR1, PLA2G12B, GPX3, PLA2G1B, PLA2G2A, CYP4F3, CYP4F2 |
| Arginine and proline metabolism | 6.70E-05 | ACY1, NAGS, OTC, MAOA, SAT2, MAOB, AGMAT, CPS1, CKMT1A, GLS, ARG2, PRODH2, OAT, PRODH |
Abbreviations: PPAR, peroxisome proliferator-activated receptor.
Complementary (c)DNA microarray comparing gene expressions in ampullary cancer with those of normal duodenal tissues. (A) The heatmap shows gene rankings from the highest to lowest after normalization. The peroxisome proliferator-activated receptor (PPAR) signaling pathway had the highest expression. The top 25 Kyoto Encyclopedia of Genes and Genomes (KEGG) pathways are listed with their p values. (B) Gene Ontology (GO) scatterplot constructed by REVIGO. Individual circles indicate representative clusters. The color of the circles indicates p values of the GO analysis (legend in the upper left-hand corner). The size of the circles indicates the frequency of the GO term in the underlying database; the larger the circle, the higher the frequency of gene expression.
MetaCore pathway analysis of gene expression in ampullary cancer
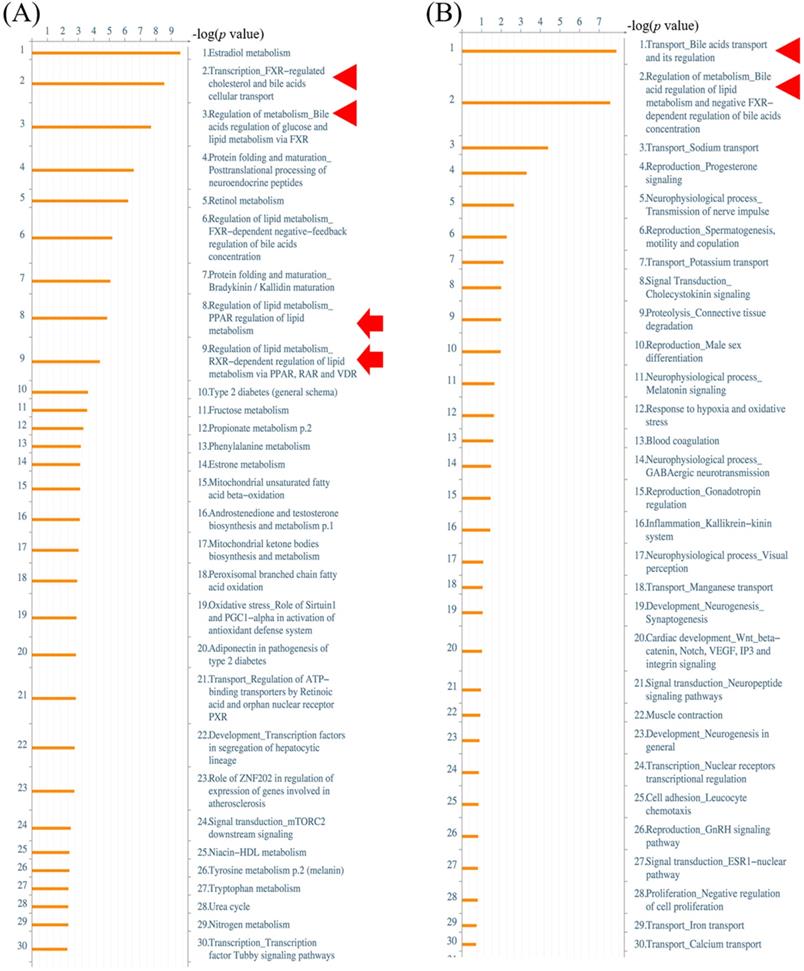
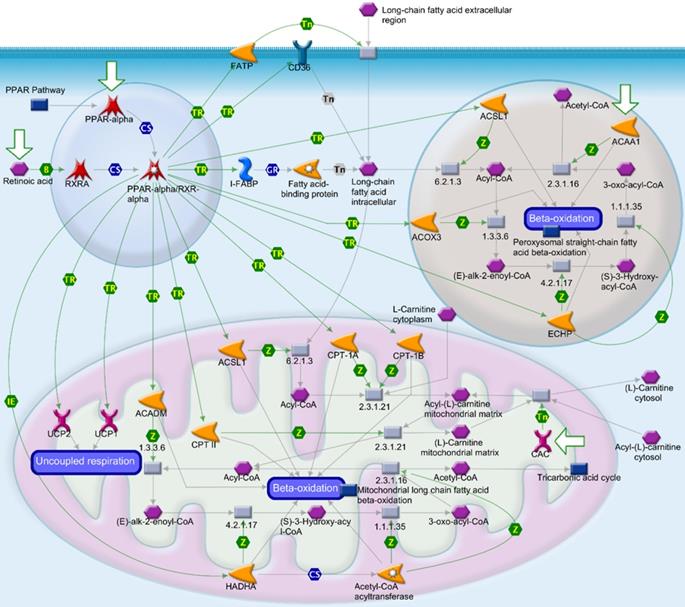
Alterations of gene expressions between ampullary cancer and normal duodenal tissues were analyzed using the MetaCore/GeneGO database. MetaCore contains various biomolecular interactions, such as protein-protein, protein-DNA, and protein-metabolite interactions, with relevant signal pathways. The top 5% of significantly differentially expressed genes (DEGs) between paired samples of ampullary cancer and matched normal tissues were uploaded to MetaCore. Based on upregulated genes in ampullary cancer, transport and regulation of bile acid was the most significant pathway with a p value of 2.757 × 10⁻⁹ (arrowhead in Figure 2A, B). This result was consistent with previous studies suggesting the importance of the bile acid-related pathway in ampullary cancer [9]. Moreover, MetaCore results indicated that “Regulation of lipid metabolism PPAR regulation of lipid metabolism (p = 1.592 × 10⁻⁵) and “Regulation of lipid metabolism RXR-dependent regulation of lipid metabolism via PPAR, RAR and VDR” (RAR, retinoic acid receptor; VDR, vitamin D receptor; p = 4.734 × 10⁻⁵) ranked in the top significant pathways in ampullary cancer (arrow in Figure 2A). The PPAR-α/RXR-α signaling pathways act in energy provision, mitochondrial metabolism, and cellular homeostasis. Multiples of change of gene expressions between ampullary cancer and normal duodenal tissues were analyzed by a default algorithm in network visualization of MetaCore. The PPAR-α signaling pathway was the center of the signaling networks. All of these pathways are essential to the survival of cancer cells (Figure 3). Therefore, the PPAR-α signaling and lipid metabolism-related pathways were selected to investigate the mechanism of carcinogenesis in ampullary cancer.
MetaCore analysis of a complementary (c)DNA microarray of ampullary cancer. (A) Multiples of altered gene expressions between ampullary cancer and normal duodenal tissues are classified according to GeneGO PATHWAY maps. The list begins with those with the lowest p values, and the top 5% are shown. (B) GeneGO NETWORKS analysis indicated that differentially expressed genes were highly correlated with networks of signal pathways. The 30 most significant networks are listed. Bile acid-associated pathways are marked with arrowheads and lipid metabolism-related signal pathways with arrows.
Peroxisome proliferator-activated receptor (PPAR) signaling pathway in the MetaCore analysis. The network begins from PPAR (upper left-hand corner) and expands to the entire cell. B, binding; CM, covalent modification; +P, phosphorylation; T, transformation; Tn, transport; Z, catalysis; TR, transcription regulation; IE, influence on expression; GR, group relation; CS, complex subunit. A green arrow represents (positive) activation of the process. A red arrow represents (negative) inhibition of the process. A gray arrow represents an unspecified process.
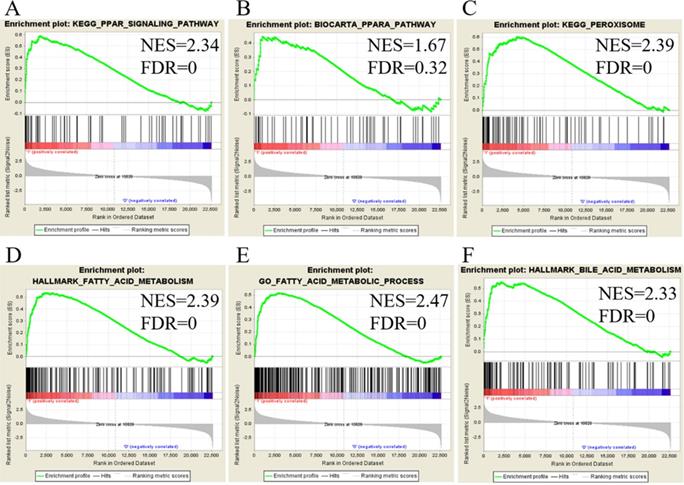
Extracellular matrix-related pathways in the GSEA
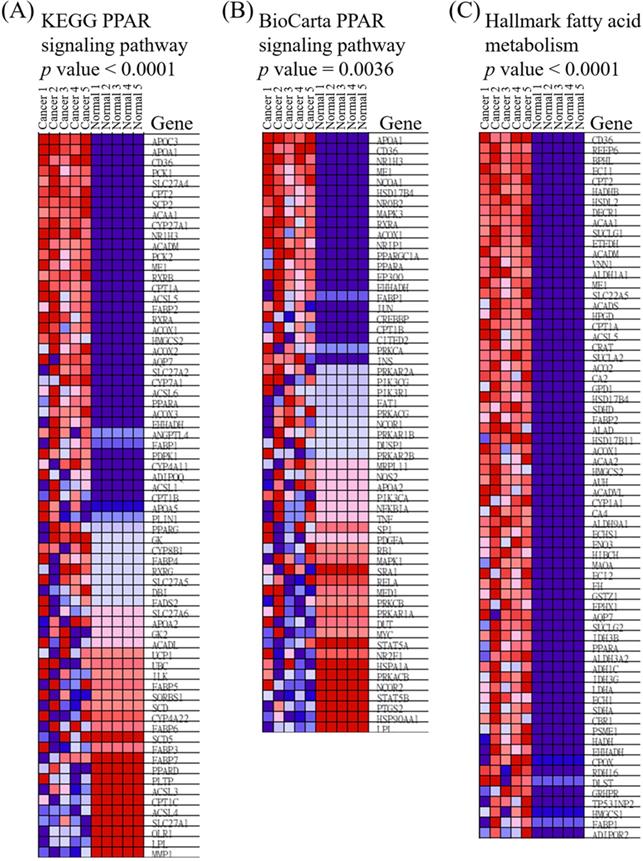
We utilized public databases to verify the importance of targeted pathways as shown in Figure 2. DEGs in ampullary cancer were analyzed. Enriched pathways included the PPAR signaling pathway (Figure 4A, B), peroxisome-related signaling (Figure 4C), and metabolism of fatty acids (Figure 4D, E) and bile acids (Figure 4F). The analytic software included KEGG (Figure 4A, C), BioCarta (Figure 4B), Hallmark (Figure 4D, F), and GO (Figure 4E). In a comparison between ampullary cancer and corresponding normal duodenal tissues, upregulated genes are shown in red in Figure 5. Genes in ampullary cancer that were upregulated compared to those in normal duodenal tissues were analyzed using the GSEA to identify carcinogenesis-related genes. The PPAR signaling (KEGG in Figure 5A and BioCarta in Figure 5B) and lipid metabolism pathways (Hallmark in Figure 5C) were enhanced in all five ampullary cancer cases examined. Altogether, PPAR and lipid metabolism-related genes were enriched in three different datasets, suggesting their crucial roles in ampullary cancer development.
Analysis of upregulated genes in ampullary cancer by the Kyoto Encyclopedia of Genes and Genomes (KEGG), BioCarta, Gene Ontology (GO), and Hallmark databases. The enrichment score (y-axis) reflects the increased degree of associated genes in ampullary cancer (Y = 1 = cancer) compared to normal duodenal tissues (Y = 0 = normal). The green line indicates the evolution of the density of genes identified in the microarray dataset. The horizontal bar in a gradation of red to blue represents the rank of genes in the ordered dataset. Genes on the left side (red) were correlated with the most strongly associated ones, while genes on the right side (blue) are those with negative correlation. Each solid bar in the middle represents each gene within a gene set. A normalized enrichment score (NES) was employed to compute the density of modified genes in the microarray with random expectancies. The false discovery rate (FDR) is the estimated probability with a given NES and is represented as a false positive finding. All p values were < 0.001. (A) Peroxisome proliferator-activated receptor (PPAR) signaling in the KEGG. (B) PPARA signaling in BioCarta. (C) Peroxisome in the KEGG. (D) Fatty acid metabolism in Hallmark. (E) Fatty acid metabolism in GO. (F) Bile acid metabolism in Hallmark.
Heatmap of expressed genes in ampullary cancer and normal duodenal tissues. (A) Peroxisome proliferator-activated receptor (PPAR) signaling pathway in the Kyoto Encyclopedia of Genes and Genomes (KEGG). (B) PPAR in BioCarta. (C) Fatty acid metabolism in Hallmark. The color gradient matches the ranking of particular genes in ampullary cancer. Red indicates upregulation, and blue indicates downregulation.
External validation in public high-throughput databases
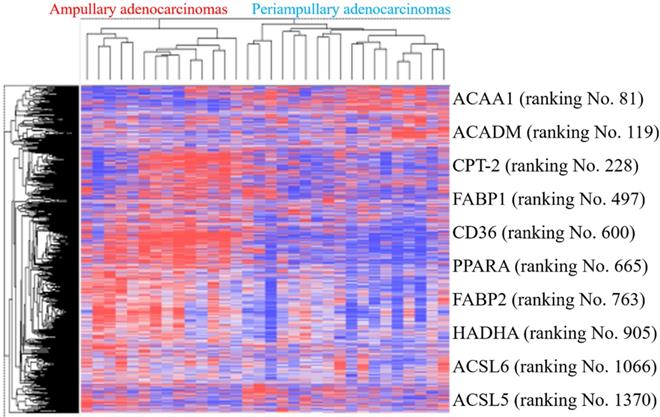
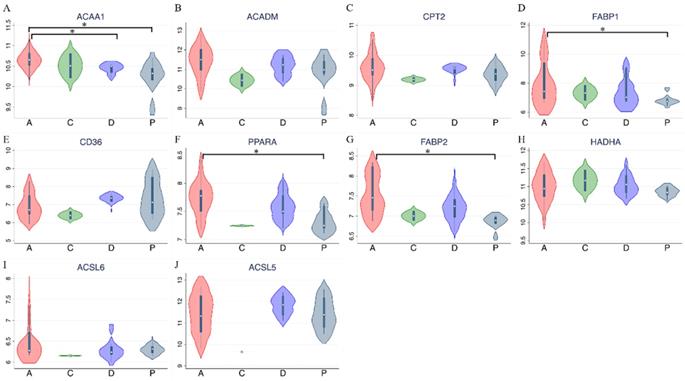
PPAR and lipid metabolism-related signaling genes are highly expressed in ampullary cancer compared to normal tissues (Figures 1~4). To validate our findings and correlate them with a previous study, the GSE39409 dataset was downloaded from the National Center for Biotechnology Information Gene Expression Omnibus (NCBI GEO) database. This dataset is composed of microarray data of 32 untreated periampullary adenocarcinomas and was analyzed by the Affymetrix U133 Plus 2.0 genome array (including 14 ampullary, eight pancreatic, eight duodenal, and two extrahepatic biliary cholangiocarcinomas) [12]. A heatmap was chosen to display these data due to the high dimensions, efficiency, and speed. Microarray data were categorized into two groups: patients with ampullary adenocarcinomas (n = 14) and patients with other periampullary adenocarcinomas (n = 18). The heatmap of gene expression rankings indicated that PPARA and lipid metabolism-related genes were highly expressed in ampullary adenocarcinomas compared to periampullary adenocarcinomas. As seen in Figure 6, ten genes associated with PPARA and lipid metabolism ranked in the top 5% of 54,675 detected genes in the microarray. PPARA and lipid metabolism-related genes can serve as important biomarkers in ampullary cancer patients. Previous research indicated that these genes may contribute to carcinogenesis [35]. Expression levels of these 10 genes in the GSE39409 dataset were represented in a violin plot to demonstrate differences among ampullary adenocarcinomas, cholangiocarcinomas, and duodenal and pancreatic adenocarcinomas (Figure 7). Increased expressions of ACAA1 (acetyl-CoA acyltransferase 1, Figure 7A), FABP1 (fatty acid-binding protein 1, Figure 7D), PPARA (Figure 7F), and FABP2 (Figure 7G) genes were seen in ampullary adenocarcinomas compared to pancreatic adenocarcinomas. Trends of higher expressions of other lipid metabolism-related genes in ampullary adenocarcinoma were also detected (ACADM in Figure 7B, CPT2 in Figure 7C, HADHA in Figure 7H). Expressions of some genes were similar in all of these periampullary adenocarcinomas (CD46 in Figure 7E, ACSL6 in Figure 7I, and ACSL5 in Figure 7J).
Heatmap of expression (cancer/normal) ratios in the GSE39409 dataset. The top highly expressed genes in ampullary cancer tissues were identified by hierarchical clustering with Pearson's coefficient. Genes in the heatmap represent the top 10% of genes with the highest correlation coefficients in ampullary adenocarcinomas compared to periampullary adenocarcinomas. Genes listed on the right side include peroxisome proliferator-activated receptor alpha (PPARA) signaling and lipid metabolism-related ones.
Expression levels of target genes in the GSE39409 dataset. Violin plots for targeted genes in peroxisome proliferator-activated receptor alpha (PPARA) and lipid metabolism-related pathways, including (A) ACAA1; (B) ACADM; (C) CPT2; (D) FABP1; (E) CD36; (F) PPARA; (G) FABP2; (H) HADHA; (I) ACSL6; (J) ACSL5. A, ampullary adenocarcinoma; C, extrahepatic biliary cholangiocarcinoma; D, duodenal adenocarcinoma; P, pancreatic adenocarcinoma; * p < 0.05 after the Bonferroni correction was applied.
Expression of lipid metabolism-related genes in ampullary cancers
A qPCR and semiquantitative RT-PCR were used to compare expressions of lipid-metabolism genes in cell lines from ampullary cancer and other cancers. Increased expressions of PPARA1, ACAA1, FABP1, and FABP2 were detected in SNU-478 ampullary cancer cells compared to pancreatic cancer cells (Pan1 and MIA-Pan2) and gastric cancer cells (AGS) by qPCR (Supplementary Figure 2A-D). Expression of PPARA in TGBC-18 TKB ampullary cancer cells was higher in gastric cancer cells (AGS and MKN45) and colon cancer cells (HCT116) by semiquantitative RT-PCR (Supplementary Figure 2E-F). Expression of PPARA mRNA in ampullary cancer cell lines was higher than in other cancer cell lines. The PPAR-α protein was detected by IHC staining. Low expression of the PPAR-α protein was detected in three and high PPAR-α expression in eight of 11 samples (Supplementary Figure 3). These validated data were consistent with our bioinformatics analysis; therefore, these genes may play crucial roles in cancer development and could serve as potential biomarkers in ampullary cancer patients.
Identification of potential inhibitory compounds with CMap and their validation in ampullary cancer cell lines
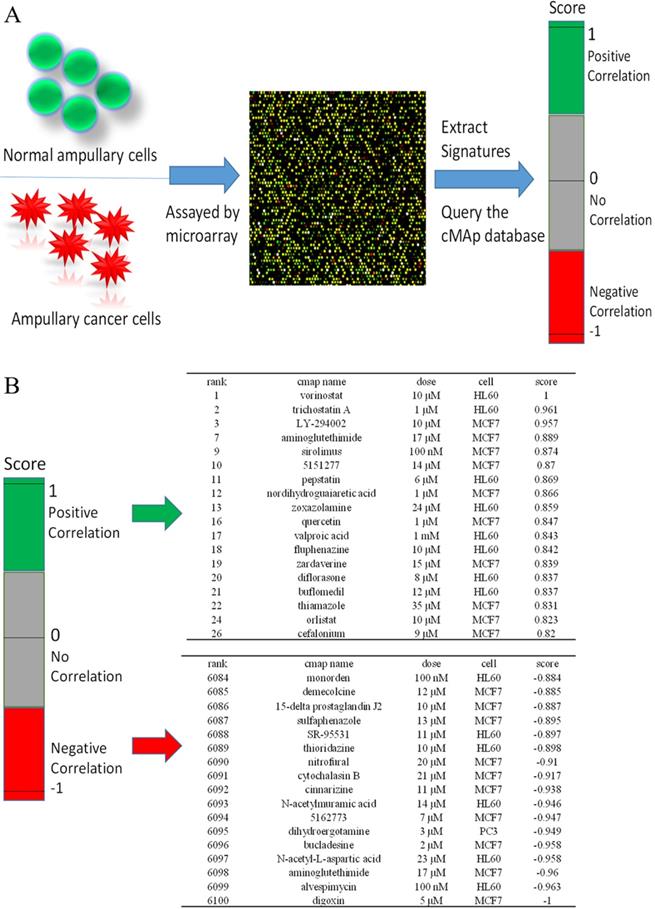
We used CMap to investigate potential drugs that may inhibit upregulated genes in ampullary cancer. One of the advantages of CMap is its ability to predict the efficacy of drugs based on transcriptional expressions of genes. We collected information from 1309 chemicals in total, for which more than 7000 treatments with different dosages were provided in CMap. Detailed drug candidates are listed in Supplementary Table 4. Molecules with the most negative correlations had the highest potential for therapeutic effects against ampullary cancer (Figure 8A), including digoxin (medication for atrial fibrillation and heart failure), alvespimycin (17-dimethylaminoethylamino-17-demethoxygeldanamycin, an analogue of the antineoplastic drug, geldanamycin), aminoglutethimide (blocks the formation of adrenal steroids and estrogen), N-acetyl-L-aspartic acid (for synthesis of neurotransmitters), bucladesine (a cyclic nucleotide derivative), dihydroergotamine (a vasoconstrictor), compound 5162773 (trichostatin A, a reversible inhibitor of histone deacetylase (HDAC)), N-acetylmuramic acid (part of bacterial cell walls), cinnarizine (an antihistamine), and cytochalasin B (blocks formation of contractile microfilaments) (Figure 8B).
Connectivity Map (CMap) analysis based on differential expressions of genes in the microarray. (A) Flowchart of the study protocol. Results of the CMap analysis are represented as +1 (top, lowest potential of inhibition) to -1 (bottom, highest potential of inhibition). Drugs with a positive score are presented in green, while those with negative connectivity score are displayed in red. (B) The top 18 and the bottom 17 drugs were ranked according to their score.
The cytotoxic abilities of alvespimycin, cytochalasin B, and trichostatin A were examined by a cell proliferation assay (Supplementary Figure 4). Alvespimycin suppressed the growth of SNU-478 and TGBC-18 TKB cells with a higher dose of 10 μM and trichostatin A with a lower dose of 1 μM. Cytochalasin B only had a weak ability as a cytostatic compound. IC50 levels are shown in Supplementary Figure 5. After treatment for 48 h, only trichostatin A had a lower IC50 for SNU-478 (0.047 μM) and TGBC-18 TKB cells (0.159 μM). Alvespimycin and cytochalasin B had extremely high IC50 levels.
Discussion
Ampullary adenocarcinomas are a rare periampullary cancer with 5-year cancer-specific survival rates of 30%~50% [36-38]. Adjuvant chemoradiotherapy fails to improve survival [6]. Survival rates of ampullary cancer patients differ from those with other periampullary cancers, which implies distinct carcinogenic mechanisms [39]. In the present study, we utilized a cDNA microarray from five pairs of ampullary cancer and normal duodenal tissues to study the carcinogenic mechanism. After the bioinformatic analyses with KEGG, BioCarta, Hallmark, Reactome, NCBI GEO, and MetaCore from the GeneGO databases, PPAR-α and lipid metabolism-related pathways were found to be the most critical signaling pathways in ampullary cancer. Under the CMap investigation, potential drugs targeting cancer cells with upregulated genes from microarray results were identified. These drugs could potentially be effective in treating ampullary cancer in the future.
Several biomarkers for prognostic prediction of ampullary cancer patients were identified in previous studies [7-9]. However, the techniques used in those studies were limited and might not be representative of the cancer-related pathways. Further, it is difficult to identify novel biomarkers by tissue microarrays because of cancer heterogeneity [40]. To address this problem, we collected fresh ampullary cancer and normal duodenal tissues. Holistic high-throughput technology with a cDNA microarray was performed to detect whole gene expressions. For the GSEA of microarray data, KEGG [41], BioCarta [42], Hallmark [43], Reactome [44], NCBI GEO [45], and MetaCore from GO [46] are popular databases. These platforms were seldom applied in studies of ampullary cancer; however, we utilized all of these bioinformatics approaches to identify potential pathways in the carcinogenesis of ampullary cancer (Supplementary Figure 1). Our analysis demonstrated that PPAR and lipid metabolism-related pathways (Figure 1), such as “Regulation of lipid metabolism PPAR regulation of lipid metabolism” and “Regulation of lipid metabolism RXR-dependent regulation of lipid metabolism via PPAR, RAR, and VDR” (Figure 2) were important in ampullary cancer. Further analyses with KEGG, BioCarta, Hallmark, Reactome, and GO also indicated that PPARA and lipid metabolism-related genes were enhanced in ampullary cancer (Figures 3~5). Due to the limited sample size of our study, the public database GSE39409 from NCBI GEO was selected to provide external validation. A heatmap study of GSE39409 further supported PPARA and lipid metabolism-related genes being highly correlated with carcinogenesis of ampullary adenocarcinomas, but not other periampullary adenocarcinomas (Figures 6, 7). We also found PPARA expression in cell lines and clinical samples from ampullary cancer (Supplementary Figure 2, 3). These findings will contribute to a new understanding of the molecular mechanisms of ampullary cancer.
PPAR proteins consist of three types: PPAR-α, PPAR-β (also called PPAR-δ), and PPAR-γ. There are some differences in tissue distributions, ligands, and target specificities among these family members [47]. PPAR-α is highly expressed in tissues with intensive fatty acid oxidation, such as the liver, heart, muscles, kidneys, and cells of arterial walls. One group of its physiological ligands is long-chain fatty acids. RXR-α and PPAR-α form a heterodimer that acts on peroxisome proliferator response elements and controls expressions of numerous genes in fatty acid oxidation [48]. PPAR-α regulates expressions of major genes in fatty acid oxidation and represents a key point of lipid metabolism [49]. Downstream genes of PPAR-α include acyl-CoA synthetase long-chain family member 1/5 (ACSL1/5), mitochondrial medium-chain acyl-CoA dehydrogenase (ACADM), mitochondrial enoyl-CoA hydratase/3-hydroxy acyl-CoA dehydrogenase (HADHA), and ACAA1. PPAR-α also controls expressions of genes which enable cellular transport of fatty acids and their derivatives, such as cluster of differentiation 36 (CD36), carnitine palmitoyltransferase 1A (CPT1A), 1B (CPT1B), and 2 (CPT2), and FABP2 [50]. PPAR-α was reported to play important roles in various cellular activities, including proliferation, metabolism, homeostasis, and tumorigenesis [51]. PPAR-α promotes proliferation of breast cancer cells [52]. Inhibition of PPARA gene induces immunogenic death of proliferating chronic lymphocytic leukemia cells [53]. On the other hand, PPAR-α agonists inhibit the growth of gliomas and cancers of the colon, lung, and ovaries [17]. Thus, the function of PPAR-α in tumorigenesis is still controversial. In the present study, cDNA microarrays from five paired ampullary cancer and normal duodenal tissues were first studied, and then the GSE39409 dataset was utilized for validation. Upregulation of PPAR-α signaling was detected in both analyses. Expressions of PPARA mRNA and PPAR-α protein were also detected in clinical samples and cell lines of ampullary cancer. Our results implied that PPAR-α may promote the carcinogenesis of ampullary cancer.
Since traditional chemoradiotherapy fails to improve the survival of ampullary cancer patients [5], we searched potential FDA-approved drugs for ampullary cancer using CMap software. In CMap, alterations of gene expressions were recorded in cell lines treated with potential bioactive molecules (Figure 8A). The union of upregulated genes is positively correlated with certain drugs, and those drugs are presumed to be cancer promoters. On the contrary, upregulated genes are negatively correlated with other drugs, and those drugs are assumed to be cancer inhibitors. In our results, the top ten drugs with negative correlations included digoxin, alvespimycin, aminoglutethimide, N-acetyl-L-aspartic acid, bucladesine, dihydroergotamine, compound 5162773, N-acetylmuramic acid, cinnarizine, and cytochalasin B (Figure 8B). Alvespimycin binds to heat shock protein 90 (Hsp90), leading to its degradation and suppression of cell cycle progression [54]. The HDAC inhibitor, compound 5162773 (trichostatin A), suppresses acetylation of chromosomes and restrains gene expressions in cancer cells [55]. Cytochalasin B is a microfilament-directed agent with cytotoxic ability against lung carcinomas and melanomas [56]. We tested the cytotoxic abilities of alvespimycin, cytochalasin B, and trichostatin A in ampullary cancer cell lines (Supplementary Figure 4, 5). Trichostatin A had the strongest ability to suppress proliferation with the lowest IC50. The drug and/or its derivatives are potential drugs that could improve the survival status of ampullary cancer patients.
In conclusion, the present study combined a cDNA microarray in our institution and the online GSE39409 database to investigate carcinogenic mechanisms of ampullary cancer. Our results identified PPARA and lipid metabolism-related genes as being upregulated in ampullary cancer. These genes are conceivable biomarkers for diagnosis of ampullary cancer and also provide hints to identify potential antineoplastic agents. According to results of CMap and cellular experiments, the HDAC inhibitor, trichostatin A, is a potential drug for ampullary cancer patients. Thus, the present study provides a theoretical basis for further research.
Supplementary Material
Supplementary figures and tables.
Acknowledgements
Bioinformatics analyses and data mining were conducted at Taipei Medical University and the Bioinformatics Core at National Cheng Kung University. The authors give special thanks to Mr. Dan Chamberlin for his professional English editing at the Office of Research and Development at Taipei Medical University. The authors are grateful for the support from the Human Biobank, Research Center of Clinical Medicine, National Cheng Kung University Hospital. We are blessed with support from the late superintendent, Professor Pin-wen Lin. Furthermore, we thank Miss Ya-Li Hsiao for technical support. The study was supported by the Ministry of Science and Technology (MOST) of Taiwan (grants MOST105-2325-B-006-003 to M-D. L., MOST 108-2314-B-006-082 to H-P. H., and MOST109-2320-B-038-009-MY2 to C-Y.W.), and Taipei Medical University (grant TMU-108-AE1-B16 to C-Y. W.).
Availability of data and materials
The datasets used and/or analyzed during the current study are available from the corresponding author upon reasonable request.
Competing Interests
The authors have declared that no competing interest exists.
References
1. Albores-Saavedra J, Schwartz AM, Batich K, Henson DE. Cancers of the ampulla of vater: demographics, morphology, and survival based on 5,625 cases from the SEER program. J Surg Oncol. 2009;100:598-605
2. Showalter TN, Zhan T, Anne PR, Chervoneva I, Mitchell EP, Yeo CJ. et al. The influence of prognostic factors and adjuvant chemoradiation on survival after pancreaticoduodenectomy for ampullary carcinoma. J Gastrointest Surg. 2011;15:1411-1416
3. Hsu HP, Yang TM, Hsieh YH, Shan YS, Lin PW. Predictors for patterns of failure after pancreaticoduodenectomy in ampullary cancer. Ann Surg Oncol. 2007;14:50-60
4. Doepker MP, Thompson ZJ, Centeno BA, Kim RD, Wong J, Hodul PJ. Clinicopathologic and survival analysis of resected ampullary adenocarcinoma. J Surg Oncol. 2016;114:170-175
5. Ecker BL, Vollmer CM, Behrman SW, Allegrini V, Aversa J, Ball CG. et al. Role of adjuvant multimodality therapy after curative-intent resection of ampullary carcinoma. JAMA surgery. 2019;154:706-714
6. Kim ST, Lee J, Lee KT, Lee JK, Lee KH, Choi SH. et al. The efficacy of frontline platinum-based combination chemotherapy in advanced adenocarcinoma of the ampulla of Vater. Med Oncol. 2010;27:1149-1154
7. Wu CL, Chao YJ, Yang TM, Chen YL, Chang KC, Hsu HP. et al. Dual role of CD44 isoforms in ampullary adenocarcinoma: CD44s predicts poor prognosis in early cancer and CD44. is an indicator for recurrence in advanced cancer. BMC Cancer. 2015;15:903
8. Perysinakis I, Minaidou E, Mantas D, Sotiropoulos GC, Leontara V, Tsipras H. et al. Differentiation and prognostic markers in ampullary cancer: Role of p53, MDM2, CDX2, mucins and cytokeratins. Pathol Res Pract. 2016;212:1039-1047
9. Chen MJ, Chen YL, Wang TW, Hsu HP, Lai MD. Membrane bile acid receptor TGR5 predicts good prognosis in ampullary adenocarcinoma patients with hyperbilirubinemia. Oncol Rep. 2016;36:1997-2008
10. Sharma R, Singh R, Bhardwaj J. Scanning and transmission electron microscopic analysis of ampullary segment of oviduct during estrous cycle in caprines. Scanning. 2015;37:36-41
11. Andreotti G, Chen J, Gao Y-T, Rashid A, Chen BE, Rosenberg P. et al. Polymorphisms of genes in the lipid metabolism pathway and risk of biliary tract cancers and stones: a population-based case-control study in Shanghai, China. Cancer Epidemiol Biomarkers Prev. 2008;17:525-534
12. Overman MJ, Zhang JX, Kopetz S, Davies M, Jiang ZQ, Stemke-Hale K. et al. Gene expression profiling of ampullary carcinomas classifies ampullary carcinomas into biliary-like and intestinal-like subtypes that are prognostic of outcome. PLoS One. 2013;8:e65144
13. Lamb J, Crawford ED, Peck D, Modell JW, Blat IC, Wrobel MJ. et al. The connectivity map: Using gene-expression signatures to connect small molecules, genes, and disease. Science. 2006;313:1929-1935
14. Grygiel-Gorniak B. Peroxisome proliferator-activated receptors and their ligands: nutritional and clinical implications - a review. Nutr J. 2014 13
15. Pandey MK, Gupta SC, Nabavizadeh A, Aggarwal BB. Regulation of cell signaling pathways by dietary agents for cancer prevention and treatment. Semin Cancer Biol. 2017;46:158-181
16. Liu YL, Lin LC, Tung YT, Ho ST, Chen YL, Lin CC. et al. Rhododendron oldhamii leaf extract improves fatty liver syndrome by increasing lipid oxidation and decreasing the lipogenesis pathway in mice. International journal of medical sciences. 2017;14:862
17. Gao JM, Yuan SP, Jin JH, Shi JJ, Hou YZ. PPAR alpha regulates tumor progression, foe or friend? Eur J Pharmacol. 2015;765:560-564
18. Edge SB, Compton CC. The American Joint Committee on Cancer: the 7th edition of the AJCC cancer staging manual and the future of TNM. Annals of surgical oncology. 2010;17:1471-1474
19. Lawson DA, Bhakta NR, Kessenbrock K, Prummel KD, Yu Y, Takai K. et al. Single-cell analysis reveals a stem-cell program in human metastatic breast cancer cells. Nature. 2015;526:131-135
20. Hsu HP, Wang CY, Hsieh PY, Fang JH, Chen YL. Knockdown of serine/threonine-protein kinase 24 promotes tumorigenesis and myeloid-derived suppressor cell expansion in an orthotopic immunocompetent gastric cancer animal model. J Cancer. 2020;11:213
21. Hagerling C, Gonzalez H, Salari K, Wang C-Y, Lin C, Robles I. et al. Immune effector monocyte-neutrophil cooperation induced by the primary tumor prevents metastatic progression of breast cancer. Proceedings of the National Academy of Sciences. 2019;116:21704-21714
22. Wang CY, Chiao CC, Phan NN, Li CY, Sun ZD, Jiang JZ. et al. Gene signatures and potential therapeutic targets of amino acid metabolism in estrogen receptor-positive breast cancer. Am J Cancer Res. 2020;10:95
23. Subramanian A, Tamayo P, Mootha VK, Mukherjee S, Ebert BL, Gillette MA. et al. Gene set enrichment analysis: A knowledge-based approach for interpreting genome-wide expression profiles. P Natl Acad Sci USA. 2005;102:15545-15550
24. Sun Z, Wang CY, Lawson DA, Kwek S, Velozo HG, Owyong M. et al. Single-cell RNA sequencing reveals gene expression signatures of breast cancer-associated endothelial cells. Oncotarget. 2018;9:10945
25. Huang DW, Sherman BT, Lempicki RA. Systematic and integrative analysis of large gene lists using DAVID bioinformatics resources. Nat Protoc. 2009;4:44-57
26. Liu HL, Yeh IJ, Phan NN, Wu YH, Yen MC, Hung JH. et al. Gene signatures of SARS-CoV/SARS-CoV-2-infected ferret lungs in short-and long-term models. Infect Genet Evol. 2020;85:104438
27. Phan NN, Liu S, Wang CY, Hsu HP, Lai MD, Li CY. et al. Overexpressed gene signature of EPH receptor A/B family in cancer patients-comprehensive analyses from the public high-throughput database. Int J Clin Exp Pathol. 2020;13:1220
28. Supek F, Bosnjak M, Skunca N, Smuc T. REVIGO summarizes and visualizes long lists of gene ontology terms. PLoS One. 2011;6:e21800
29. Wang CY, Chang YC, Kuo YL, Lee KT, Chen PS, Cheung CHA. et al. Mutation of the PTCH1 gene predicts recurrence of breast cancer. Scientific reports. 2019;9:1-14
30. Wang CY, Lai MD, Phan NN, Sun Z, Lin YC. Meta-analysis of public microarray datasets reveals voltage-gated calcium gene signatures in clinical cancer patients. PLoS One. 2015;10:e0125766
31. Phan NN, Wang CY, Lin YC. The novel regulations of MEF2A, CAMKK2, CALM3, and TNNI3 in ventricular hypertrophy induced by arsenic exposure in rats. Toxicology. 2014;324:123-135
32. Do DT, Phan NN, Wang CY, Sun Z, Lin YC. Novel regulations of MEF2-A, MEF2-D, and CACNA1S in the functional incompetence of adipose-derived mesenchymal stem cells by induced indoxyl sulfate in chronic kidney disease. Cytotechnology. 2016;68:2589-2604
33. Lamb J. Innovation - The Connectivity Map: a new tool for biomedical research. Nat Rev Cancer. 2007;7:54-60
34. Ung MH, Sun CH, Weng CW, Huang CC, Lin CC, Liu CC. et al. Integrated drug expression analysis for leukemia: an integrated in silico and in vivo approach to drug discovery. Pharmacogenomics J. 2017;17:351-359
35. Long J, Zhang CJ, Zhu N, Du K, Yin YF, Tan X. et al. Lipid metabolism and carcinogenesis, cancer development. Am J Cancer Res. 2018;8:778
36. O'Connell JB, Maggard MA, Manunga J Jr, Tomlinson JS, Reber HA, Ko CY. et al. Survival after resection of ampullary carcinoma: a national population-based study. Ann Surg Oncol. 2008;15:1820-1827
37. Cheng LC, Chao YJ, Overman MJ, Wang CY, Phan NN, Chen YL. et al. Increased expression of secreted frizzled related protein 1 (SFRP1) predicts ampullary adenocarcinoma recurrence. Sci Rep. 2020;10:1-16
38. Cheng LC, Chao YJ, Wang CY, Phan NN, Chen YL, Wang TW. et al. Cancer-derived transforming growth factor-β modulates tumor-associated macrophages in ampullary cancer. Onco Targets Ther. 2020;13:7503
39. Kamarajah SK. Pancreaticoduodenectomy for periampullary tumours: a review article based on Surveillance, End Results and Epidemiology (SEER) database. Clin Transl Oncol. 2018;20:1153-1160
40. Khouja MH, Baekelandt M, Sarab A, Nesland JM, Holm R. Limitations of tissue microarrays compared with whole tissue sections in survival analysis. Oncol Lett. 2010;1:827-831
41. Kanehisa M, Furumichi M, Tanabe M, Sato Y, Morishima K. KEGG: new perspectives on genomes, pathways, diseases and drugs. Nucleic Acids Res. 2017;45:D353-D361
42. Shangguan H, Tan S, Zhang J. Bioinformatics analysis of gene expression profiles in hepatocellular carcinoma. Eur Rev Med Pharmacol Sci. 2015;19:2054-2061
43. Liberzon A, Birger C, Thorvaldsdóttir H, Ghandi M, Mesirov JP, Tamayo P. The molecular signatures database hallmark gene set collection. Cell systems. 2015;1:417-425
44. Fabregat A, Jupe S, Matthews L, Sidiropoulos K, Gillespie M, Garapati P. et al. The reactome pathway knowledgebase. Nucleic Acids Res. 2018;46:D649-D55
45. Barrett T, Wilhite SE, Ledoux P, Evangelista C, Kim IF, Tomashevsky M. et al. NCBI GEO: archive for functional genomics data sets—update. Nucleic Acids Res. 2012;41:D991-D5
46. Schuierer S, Tranchevent L-C, Dengler U, Moreau Y. Large-scale benchmark of Endeavour using MetaCore maps. Bioinformatics. 2010;26:1922-1923
47. Michalik L, Desvergne B, Wahli W. Peroxisome-proliferator-activated receptors and cancers: Complex stories. Nat Rev Cancer. 2004;4:61-70
48. de la Rosa Rodriguez MA, Kersten S. Regulation of lipid droplet-associated proteins by peroxisome proliferator-activated receptors. Biochim Biophys Acta. 2017;1862:1212-1220
49. Kienesberger PC, Pulinilkunnil T, Nagendran J, Dyck JRB. Myocardial triacylglycerol metabolism. J Mol Cell Cardiol. 2013;55:101-110
50. Kersten S. Integrated physiology and systems biology of PPAR alpha. Mol Metab. 2014;3:354-371
51. Peters JM, Shah YM, Gonzalez FJ. The role of peroxisome proliferator-activated receptors in carcinogenesis and chemoprevention. Nat Rev Cancer. 2012;12:181-195
52. Chang NW, Wu CT, Chen DR, Yeh CY, Lin C. High levels of arachidonic acid and peroxisome proliferator-activated receptor-alpha in breast cancer tissues are associated with promoting cancer cell proliferation. J Nutr Biochem. 2013;24:274-281
53. Spaner D, Lee E, Shi Y, Wen F, Li Y, Tung S. et al. PPAR-alpha is a therapeutic target for chronic lymphocytic leukemia. Leukemia. 2013;27:1090-1099
54. Mellatyar H, Talaei S, Pilehvar-Soltanahmadi Y, Barzegar A, Akbarzadeh A, Shahabi A. et al. Targeted cancer therapy through 17-DMAG as an Hsp90 inhibitor: Overview and current state of the art. Biomedicine & Pharmacotherapy. 2018;102:608-617
55. West AC, Johnstone RW. New and emerging HDAC inhibitors for cancer treatment. The Journal of clinical investigation. 2014;124:30-39
56. Trendowski M, Mitchell JM, Corsette CM, Acquafondata C, Fondy TP. Chemotherapy with cytochalasin congeners in vitro and in vivo against murine models. Investigational new drugs. 2015;33:290-299
Author contact
![]() Corresponding author: Hui-Ping Hsu, 138 Sheng-Li Rd. Tainan 70403, Taiwan. E-mail: hphsuncku.edu.tw; Tel.: +886-6-2353535 ext. 5272; Fax: +886-6-2766676.
Corresponding author: Hui-Ping Hsu, 138 Sheng-Li Rd. Tainan 70403, Taiwan. E-mail: hphsuncku.edu.tw; Tel.: +886-6-2353535 ext. 5272; Fax: +886-6-2766676.