Impact Factor ISSN: 1449-1907

 Global reach, higher impact
Int J Med Sci 2020; 17(15):2306-2311. doi:10.7150/ijms.47000 This issue Cite
Research Paper
Study of weight and body mass index on graft loss after transplant over 5 years of evolution
Antonio Liñán González1, Raquel García Pérez1, Juan Bravo Soto2, Rafael Fernández Castillo1 ![]()
1. University of Granada. Faculty of Health Sciences, Parque Tecnológico de Ciencias de la Salud. Avd de la Ilustración 60 CP18016, Granada/Spain.
2. Academic Medical Center Virgen de las Nieves, Nephrology Department. Av. de las Fuerzas Armadas, 2, 18014 Granada Spain.
Received 2020-4-14; Accepted 2020-8-13; Published 2020-8-27
Abstract
Patients frequently experience a weight gain after organ transplantation. This increase in weight is the result of multiple factors, and is usually intensified by glucocorticoids and immunosuppressive drugs. It can also delay graft function and cause serious health problems. The objective of this study was to study the obesity as well as its causes and consequences in kidney transplant patients. The sample population consisted of 282 renal transplant patients, 170 men and 112 women, 18-74 years of age, who were monitored over a period of five years. For the purposes of our research, the patients were divided into two groups: (1) normal weight 18.5 ≤ BMI <25; (2) overweight 25 ≤ BMI ≤30. The association between BMI as an independent variable and graft survival was determined by means of a Cox regression analysis. Overweight patients were characterized by a higher comorbidity prevalence. In the Cox multivariate analysis, the initial BMI, evaluated as a continuous variable continued to be an independent predictor of delayed graft function and chronic nephropathy. This study evaluated the BMI as a continuous value instead of a categorical value. In conclusion, our results suggest that an increase in BMI without categorical variation can be an independent risk factor for graft loss. Consequently, obesity prevention for renal transplant patients should include dietary counseling and management, moderate physical activity, and steroid minimization.
Keywords: Anthropometry, Obesity, BMI, Graft Loss, Kidney Transplant, Overweight
Introduction
Obesity is a serious risk factor for deteriorated kidney function in healthy people as well as for those with chronic kidney disease (CKD) [1]. Although the exact mechanisms that relate obesity to kidney disease are still unclear, it is believed that kidney damage is caused by hemodynamic and hormonal effects [2].
Weight gain frequently occurs after a kidney transplant [3]. In all likelihood, an increased appetite and the easing of dietary restrictions because of hemodialysis and CKD, combined with immunosuppressive treatment and steroids, play an important role in this weight increase [4]. Various research studies indicate that kidney transplant recipients experience an average weight gain of 5-10 kgs, which is linked to a reduction in patient survival and graft failure [5-7].
Furthermore, this weight increment contributes to an adverse cardiovascular risk profile and could be implicated in the pathogenesis of graft dysfunction. The accumulation of abdominal fat can increase the inflammatory mediators produced by adipocytes, such as tumor necrosis factor alpha and interleukin-6, which contribute to interstitial and glomerular fibrosis. Obesity is associated with an increased rate of glomerular filtration, which over time eventually leads to glomerulosclerosis and the subsequent loss of kidney function. Moreover, hypertension caused by the activation of the sympathetic nervous system and renin-angiotensin system can also accelerate the loss of kidney function in obese patients [8,9].
Consequently, post-transplant weight gain is associated with hypertension, diabetes, dyslipidemia, and ischemic heart disease [10]. Obesity-related risks in these patients include the following: (i) skin and soft-tissue complications, such as wound infection; (ii) anastomotic complications (lymphocele, hematoma and vascular); (iii) complications stemming from the intrinsic allograft function (delayed graft function, immune rejection, and graft survival); (iv) systemic complications (sepsis, hospital readmissions, post-transplant diabetes mellitus, and patient survival [11,12]. The aim of this retrospective study was to evaluate the effect of BMI on renal transplant outcome in the normal weight (NW) BMI: 18.5-24.9, and overweight (OW) BMI: 25-30, as well as the effect of immunosuppressive treatment over these 5 years after kidney transplantation.
Materials and Methods
Subjects
The sample population consisted of 282 kidney transplant patients, 170 men and 112 women, 18-74 years of age, who were being treated at the kidney transplant consultation of the Virgen de las Nieves University Hospital in Granada (Spain). The subjects were not randomly selected and their participation in the study was determined by the fact that they periodically visited the consultation for monitoring and check-ups. The patients were monitored over a period of five years. Exclusion criteria were (i) multi-organ transplantation, (ii) previous renal transplantation, (iii) patients <18 yr of age, (iv) obesity (BMI > 30), and (v) underweight (BMI < 18.5). BMI was calculated using weight and height at the time of transplantation. We excluded the obese and under-weight, as each circumstance is known to be a major risk for transplantation with associated confounding considerations [1].
Methods
The immunosuppression regimen was the following: steroids (Ste) associated with mycophenolate mofetil (MMF), Tacrolimus (Tac), CD25, Cyclosporin A, and Thymoglobulin (TMG). During the first four weeks, the patients received 20 mg/day of prednisone, administered in a single morning dose, which was progressively reduced until reaching a maintenance dose of 5-10 mg/day in the third month. The CsA dose, divided into two, was adjusted to maintain trough levels of 150-240 ng/ml during the first six months after transplant, and after that, trough levels of 100-150 ng/ml. The Tacrolimus dose, also divided into two, was adjusted to maintain levels of 10-15 ng/mL during the first three post-transplantation months, after which it was tapered down to 5-8 ng/ml. The MMF dose, divided into two, oscillated between 1-2 gr/day.
In total, four combinations of immunosuppressive drugs were studied. The patients were divided into four groups, each of which received one of the following combinations of drugs: Group 1 [Ste + MMF + Tac + CD25]; Group 2 [Ste + MMF + CsA + CD25]; Group 3: [St + MMF + Tac + TMG]; Group 4 [Ste + MMf + Tac]. In addition, anthropometric measurements of weight and height were performed at 6, 12, 24, 36, 48 and 60 months with a balance/stadiometer (Perperson 113481). Weight was measured in kilograms and height in centimeters. The body mass index was calculated with the following formula: BMI = weight (kg)/[height (m)]2. The patients were divided into two groups: (1) normal weight 18.5 ≤ BMI <25; (2) overweight 25 ≤ BMI ≤30.
On their release from the hospital, the patients were instructed to consume 1.4-1.5 g/kg/day of diet protein (30-35 calories kcal/kg/day) during the first three months after the kidney transplant. Accordingly, they were told that lipids should not constitute more than 30% of the total diet, and that simple sugars should be avoided. After three months, the patients should reduce protein consumption to 1 g/kg/day.
All eligible patients gave informed consent to participate in the study, which was approved by the Human Ethics Committee of our Hospital.
Statistical analysis
Statistical analysis was carried out using the IBM SPSS Statics 20 software package. All values were expressed as frequencies, percentages, and means ± standard deviation (SD). A value of p < 0.05 was considered statistically significant. Continuous variables were compared using the Mann-Whitney U test, whereas categorical variables were compared using Fisher's exact test (Table 1).
Characteristics of normal weight vs. overweight patients
| Normal weight 18.5 ≤BMI <25 n=131 | Overweight 25 ≤ BMI ≤30 n=151 | p-value | |
|---|---|---|---|
| Graft recipient age (mean ± SD) | 37.94 ±13.23 | 46.25 ± 12.64 | 0.000 |
| Gender: Male/Female % | 55 / 45 | 65.3 / 34.7 | NS |
| Dialysis (years) | 3.07 ± 3.31 | 2.74 ± 2.76 | NS |
| Donor age (mean ± SD) | 36.85 ± 18.02 | 41.72 ± 18.10 | 0.000 |
| HLA incompatibilities (≤ 3) n (%) | 46 (35.4) | 62 (41.9) | NS |
| Cold ischemic time (h) mean ± SD | 17.19 (4.8) | 17.46 (5) | NS |
| Delayed graft function n (%) | 70 (53.8) | 83 (55.3) | 0.05 |
| Acute rejection n (%) | 20 (15.3) | 31(20.7) | NS |
| Chronic graft nephropathy n (%) | 44 (33.6) | 60 (40) | 0.05 |
| Diabetes n (%) | 31 (23.7) | 45 (30) | 0.05 |
| Hypertension n (%) | 109 (83.2) | 123 (82) | NS |
Mann-Whitney U test and Fisher's exact test. Recipient age and kidney donor age are significantly greater in the overweight group as compared to the normal weight group. In contrast, there are no significant differences regarding dialysis time and gender. NS: not significant.
To evaluate overweight as a risk factor of kidney deterioration, a Cox regression was used with a confidence interval of 95%. The variables in the analysis were the following: graft recipient age, gender, BMI, dialysis time, kidney donor age, chronic allograft nephropathy, acute rejection, delayed graft function, diabetes, and hypertension (Tables 3 & 4). Analysis of variance (ANOVA) was used to evaluate the differences between weight and immunosuppression treatment (Table 2). All data were expressed as means ± standard deviation (X ± SD). A value of p < 0.05 was considered statistically significant.
Comparison of mean weights by immunosuppressive medication groups. Anova Test
| Mean | Standard deviation | Minimum | Maximum | ||
|---|---|---|---|---|---|
| Initial weight | Group 1 | 68.45 | 11.30 | 41 | 97 |
| Group 2 | 68.33 | 6.74 | 56 | 77.5 | |
| Group 3 | 68.57 | 17.68 | 44 | 97 | |
| Group 4 | 66.70 | 12 | 41 | 98 | |
| Year 1 | Group 1 | 74.48 | 12.83 | 50.1 | 112 |
| Group 2 | 74.96 | 8.93 | 5.6 | 91 | |
| Group 3 | 76.48 | 17.35 | 49.7 | 109.5 | |
| Group 4 | 71.52 | 11.27 | 53.8 | 94.5 | |
| Year 2 | Group 1 | 73.73 | 15.67 | 13.8 | 104 |
| Group 2 | 75.76 | 8.48 | 59.0 | 92.7 | |
| Group 3 | 77.02 | 18.07 | 48.5 | 107.8 | |
| Group 4 | 70.95 | 12,50 | 46.7 | 96.2 | |
| Year 3 | Group 1 | 73.42 | 11.48 | 43.2 | 94.2 |
| Group 2 | 77.30 | 10.25 | 59.2 | 95.6 | |
| Group 3 | 76.99 | 16.19 | 46.6 | 102 | |
| Group 4 | 71.60 | 12.64 | 55.8 | 100.5 | |
| Year 4 | Group 1 | 73.73 | 11.53 | 47.0 | 93 |
| Group 2 | 77.24 | 7.20 | 68.1 | 88.2 | |
| Group 3 | 76.88 | 15.60 | 56.0 | 105.6 | |
| Group 4 | 71.77 | 13.00 | 56.7 | 105.6 | |
| Year 5 | Group 1 | 73.00 | 11.1 | 51.5 | 94 |
| Group 2 | 76.36 | 8.18 | 66.1 | 87.7 | |
| Group 3 | 82.58 | 15.39 | 60.9 | 106.3 | |
| Group 4 | 74.54 | 14.65 | 54.5 | 108.0 |
All groups experienced an average weight gain of 5.5 kg from the first month after transplant until the end of the first year. After that, their weight continued to steadily increase during the following post-transplant years until reaching an average gain of 6.8 kg at the end of the fifth year. This increment was particularly striking in Group 3 in which the five-year weight gain was 14 kg as well as in Group 4, in which the gain was 9 kg.
Group 1: Ste + MMF + Tac + CD25; Group 2: Ste + MMF + CsA + CD25;Group 3: Ste + MMF + Tac + TMG; Group 4: Ste + MMf + Tac.
Univariate hazard ratios (95% CI): five-year graft failure
| Univariate | |
|---|---|
| Graft recipient age | 1.027 (1.020-1.035)* |
| Gender (male vs. female) | 0.852 (0.703-1.030) |
| Initial BMI | 1.101 (1.080-1.122)* |
| Initial BMI (overweight vs. normal weight) | 2.289 (1.890-2.772)* |
| Dialysis time (years) | 0.979 (0.948-1-010) |
| Donor age | 1.015 (1.010-1.021)* |
| Delayed graft function | 1.151 (0.953-1.390) |
| Chronic graft nephropathy | 1.297 (1.071-1.570)* |
| Acute rejection | 0.897 (0.710-1-134) |
| Diabetes | 1.322 (1.081-1.617)* |
| Hypertension | 1.005 (0.790-1.279) |
*p < 0.01. The variables that showed a significant correlation between overweight and post-transplant outcome in the univariate analysis were the following: graft recipient age, BMI, kidney donor age, chronic graft nephropathy and diabetes.
Multivariate hazard ratios (95% CI): five-year graft failure
| Multivariate | ||
|---|---|---|
| Graft recipient age | 1.011 (1.002-1.021)* | |
| Donor age | 1.009 (1.003-1.015)* | |
| BMI of graft recipient | 1.082 (1.058-1.107)* | |
| Delayed graft function | 0.684 (0.493-0.949)* | |
| Chronic graft nephropathy | 1.462 (1.053-2.028)* | |
| Acute rejection | 0. 985 (0.771-1-258) | |
| Diabetes | 0.92 (0.742-1.155) | |
| Hypertension | 0.861 (0.671-1.106) | |
*p < 0.01. The analysis indicated a significant correlation between overweight and graft recipient age, kidney donor age, and initial BMI, which were evaluated as continuous variables, and delayed kidney function and chronic graft nephropathy, which were evaluated as categorical variables. Graft rejection, hypertension, and diabetes were also included in the Cox regression model.
Results
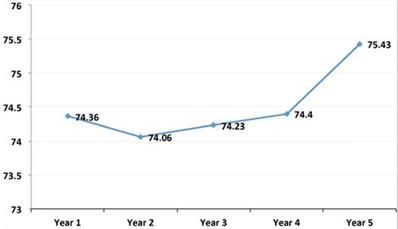
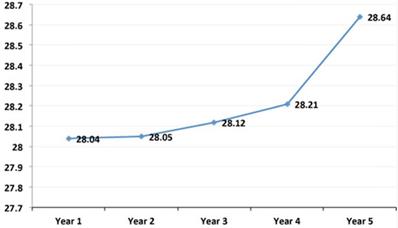
The mean age of the sample population was 44.09 ± 14.04 years; mean weight was 66.24 ± 13.77 Kg; and mean BMI was 25 ± 4.62 Kg/m2. As can be observed, these mean values of weight (Figure 1) and BMI (Figure 2) significantly increased from the first to the fifth year after transplant. Table 1 shows the characteristics of the patient and graft after his/her classification as normal weight or overweight. As reflected in the table, recipient age and kidney donor age are significantly greater in the overweight group as compared to the normal weight group. In contrast, there are no significant differences regarding dialysis time and gender.
Evolution of the mean annual values of the weight in the simple population. As can be observed, these mean values of weight significantly increased from the first to the fifth year after transplant.
Evolution of the mean annual values of the Body Mass Index in the simple population. As can be observed, these mean values of BMI significantly increased from the first to the fifth year after transplant.
In relation to the characteristics of the graft, the results showed a significantly high prevalence of chronic graft nephropathy, diabetes and delayed graft function. The same thing occurs with hypertension, number of HLA incompatibilities, and acute rejection though the differences are not statistically significant. The cold ischemia time was similar in both groups of patients.
In regard to the immunosuppressant treatments, all groups experienced an average weight gain of 5.5 kg from the first month after transplant until the end of the first year. After that, their weight continued to steadily increase during the following post-transplant years until reaching an average gain of 6.8 kg at the end of the fifth year. This increment was particularly striking in Group 3 in which the five-year weight gain was 14 kg as well as in Group 4, in which the gain was 9 kg (Table 2).
The variables that showed a significant correlation between overweight and post-transplant outcome in the univariate analysis were the following: graft recipient age, BMI, kidney donor age, chronic graft nephropathy, and diabetes (Table 3).
The results of the Cox multivariate analysis indicated a significant correlation between overweight and graft recipient age, kidney donor age, and initial BMI, which were evaluated as continuous variables, and delayed kidney function and chronic graft nephropathy, which were evaluated as categorical variables. Graft rejection, hypertension, and diabetes were also included in the Cox regression model (Table 4).
Discussion
This study analyzed 282 kidney transplant patients to determine the causes and consequences of obesity and its prevalence. The results obtained showed a high prevalence of overweight patients, which increased from the first to the fifth year after the transplant. As can be observed, there was a significant gain in weight and BMI after the graft (Figures 1 & 2). This is a serious problem since during the post-transplant period, obesity is an important risk factor for graft survival as well as for the development of cardiovascular diseases, hypertension, diabetes, and dyslipidemias. Moreover it is a frequent cause of morbidity and mortality in these patients [13,14].
Nevertheless, the impact of obesity on graft survival is controversial [15, 16], since various studies have found that obesity does not affect the graft survival, despite higher rates of surgical complications [15, 17]. In the same line, other research also affirms that obesity does not portend a negative outcome for kidney transplant patients [19-22]. In our opinion, these studies may be biased to a certain extent, which would explain their results. More specifically, the methodological error could be they used WHO BMI ranges and did not analyze the BMI as a continuous variable.
For this reason, our study analyzed the average BMI range (i.e. patients with a BMI of 18.5-30 kg/m2 and excluded all patients with a BMI <18.5 (underweight) and a BMI> 30 (obese). We then evaluated whether the BMI, expressed as a continuous value, was a risk factor in the different categories. Our results showed that the BMI was significantly associated with chronic nephropathy and delayed graft function, including the patients within the same BMI category (normal weight as well as overweight patients).
Moreover, the multivariate as well as the univariate analysis reflected a correlation between negative graft outcome and age, gender, BMI, delayed graft function, chronic nephropathy, acute rejection, hypertension, and diabetes. Furthermore, in the multivariate analysis with continuous BMI values, it was evident that the BMI was significantly associated with graft failure, independently of the co-variables, delayed graft function and chronic nephropathy, both of which are also implicated in a negative graft outcome [23-25].
Weight gain after transplant is very common. In fact, various authors even affirm that it is universal [26, 27]. These studies showed a weight gain of over 20% in the first year and 10% in the second year, an increment directly related to a lower patient survival rate. This finding has been confirmed by a multicentric study carried out in the Netherlands, which found that the one-year post-transplant BMI and BMI increase were more strongly associated with death and graft failure than pre-transplant BMI among kidney transplant recipients [28].
This situation is a serious problem for clinical work and practice, given the potential consequences and difficulty in achieving and maintaining normal weight, [29-30]. In our study, the weight gain was 11% after one year and 20% after five years. This is similar to the results of other studies where the gain was 10.9% after the first year and 15.3% at the end of five years [31, 32].
The etiopathogenesis of obesity in renal transplants is multifactorial, and many of the variables that affect the transplant are similar to those that affect the population in general (e.g. genetic and environmental factors, sedentary lifestyle, etc.) [33, 34], however, we did not find any differences related to age, race or gender between the examined patients with respect to weight and BMI and graft responses. Other factors that are more specifically related to the transplant are patients' uremic state, general health, and immunosuppression therapy [35,36].
Steroids are a key factor in weight gain because steroid ingestion leads to metabolic effects, redistribution of body fat, water retention, and above all, an increased appetite [37, 38]. As can be observed in this study, the four combinations of immunosuppressive drugs administered included steroids, and all led to a considerable weight gain during the five-year monitoring period.
The prevention of weight gain after transplantation is managed by a multidisciplinary team with psychological support, who focus on helping patients to improve their dietary habits. More research is needed to evaluate how new immunosuppressive agents, steroid minimization strategies, and steroid-free immunosuppression will affect post-transplant outcomes in the obese populations. Some patients have opted for bariatric surgery. Despite the relatively small number of cases, the results are promising [39, 23]. These studies found that patients experienced a significant weight loss and an improvement in comorbidity without any serious graft rejection or dysfunction. However, these authors also warn that there is also a greater risk of surgical complications in transplanted patients in comparison to the general population.
In conclusion, our study found that there was a high prevalence of post-transplant overweight and obesity during the first post-transplant year. The BMI was evaluated as a continuous value instead of as a categorical value. Our results indicated that an increment in BMI, without categorical variation, can be an independent risk factor for graft loss. After the first year, the BMI of the patients increased 2.5 Kg/m2 and the weight 6.6 Kg. Consequently, obesity prevention for renal transplant patients should include dietary counseling and management, moderate physical activity, and steroid minimization.
Acknowledgements
Author Contributions
Antonio Liñán González conceived paper, oversaw data collection, conducted data analysis, wrote manuscript and approved final version. Raquel García Pérez participated in study design, data analysis and interpretation, critically revised manuscript and approved final version. Juan Bravo Soto participated in study design, data analysis, and interpretation of data and revision of manuscript and approved final version. Rafael Fernández Castillo participated in study design, interpretation of data and revision of manuscript and approved final version.
Competing Interests
The authors have declared that no competing interest exists.
References
1. Gore JL, Pham PT, Danovitch GM. et al. Obesity and Outcome Following Renal Transplantation. Am Joof Transplant. 2006;6(2):357-63
2. Cashion AK, Hathaway DK, Stanfill A. et al. Pre-transplant predictors of one year weight gain after kidney transplantation. Clin Transplant. 2014;28:1271-8
3. Zrim S, Furlong T, Grace B. et al. Body mass index and postoperative complications in kidney transplant recipients. Nephrology. 2012;17:582-7
4. Fernández Castillo R, Fernández Gallegos R, Peña Amaro MP, Esteban de la Rosa RJ. Assessment of lipid profiles and bone mineral density in renal transplant patients. Nutr Hosp. 2015;31(6):2503-10
5. Suarez O, Pardo M, Gonzalez S, Escobar-Serna DP, Castaneda DA, Rodriguez D. et al. Diabetes mellitus and renal transplantation in adults: is there enough evidence for diagnosis, treatment, and prevention of new-onset diabetes after renal transplantation? Transplant Proc. 2014;46(9):3015-20
6. Fernández Castillo R, De Alarcon RM, Esteban RJ, Haouari O, Planell E, Perán F, Bravo JA. Bone mineral density in patients with renal hyperparathyroidism undergoing surgery: relationship with bone parameters. Med Clin (Barc). 2010;135:156-159
7. Castillo RF, García Rios MD, Peña Amaro P, García García I. Progression of alterations in lipid metabolism in kidney transplant recipients over 5 years of follow-up. Int J Clin Pract. 2014Sep;68(9):1141-6
8. Hall ME, do Carmo JM, da Silva AA, Juncos LA, Wang Z, Hall JE. Obesity, hypertension, and chronic kidney disease. Int J Nephrol Renovasc Dis. 2014;7:75-88
9. Jadhakhan F, Marshall T, Gill P. A systematic review investigating the cumulative incidence of chronic kidney disease in young adults with impaired glucose tolerance. Syst Rev. 2015;4:69
10. Fernández Castillo R, Fernandez Gallegos R, Gómez Urquiza JL, Cañadas de la Fuente GA, Esteban de la Rosa RJ, Peña Amaro MP. Study and prevalence of post-transplant diabetes mellitus; analysis on a group of kidney transplant recipients. Nutr Hosp. 2014Oct1;30(4):813-7
11. Martín Salvador A, Fernández Castillo R, García García I, Aguilar Cordero MJ, Bravo Soto J. Causes and components of the metabolic syndrome in renal transplant recipients from a gender perspective. Nutr Hosp. 2018;35(5):1079-84
12. Hall ME, do Carmo JM, da Silva AA, Juncos LA, Wang Z, Hall JE. Obesity, hypertension, and chronic kidney disease. Int J Nephrol Renovasc Dis. 2014;7:75-88
13. Dumler F, Kilates C. Metabolic and nutritional complications of renal transplantation. J Ren Nutr. 2007;17(1):97-102
14. Obermayr RP, Temml C, Knechtelsdorfer M. et al. Predictors of new-onset decline in kidney function in a general middle-European population. Nephrol Dial Transplant. 2008;23(4):1265-73
15. Cacciola RA, Pujar K, Ilham MA, Puliatti C, Asderakis A, Chavez R. Effect of degree of obesity on renal transplant outcome. Transplant Proc. 2008;40:3408-12
16. Wolf G (ed). Obesity and the kidney. Contrib. Nephrol. Basel, Karger. 2006;151:19-41
17. Chang SH, Coates PT, McDonald SP. Effects of body mass index at transplant on outcomes of kidney transplantation. Transplantation. 2007;84:981-87
18. Erturk T, Berber I, Cakir U. Effect of Obesity on Clinical Outcomes of Kidney Transplant Patients. Transplant Proc. 2019May;51(4):1093-95
19. Howard RJ, Thai VB, Patton PR. et al. Obesity does not portend a bad outcome for kidney transplant recipients. Transplantation. 2002;73:53-5
20. Bennett WM, McEvoy KM, Henell KR, Valente JF, Douzdjian V. Morbid obesity does not preclude successful renal transplantation. Clin Transplant. 2004;18:89-93
21. Marks WH, Florence LS, Chapman PH, Precht AF, Perkinson DT. Morbid obesity is not a contraindication to kidney transplantation. Am J Surg. 2004;187:635-8
22. Teplan V, Schueck O, Racek J. et al. Asymmetric dimethylarginine and adiponectin after renal transplantation: role of obesity. J Ren Nutr. 2008;18:154-57
23. Chan G, Garneau P, Hajjar R. The impact and treatment of obesity in kidney transplant candidates and recipients. Can J Kidney Heal Dis. 2015;2:26
24. Luyckx V, Tuttle KR, Garcia-Garcia G. et al. Reducing major risk factors for chronic kidney disease. Kidney Int (Suppl). 2017;7:71-87
25. Krishnan N, Higgins R, Short A. et al. Kidney transplantation significantly improves patient and graft survival irrespective of BMI: a cohort study. Am J Transplant. 2015;15:2378-86
26. El-Agroudy A, Wafa E, Gheith O. et al. Weight gain after renal transplantation is a risk factor for patient and graft outcome. Transplantation. 2004;77:1381-5
27. Chang SH, McDonald SP. Postkidney transplant weight change as marker of poor survival outcomes. Transplantation. 2008;85:1443-8
28. Hoogeveen EK, Aalten J, Rothman KJ. et al. Effect of obesity on the outcome of kidney transplantation: a 20-year follow-up. Transplantation. 2011;91:869-74
29. Potluri K, Hou S. Obesity in kidney transplant recipients and candidates. Am J Kidney Dis. 2010;56(1):143-56
30. Segev DL, Simpkins CE, Thompson RE, Locke JE, Warren DS, Montgomery RA. Obesity impacts access to kidney transplantation. J Am Soc Nephrol. 2008;19(2):349-55
31. Kramer H, Tuttle KR, Leehey D, Luke A, Durazo-Arvizu R, Shoham D. et al. Obesity management in adults with CKD. Am J Kidney Dis. 2009;53:151-65
32. el-Agroudy AE, Wafa EW, Gheith OE. et al. Weight gain after renal transplantation is a risk factor. Transplantation. 2004;77:1381-5
33. Dumler F, Kilates C. Metabolic and nutritional complications of renal transplantation. J Renal Nutr. 2007;17:97-102
34. Yelken BM, Gorgulu N, Caliskan Y, Yazici H, Turkmen A, Yildiz A, Sever MS. Comparison of nutritional status in hemodialysis patients with and without failed renal allografts. Clin Transplant. 2010;24:481-7
35. Perico N, Cattaneo D, Sayegh MH. et al. Delayed graft function in kidney transplantation. Lancet. 2004;364:1814-1827
36. Dumler F, Kilates C. Metabolic and nutritional complications of renal transplantation. J Ren Nutr. 2007;17:97-102
37. Leeuwen MTv, Webster AC, McCredie MRE. et al. Effect of reduced immunosuppression after kidney transplant failure on risk of cancer: population based retrospective cohort study. BMJ. 2011;340(c):570
38. Amundsen R, Asberg A, Robertsen I. et al. Rimonabant affects cyclosporine A, but not tacrolimus pharmacokinetics in renal transplant recipients. Transplantation. 2009;87:1221-1224
39. Yemini R, Nesher E, Winkler J. et al. Bariatric surgery in solid organ transplant patients: long-term followup results of outcome, safety, and effect on immunosuppression. Am J Transplant. 2018;18:2772
Author contact
![]() Corresponding author: Dr. Rafael Fernández Castillo. Universidad de Granada, Facultad de Ciencias de la Salud, Parque Tecnológico de Ciencias de la Salud. Avd de la Ilustración s/n 18071, Granada, España/Spain. Phone: +34 958248755; Mobile Phone: +34 607 855983; E-mail: rafaelfernandezes.
Corresponding author: Dr. Rafael Fernández Castillo. Universidad de Granada, Facultad de Ciencias de la Salud, Parque Tecnológico de Ciencias de la Salud. Avd de la Ilustración s/n 18071, Granada, España/Spain. Phone: +34 958248755; Mobile Phone: +34 607 855983; E-mail: rafaelfernandezes.