Impact Factor ISSN: 1449-1907
- Issue 8; 2026
- Issue 7; 2026
- Issue 6; 2026
- Issue 5; 2026
- Issue 4; 2026
- Volume 23; 2026
- Past Issues
- Editorial Board
- Cover Images
- Index & Coverage
- Cover Suggestion
- Special Issues
Introduction
Materials and Methods
Results
Discussion
Abbreviations
Supplementary Material
Acknowledgements
References

 Global reach, higher impact
Int J Med Sci 2020; 17(14):2113-2124. doi:10.7150/ijms.46259 This issue Cite
Research Paper
Serum transferrin predicts end-stage Renal Disease in Type 2 Diabetes Mellitus patients
Lijun Zhao1,2, Yutong Zou1, Junlin Zhang1, Rui Zhang1, Honghong Ren1, Lin Li3, Ruikun Guo1, Jie Zhang4, Fang Liu1 ![]()
1. Division of Nephrology, West China Hospital of Sichuan University, Chengdu, Sichuan, China.
2. Division of General Practice, West China Hospital of Sichuan University, Chengdu, Sichuan, China.
3. Division of Pathology, West China Hospital of Sichuan University, Chengdu, Sichuan, China.
4. Key Laboratory of Transplant Engineering and Immunology, Ministry of Health, Regenerative Medicine Research Center, Chengdu China.
Received 2020-3-23; Accepted 2020-7-16; Published 2020-7-29
Abstract
Background: To investigate the relationship between serum iron status and renal outcome in patients with type 2 diabetes mellitus (T2DM).
Methods: Chinese patients (n=111) with T2DM and biopsy-proven diabetic nephropathy (DN) were surveyed in a longitudinal, retrospective study. Serum iron, total iron-binding capacity, ferritin, and transferrin were measured at the time of renal biopsy. Iron deposition and transferrin staining were performed with renal biopsy specimens of DN patients and potential kidney donors. End-stage renal disease (ESRD) was the end-point. ESRD was defined as an estimated glomerular filtration rate <15 mL/min/1.73 m2 or the need for chronic renal replacement therapy. Cox proportional hazard models were used to estimate the hazard ratios (HRs) for the influence of serum iron metabolism on ESRD.
Results: During a median follow up of 30.9 months, 66 (59.5%) patients progressed to ESRD. After adjusting for age, sex, baseline systolic blood pressure, renal functions, hemoglobin, HbA1c, and pathological findings, lower serum transferrin concentrations were significantly associated with higher ESRD in multivariate models. Compared with patients in the highest transferrin quartile (≥1.65 g/L), patients in the lowest quartile (≤1.15 g/L) had multivariable-adjusted HR (95% confidence interval) of 7.36 (1.40-38.65) for ESRD. Moreover, tubular epithelial cells in DN exhibited a higher deposition of iron and transferrin expression compared with healthy controls.
Conclusions: Low serum transferrin concentration was associated with diabetic ESRD in patients with T2DM. Free iron nephrotoxicity and poor nutritional status with accumulated iron or transferrin deposition might contribute to ESRD.
Keywords: diabetic nephropathy, end-stage renal disease, transferrin, iron nephrotoxicity
Introduction
Diabetic nephropathy (DN) has become the leading cause of end-stage renal disease (ESRD) in Chinese people [1], a phenomenon that parallels the dramatic worldwide rise in prevalence of diabetes mellitus [2]. Early detection and better management of DN patients with type 2 diabetes mellitus (T2DM) may delay DN progression to ESRD, lessen its complications, and improve outcome.
Dysregulation of iron homeostasis is a major factor in development of DN. Increased iron stores are associated with diabetes and DN by their effect on inflammation, production of reactive oxygen species, and initiation and propagation of lipid peroxidation [3-5]. Conversely, iron deficiency may lead to impaired production of hemoglobin and result in iron-deficient anemia, which is common in patients with DN [6]. Disorders of iron homeostasis that occur in chronic kidney disease (CKD) turn anemia management of patients into a complex multifactorial therapeutic task [7]. New erythropoiesis-stimulating agents (ESA) such as darbepoetin [8] and others in development such as the continuous erythropoietin receptor activator [9] have longer half-lives than recombinant human erythropoietin, enabling CKD outpatients to require less frequent ESA administration. Despite the foregoing advances in CKD-associated anemia management, the one unresolved issue is the prognostic value of iron status in CKD patients. Locatelli et al. proposed serum ferritin and transferrin saturation measurements as diagnostic markers of iron status [10]. Choe et al. found that abnormal iron status increased the mortality of patients with diabetes [11]. High serum ferritin values were associated with mortality in hemodialysis patients [12, 13]. Although the effect of iron status in clinical outcome has been examined extensively in the dialysis population [12, 14], there are only limited data that describe the association between iron indices and renal outcomes in the pre-dialysis population with T2DM and associated DN. Iron increases insulin resistance, and iron is related to oxidative stress in T2DM [15]. Insulin resistance and oxidative stress are risk factors for kidney progression in T2DM. Thus, it is plausible to postulate that abnormal iron homeostasis was associated with renal outcomes in patients with T2DM and associated DN.
In this retrospective cohort study, we found that reduced serum transferrin was associated with diabetic ESRD. Free iron nephrotoxicity and poor nutritional status with accumulated iron or transferrin deposition might be mechanisms that contribute to DN progression.
Materials and Methods
Design, Setting, and Participants
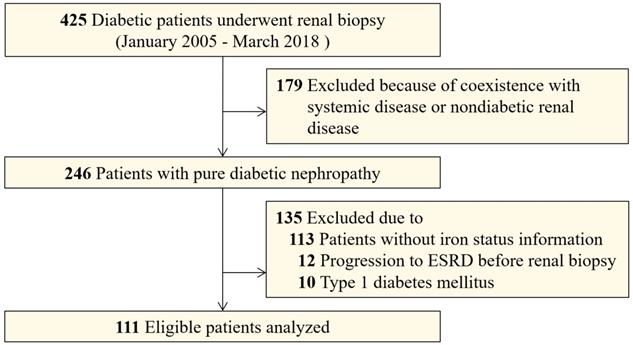
To investigate the association between iron status and renal outcome, this longitudinal, retrospective study included patients with T2DM and associated DN who underwent percutaneous renal biopsy from January 2010 to March 2018 at the West China Hospital of Sichuan University. All patients provided informed consent and the Institutional Review Boards of Sichuan University approved this study. The indications for renal biopsy were T2DM patients with renal damage who lacked absolute contraindications, especially T2DM patients without diabetic retinopathy, or with obvious glomerular hematuria and/or short diabetic duration, or with sudden onset overt proteinuria [16]. We used the American Diabetes Association criteria for T2DM diagnosis [17]. DN was defined based on the 2015 standard of An et al. [18] , and DN was diagnosed by at least two renal pathologists and/or nephrologists based on Renal Pathology Society (RPS) classification [19]. Adult patients with T2DM and biopsy-proven DN were eligible for this study. Exclusion criteria were coexisting nondiabetic renal diseases (NDRD) such as IgA nephropathy or systemic diseases, especially anti-neutrophil cytoplasmic antibody (ANCA) that are associated vasculitis, anti-glomerular basement membrane (GBM) disease and lupus nephritis, non-T2DM, progression to ESRD before renal biopsy, and patients who had incomplete iron status information (Figure 1). In sum, we enrolled 111 patients who had DN as the only glomerular disease diagnosis and for who completed iron status data were available.
Flowcharts of patients in this study.
For tissue transferrin and iron staining, renal biopsy specimens were collected from ten potential kidney donors (healthy controls) and age, sex-matched patients with T2DN in our cohort. Table S1 displays their clinical characteristics.
Clinical and pathologic information
Clinical and pathologic data were abstracted from electronic medical records at the time of renal biopsy. Data included age, sex, body mass index (BMI), smoking status, presence of diabetic retinopathy, and use of renin-angiotensin aldosterone system (RAAS) blockade or ESA. Smoking status was determined at the time of biopsy. Diabetic retinopathy was defined as existence of microaneurysms, retinal dot, blot hemorrhage, or neovascularization in the retina [20]. In addition, laboratory data at the time of biopsy were obtained from the medical records. We evaluated the estimated glomerular filtration rate (eGFR) using the creatinine-based Chronic Kidney Disease Epidemiology Collaboration equation [21]. Hematuria was defined as more than five erythrocytes per high-power field in at least two of three consecutive urine tests without urinary infection and no urinary tract malignancy or stone [22, 23]. Treatment was defined as the use of the RAAS blockade, statins, and ESA for more than half of the follow-up period. Patient follow-up examinations were performed 2-4 times per year based on the patient's individual condition. Renal outcome was defined by the progression to ESRD, which was defined as eGFR <15 mL/min/1.73 m2 or the need for chronic renal replacement therapy [24]. All patients were followed until March 31, 2019.
Markers of serum iron status
Baseline iron status at the time of renal biopsy was measured with standard protocols at West China Hospital. Serum iron concentrations and iron saturation ratios were used as indices of iron stores. Total iron-binding capacity (TIBC) was represented serum transferrin level. Transferrin was measured by chemiluminescence immunoassay, and serum ferritin was measured with an immunoradiometric assay. Serum iron and total iron-binding capacity were measured with a modified automated AAII-25 colorimetric method. Transferrin saturation (TSAT) was calculated as (iron/TIBC) *100%.
Histological analysis
Renal biopsy tissues for light microscopy, immunofluorescence, and electron microscopy were prepared by standard procedures at West China Hospital and examined by expert nephropathologists. Sections for light microscopy were stained with hematoxylin-eosin, periodic acid-Schiff, Masson's trichrome, and periodic acid-Schiff silver methenamine. The original biopsy results from immunofluorescence microscopy and electron microscopy were used to confirm the diagnosis of pure DN. All light microscopy pathological features evaluated in this study were based on the RPS DN classification [19].
Immunohistochemical staining
Paraffin-embedded kidney tissue samples were sectioned (3 μm) and deparaffinized. Immunohistochemistry was performed as described [25]. Briefly, tissue samples were treated with 3% hydrogen peroxide in the dark to block endogenous peroxidase and then subjected to antigen retrieval by heated citric acid. The tissue samples were incubated with 3% normal goat serum (ZLI-9021, Zhongshan, China) at 37°C for 1 hour. Without washing, they were incubated with mouse monoclonal anti-transferrin antibody (sc365871, Santa Cruz, USA) at 4°C overnight and then incubated with an HRP-conjugated goat anti-mouse antibody (8125, CST, USA) at 37°C for 1 hour. Antibody binding was detected by incubating with a fresh mixture of diaminobenzidine (DAB, 8059S, CST, USA) according to the manufacturer's instructions. Slides were counterstained with Mayer's Hematoxylin, dehydrated, and mounted with Entellan (107960, Merck, Germany). Images were captured with a Nikon DXM 1200/NIS-Elements mounted on a light microscope (Nikon Eclipse E600, Shanghai, CHN) and analyzed using Image Pro Plus 6 (IPP software, Houston, TX). Staining intensity was assessed by Image Pro Plus 6 with five randomly selected images per biopsy after correction for background staining.
Iron detection
For iron detection, paraffin-embedded kidney tissue samples were cut into 4-μm-thick sections and deparaffinized. Then, slides were incubated in the dark with Perl's blue staining reagent according to the kit's instructions (G1422, Solarbio, China). Slides were counterstained with 0.1% nuclear fast red.
Statistical analysis
Continuous variables were expressed as the mean and standard deviation (SD) with symmetric distribution or as the median and interquartile ranges (IQR) with the asymmetric distribution. Categorical variables were expressed as counts and percent. Differences between continuous variables were analyzed by one-way ANOVA, followed by least significant difference (LSD) tests for multiple comparisons, or the Kruskal-Wallis H test, as appropriate. Categorical variables were analyzed using the Chi-square test or Fisher's exact test. We used Spearman's correlation analysis to assess correlations between serum iron status parameters and clinical findings.
Survival cures of quartiles of serum iron, TIBC, transferrin, ferritin, and TSAT levels were obtained by Kaplan-Meier methods with a log-rank test. Univariate and multivariable Cox proportional hazard models were used to estimate the hazard ratios (HRs) for ESRD [26]. One patient was lost to follow-up and only the baseline clinical and pathologic data were analyzed for that patient. Data for 24 h proteinuria were missing for nine individuals (these nine patients were included in multivariable analyses). We first examined the differences in clinical parameters between patients with or without missing values to check whether the values were missed randomly. We then used multiple imputation methods for multivariable models. The proportional hazard assumption in Cox models was tested to check whether the dataset satisfied the basic assumptions of Cox analyses. The Cox proportional hazards model was used to calculate hazard ratios (HRs) and 95% confidence intervals (CIs) for ESRD. In the two Cox proportional hazards models, each HR was adjusted for age, sex, systolic blood pressure, eGFR, proteinuria, hemoglobin and HbA1c at the time of renal biopsy. In “Model 2”, we adjusted each HR for the aforesaid factors plus all pathological parameters as categorical variables. The clinical covariates were selected as potential confounders because of their significance in univariate analysis or on the basis of biological plausibility. Age and sex were chosen on the basis of biological plausibility, and HbA1c was selected to represent previous glycemic control. Proteinuria, eGFR, serum albumin, and hemoglobin were significant in univariate model. Parameters with P<0.05 in “Model 2” were considered significant prognosis predictors. Further, to determine the best predictors of ESRD, we used receiver operating characteristic (ROC) curve analysis with clinical/pathological variables, iron status parameters, or their combinations. The area under the curve (AUC) was calculated for each model [27].
All statistical analyses were completed using SPSS software (version 20.0, Chicago, IL, USA) and Stata SE (version 14.0, StataCorp LLC, College Station, TX, USA). Statistical tests were considered significant at P<0.05. Figures were constructed using Graph-Pad Prism 8.0 Software (Graph Pad Software, USA).
Results
Baseline characteristics
A total of 111 patients with patients with T2DM and biopsy-proven DN from West China Hospital were retrospectively included (Figure 1). The clinical characteristics of the patients with and without iron status data are displayed in Table S2. The patients enrolled in this study had a higher prevalence of hypertension than those for whom iron status data was not available. The patients with iron status had no significant differences in eGFR, proteinuria, and hemoglobin concentration than those without iron status data. A summary of the demographics and baseline characteristics of the 111 patients enrolled in the study is shown in Table 1. The proportion of male patients was 64.9% (n=72). The median baseline eGFR was 51.5 mL/min/1.73 m2 (interquartile range [IQR], 34.6-66.8) and the median baseline 24 h proteinuria was 4.64 g/day (IQR, 2.51-8.37). Sixty-two (55.9%) patients had diabetic retinopathy and 66 (59.4%) patients had diabetic neuropathy. The baseline pathological characteristics of patients enrolled in this study were displayed in Table 2. According to RPS classification, there were four (3.6%) patients in class I, 18 (16.2%) patients in classes IIa and IIb, 65 (58.6%) patients in class III, and 24 (21.6%) patients in class IV.
Baseline clinical characteristics of individuals with and without ESRD
| Characteristics | Total (n = 111) | ESRD + (n = 66) | ESRD - (n = 45) | P value |
|---|---|---|---|---|
| Age, mean (SD), y | 51 (9) | 51 (9) | 52 (9) | 0.42 |
| Sex, Male, n (%) | 72 (64.9) | 42 (63.6) | 30 (66.7) | 0.84 |
| Smoking, Never/Ex/Current, (n) | 64/20/27 | 38/13/15 | 2026/7/12 | 0.80 |
| History of Hypertension, n (%) | 105 (94.6) | 62 (93.9) | 43 (95.6) | 0.71 |
| BMI, mean (SD), kg/m2 | 25.1 (3.38) | 24.25 (2.99) | 26.12 (3.59) | 0.02 |
| SBP, mean (SD), mmHg | 149 (23) | 150 (23) | 147 (24) | 0.44 |
| DBP, mean (SD), mmHg | 87 (12) | 88 (11) | 86 (13) | 0.56 |
| MAP, mean (SD), mmHg | 108 (14) | 109 (13) | 106 (15) | 0.44 |
| Duration of diabetes, median (IQR), months | 96 (36-132) | 90 (36-132) | 96 (36-132) | 0.79 |
| History of DR, n (%) | 62 (55.9) | 39 (59.1) | 23 (51.1) | 0.44 |
| History of Diabetic neuropathy, n (%) | 66 (59.4) | 40 (60.6) | 28 (57.8) | 0.37 |
| HbA1c, median (IQR), % | 6.9 (6.2-8.1) | 6.9 (5.9-8.1) | 7.2 (6.3-7.9) | 0.91 |
| FPG, median (IQR), mg/dL | 126.64 (91.33-169.88) | 118.63 (89.17-174.56) | 130.43 (99.08-168.26) | 0.67 |
| Hemoglobin, mean (SD), g/L | 104 (24) | 96 (16) | 115 (30) | <0.001 |
| Serum albumin, mean (SD), g/L | 31 (7.9) | 27.8 (6.5) | 35.6 (7.6) | <0.001 |
| CKD stage, 1/2/3/4, (n)† | 16/23/48/24 | 6/14/26/20 | 10/9/22/4 | 0.02 |
| BUN, median (IQR), mg/dL | 25.99 (18.74-37.82) | 30.94 (19.36-40.2) | 24.45 (17.23-32.49) | 0.10 |
| Serum creatinine, median (IQR), mg/dL | 136.6 (107-197.6) | 145.5 (115-241) | 124 (88-149) | <0.001 |
| eGFR, median (IQR), mL/min/1.73 m2 | 51.5 (34.6-66.8) | 45.7 (27.6-62) | 54.2 (44-80.5) | 0.01 |
| 24 h proteinuria, median (IQR), g/d | 4.64 (2.51-8.37) | 5.97 (3.78-8.93) | 2.81 (1.43-5.95) | 0.01 |
| Hematuria, n (%) | 60 (54.1) | 39 (59.1) | 21 (46.7) | 0.20 |
| UA, mean (SD), mg/dL | 6.3 (1.4) | 6.14 (1.17) | 6.53 (1.68) | 0.19 |
| Triglyceride, mean (SD), mg/dL | 170.67 (115.75) | 157.57 (76.26) | 189.88 (155.79) | 0.20 |
| Cholesterol, mean (SD), mg/dL | 204.21 (69.66) | 216.2 (74.86) | 186.61 (57.61) | 0.03 |
| HDL, mean (SD), mg/dL | 54.9 (21.39) | 58.03 (24.33) | 50.3 (15.28) | 0.04 |
| LDL, mean (SD), mg/dL | 121.82 (55.65) | 130.88 (61.12) | 108.52 (43.82) | 0.04 |
| No. of hypertensive drugs, median (IQR) | 2 (1-2) | 2 (1-2) | 2 (1-2) | 0.12 |
| RAAS inhibitor, n (%) | 85 (76.6) | 47 (71.2) | 38 (84.4) | 0.11 |
| Statins, n (%) | 63 (56.8) | 37 (56.1) | 26 (57.8) | 0.86 |
| ESA, n (%) | 9 (8.1) | 7 (10.6) | 2 (4.4) | 0.24 |
| Fe, median (IQR), mmol/L | 10.17 (8.00-15.70) | 9.45 (6.64-12.59) | 12.8 (8.9-18.06) | 0.01 |
| TIBC, median (IQR), mmol/L | 35.4 (29.32-42.2) | 32.5 (27.4-36.83) | 40.76 (31.14-45.77) | <0.001 |
| TSAT, median (IQR), % | 30.9 (21.5-39.8) | 30 (21.9-37.8) | 31.7 (20.8-44.3) | 0.31 |
| Ferritin, median (IQR), ng/mL | 311 (168.9-555.1) | 288.3 (149.7-535.1) | 314.6 (176.8-547.5) | 0.04 |
| Transferrin, median (IQR), g/L | 1.38 (1.15-1.65) | 1.27 (1.07-1.44) | 1.59 (1.22-1.79) | <0.001 |
Data are presented as the mean (standard) for continuous variables with symmetric distribution, median (25th-75th percentiles) for continuous variables with asymmetric distribution, or percent for categorical variables. † CKD stage1: eGFR≥90 mL/min/1.73 m2; stage 2: eGFR 60-89 mL/min/1.73 m2; stage 3: eGFR 30-59 mL/min/1.73 m2; stage 4: eGFR 15-29 mL/min/1.73 m2.
Abbreviations: SD, standard deviation; IQR, interquartile range; BMI, body mass index; SBP, systolic blood pressure; DBP, diastolic blood pressure; MAP, mean blood pressure; DR, diabetic retinopathy; CKD, chronic kidney disease; HbA1c, hemoglobin A1c; FPG, fasting plasma glucose; BUN, blood urea nitrogen; eGFR, estimated glomerular filtration rate; UA, uric acid; HDL, high-density lipoprotein cholesterol; LDL, low-density lipoprotein cholesterol; RAAS, renin-angiotensin-aldosterone system; ESA, erythropoiesis-stimulating agent; TIBC, total iron-binding capacity; TSAT, transferrin saturation; ESRD, end-stage renal disease.
Pathological characteristics of individuals with and without ESRD
| Characteristics | Total (n = 111) | ESRD + (n = 66) | ESRD (n = 45) | P value |
|---|---|---|---|---|
| RPS classification†, n (%) | 0.01 | |||
| I | 4 (3.6) | 0 (0) | 4 (8.9) | |
| IIa | 9 (8.1) | 2 (3.0) | 7 (15.6) | |
| IIb | 9 (8.1) | 5 (7.6) | 4 (8.9) | |
| III | 65 (58.6) | 45 (68.2) | 20 (44.4) | |
| IV | 24 (21.6) | 14 (21.2) | 10 (22.2) | |
| IFTA†, n (%) | 0.47 | |||
| 0 | 1 (0.9) | 0 (0) | 1 (2.2) | |
| 1 | 46 (41.4) | 25 (37.9) | 21 (46.7) | |
| 2 | 41 (36.9) | 26 (39.4) | 15 (33.3) | |
| 3 | 23 (20.7) | 15 (22.7) | 8 (17.8) | |
| Interstitial inflammation†, n (%) | 0.27 | |||
| 0 | 2 (1.8) | 0 (0) | 2 (4.4) | |
| 1 | 80 (72.1) | 49 (74.2) | 31 (68.9) | |
| 2 | 29 (26.1) | 17 (25.8) | 12 (26.7) | |
| Arteriosclerosis†, n (%) | 0.44 | |||
| 0 | 11 (9.9) | 5 (7.6) | 6 (13.3) | |
| 1 | 54 (48.6) | 35 (53.0) | 19 (42.2) | |
| 2 | 46 (41.4) | 26 (39.4) | 20 (44.4) | |
| Arteriolar hyalinosis†, n (%) | 0.02 | |||
| 0 | 6 (5.4) | 1 (1.5) | 5 (11.1) | |
| 1 | 30 (27.0) | 15 (22.7) | 15 (33.3) | |
| 2 | 75 (67.6) | 50 (75.8) | 25 (55.6) | |
Data are presented as percent for categorical variables. † Defined by RPS Diabetic Nephropathy Classification.
Abbreviations: ESRD, end-stage renal disease; RPS, Renal Pathology Society; IFTA, interstitial fibrosis and tubular atrophy.
During a mean follow-up of 30.9 months, 66 (59.5%) patients progressed to ESRD. Compared with patients without ESRD, ESRD patients had higher levels of baseline creatinine and proteinuria, lower baseline eGFR, and lower concentrations of serum albumin, hemoglobin, serum iron, TIBC, ferritin, and transferrin (Table 1). There was no significant difference between the prevalence of diabetic retinopathy or diabetic neuropathy in patients with or without ESRD.
Associations between iron status and ESRD
Of the 111 patients, the median baseline serum iron, ferritin, TIBC, and transferrin concentrations were 10.17 µmol/L (IQR, 8.00-15.70), 311.0 ng/mL (IQR, 168.9-555.1), 35.4 µmol/L (IQR, 29.32-42.2), 1.38 g/L (IQR, 1.15-1.65), respectively. The median TSAT was 30.9 % (IQR, 21.5-39.7). Kaplan-Meier curves showed that serum transferrin and TIBC, instead of serum iron, ferritin, and TSAT, were significant for ESRD (Figure S1). When stratified by quartiles of serum transferrin, the 5-year renal survival rates were 0% for Q1 (≤1.15 g/L), 13.5% for Q2 (1.15-1.38 g/L), 7.3% for Q3 (1.38-1.65 g/L), and 50.9% for Q4 (≥1.65 g/L), respectively (Table S3).
Figure 2 shows the adjusted HRs of serum iron status markers for renal survival. After adjusting for clinical parameters (age, sex, SBP, baseline eGFR, proteinuria, hemoglobin, and HbA1c) and pathological findings, lower serum transferrin levels were incrementally associated with higher ESRD in multivariate models. Compared with transferrin Q4, the HRs for transferrin Q1, Q2, and Q3 were 7.36 (95% CI, 1.40-38.65), 7.54 (95% CI, 1.85-30.77), and 3.69 (95% CI, 1.10-12.32). The lowest TIBC quartile (Q1, ≤29.32 µmol/L) was also associated with ESRD (HR 3.88, 95% CI 1.14-13.25) when compared with the highest quartile (Q4, ≥42.2 µmol/L). Moreover, eGFR was an independent risk factor for predicting ESRD (HR 0.84, 95% CI 0.72-0.99).
Univariate (a) and multivariate (b, c) Cox proportional hazard models by serum iron status at the renal endpoint. Model 1: adjusted for age, sex, estimated glomerular filtration rate, proteinuria, hemoglobin, and HbA1c. Model 2: adjusted for the above plus pathological parameters including Renal Pathology Society diabetic nephropathy class, tubular atrophy and interstitial fibrosis, interstitial inflammation, arteriosclerosis, and arteriolar hyalinosis. Abbreviations: HR, hazard ratio; CI, confidence interval; TIBC, total iron-binding capacity; TSAT, transferrin saturation; Ref, reference.
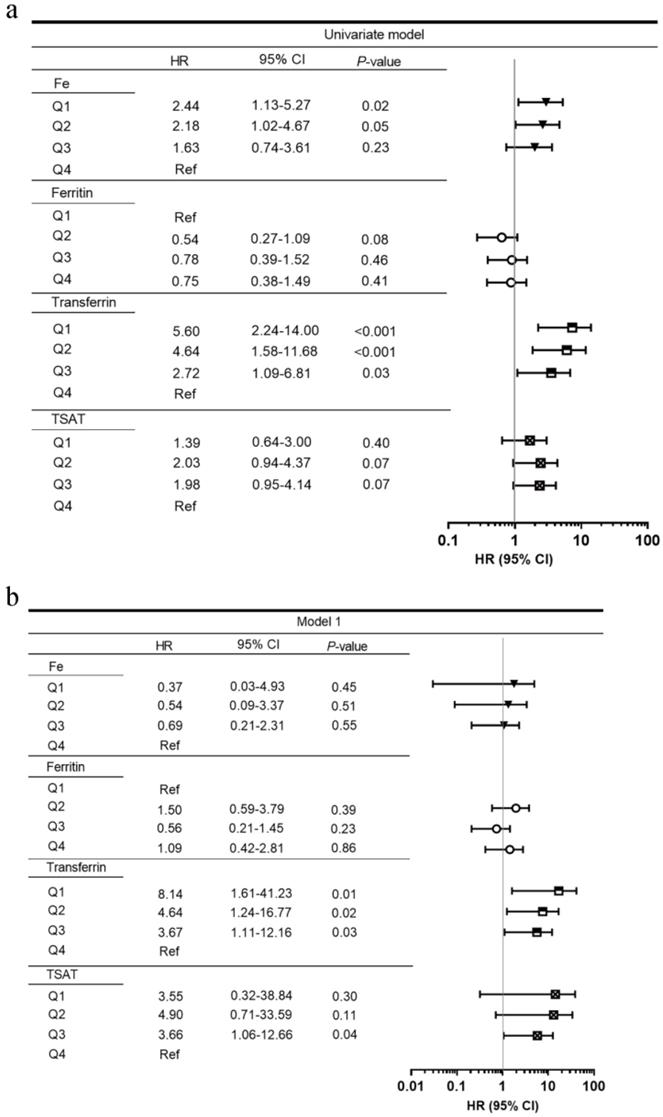
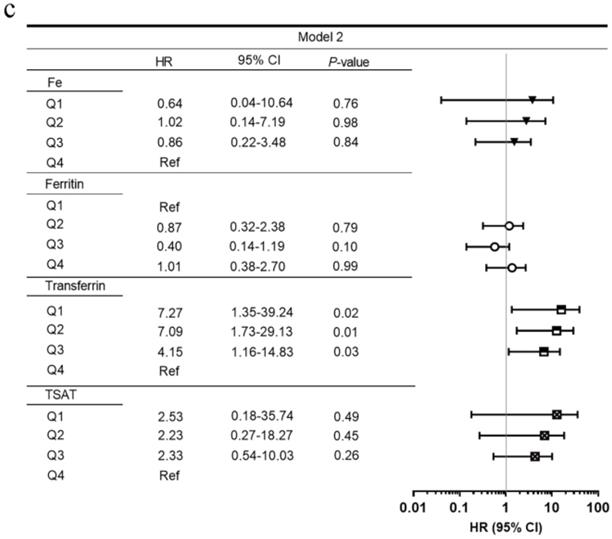
Figure S2 displays the ROC AUC for the prediction of ESRD by clinical parameters. Among the serum iron status parameter models, serum transferrin had the largest AUC (Figure S2a). Compared with the traditional kidney functional biomarkers, serum transferrin had higher AUC (Figure S2b). Moreover, serum transferrin had higher AUC than any RPS pathological parameter (Figure S2c). Because eGFR, proteinuria, and hemoglobin were associated with ESRD in univariate Cox proportional hazard models, we created a clinical model with those parameters. The model that included transferrin had a larger AUC than the model with only clinical covariates (Figure S2d).
Clinical characteristics stratified by transferrin
Table 3 lists baseline clinical characteristics of patients divided by quartiles of transferrin. Apparently, patients with lower serum transferrin had lower concentrations of hemoglobin, albumin, uric acid, serum iron and TIBC, and higher levels of proteinuria, TSAT, and ferritin. There seemed to be no difference in age, baseline eGFR, and HbA1c among the four groups. In the Q4 group, 29.6% of patients entered ESRD, which was a significantly lower percent than those in Q1, Q2, and Q3 groups (76.9% in Q1, 73.1% in Q2, 59.4% in Q3, respectively). As for pathological findings, only RPS classification differed significantly among the four groups. Compared with Q4, patients in Q1, Q2, and Q3 group had higher percent of class III (76.9% in Q1, 69.2% in Q2, 50.0% in Q3, and 40.7% in Q4, respectively, Table 4).
Baseline clinical characteristics of individuals stratified by quartiles of baseline serum transferrin levels
| Characteristics | Serum transferrin (g/L) | ||||
|---|---|---|---|---|---|
| Q1 (n = 26) | Q2 (n = 26) | Q3 (n = 33) | Q4 (n = 26) | P value | |
| ≤1.15 g/L | 1.15-1.38 g/L | 1.38-1.65 g/L | ≥1.65 g/L | ||
| Age, mean (SD), y | 52 (8) | 52 (10) | 50 (8) | 52 (11) | 0.78 |
| Sex, Male, n (%) | 9 (34.6) | 22 (84.6) | 25 (78.1) | 16 (59.3) | 0.01 |
| Smoking, Never/Ex/Current, (n) | 19/3/4 | 10/5/11 | 20/5/7 | 15/7/5 | 0.14 |
| History of Hypertension, n (%) | 26 (100.0) | 24 (92.3) | 29 (90.6) | 26 (96.3) | 0.43 |
| BMI, mean (SD), kg/m2 | 25.46 (3.19) | 23.21 (2.38) | 25.75 (3.74) | 25.88 (3.43) | 0.06 |
| SBP, mean (SD), mmHg | 151 (23) | 148 (26) | 149 (22) | 148 (24) | 0.98 |
| DBP, mean (SD), mmHg | 90 (13) | 86 (12) | 87 (12) | 85 (10) | 0.51 |
| MAP, mean (SD), mmHg | 110 (14) | 107 (15) | 108 (14) | 106 (14) | 0.75 |
| Duration of diabetes, median (IQR), months | 108 (48-132) | 114 (24-132) | 84 (36-132) | 90 (24-180) | 0.92 |
| History of DR, n (%) | 14 (53.8) | 13 (50.0) | 22 (68.8) | 13 (48.1) | 0.51 |
| History of diabetic neuropathy, n (%) | 15 (57.7) | 17 (65.4) | 19 (57.6) | 15 (57.7) | 0.67 |
| HbA1c, median (IQR), % | 6.7 (5.9-8.0) | 7.3 (6.7-8.1) | 7.2 (6.0-8.4) | 7.0 (6.4-7.7) | 0.70 |
| FPG, median (IQR), mg/dL | 128.45 (83.59-164.11) | 133.49 (102.86-210.95) | 113.13 (88.45-149.52) | 123.85 (99.62-163.03) | 0.55 |
| Hemoglobin, mean (SD), g/L | 93 (16) | 101 (18) | 109 (34) | 113 (17) | 0.01 |
| Serum albumin, mean (SD), g/L | 25.2 (5) | 27 (5.1) | 32.2 (7.1) | 39.2 (6.1) | <0.001 |
| CKD stage,1/2/3/4, (n) † | 2/3/14/7 | 3/7/10/6 | 5/10/10/7 | 6/3/14/4 | 0.21 |
| BUN, median (IQR), mg/dL | 26.55 (19.27-40.2) | 30.69 (21.01-36.69) | 21.29 (17.65-36.41) | 25.08 (16.53-35.74) | 0.75 |
| Serum creatinine, median (IQR), mg/dL | 149 (132.8-223) | 138 (115-211.8) | 123 (102.5-155) | 127.5 (76-169) | 0.21 |
| eGFR, median (IQR), mL/min/1.73 m2 | 41.9 (29.9-50) | 52.3 (36.4-66.5) | 58.8 (41-79.8) | 53.1 (40.5-77.7) | 0.07 |
| 24-h proteinuria, median (IQR), g/d | 7.14 (4-9.9) | 6.4 (3.81-12.56) | 4.3 (2.58-7.83) | 2.18 (1.07-4.38) | <0.001 |
| Hematuria, n (%) | 13 (50.0) | 18 (69.2) | 19 (59.4) | 8 (29.6) | 0.04 |
| UA, mean (SD), mg/dL | 5.73 (1.37) | 6.08 (1.37) | 6.5 (1.25) | 6.82 (1.49) | 0.03 |
| Triglyceride, mean (SD), mg/dL | 168.84 (71.98) | 156.03 (78.18) | 171.03 (137.35) | 186.69 (151.71) | 0.83 |
| Cholesterol, mean (SD), mg/dL | 235.75 (77.93) | 202.2 (92.17) | 201.46 (44.55) | 178.16 (49.86) | 0.03 |
| HDL, mean (SD), mg/dL | 63.05 (28.54) | 56.43 (21.04) | 54.11 (19.67) | 46.21 (10.52) | 0.04 |
| LDL, mean (SD), mg/dL | 142.68 (66.27) | 124.83 (75.72) | 117.53 (37.89) | 103.38 (28.75) | 0.08 |
| No. of hypertensive drugs, median (IQR) | 2 (2-3) | 2 (1-2) | 2 (1-2) | 1 (1-2) | 0.12 |
| RAAS inhibitor, n (%) | 18 (69.2) | 23 (88.5) | 24 (75.0) | 20 (74.1) | 0.39 |
| Statins, n (%) | 16 (61.5) | 14 (53.8) | 19 (59.4) | 14 (51.9) | 0.93 |
| ESA, n (%) | 3 (11.5) | 0 (0) | 5 (15.6) | 0 (0) | 0.05 |
| Fe, median (IQR), mmol/L | 8.30 (6.10-11.20) | 10.14 (9.10-17.30) | 12.43 (8.00-17.33) | 12.37 (8.90-15.40) | 0.01 |
| TIBC, median (IQR), mmol/L | 25.14 (22.8-27.4) | 31.17 (30.4-32.6) | 37.89 (36.4-40.7) | 47.4 (45.42-53.07) | <0.001 |
| TSAT, median (IQR), % | 33 (24.2-43.1) | 32.7 (27.4-54.8) | 33.6 (20.1-42.2) | 27.3 (18.5-31.7) | 0.05 |
| Ferritin, median (IQR), ng/mL | 398.25 (197.2-636.5) | 394.4 (149.7-607.4) | 330 (224.8-581.4) | 191.9 (112.5-314.6) | 0.03 |
Data are presented as the mean (standard) for continuous variables with symmetric distribution, median (25th-75th percentiles) for continuous variables with asymmetric distribution, or percent for categorical variables. † CKD stage1: eGFR≥90 mL/min/1.73 m2; stage 2: eGFR 60-89 mL/min/1.73 m2; stage 3: eGFR 30-59 mL/min/1.73 m2; stage 4: eGFR 15-29 mL/min/1.73 m2.
Abbreviations: SD, standard deviation; IQR, interquartile range; BMI, body mass index; SBP, systolic blood pressure; DBP, diastolic blood pressure; MAP, mean blood pressure; DR, diabetic retinopathy; CKD, chronic kidney disease; HbA1c, hemoglobin A1c; FPG, fasting plasma glucose; BUN, blood urea nitrogen; eGFR, estimated glomerular filtration rate; UA, uric acid; HDL, high-density lipoprotein cholesterol; LDL, low-density lipoprotein cholesterol; RAAS, renin-angiotensin-aldosterone system; ESA, erythropoiesis-stimulating agent; TIBC, total iron-binding capacity; TSAT, transferrin saturation; ESRD, end-stage renal disease.
Pathological characteristics of individuals stratified by quartiles of baseline serum transferrin levels
| Characteristics | Serum transferrin (g/L) | ||||
|---|---|---|---|---|---|
| Q1 (n = 26) | Q2 (n = 26) | Q3 (n = 33) | Q4 (n = 26) | P value | |
| ≤1.15 g/L | 1.15-1.38 g/L | 1.38-1.65 g/L | ≥1.65 g/L | ||
| RPS classification†, n (%) | 0.01 | ||||
| I | 0 (0) | 1 (3.8) | 1 (3.1) | 2 (7.4) | |
| IIa | 0 (0) | 1 (3.8) | 5 (15.6) | 3 (11.1) | |
| IIb | 0 (0) | 2 (7.7) | 4 (12.5) | 3 (11.1) | |
| III | 20 (76.9) | 18 (69.2) | 16 (50.0) | 11 (40.7) | |
| IV | 6 (23.1) | 4 (15.4) | 6 (18.8) | 8 (29.6) | |
| IFTA†, n (%) | 0.51 | ||||
| 0 | 0 (0) | 2 (7.7) | 0 (0) | 0 (0) | |
| 1 | 8 (30.8) | 10 (38.5) | 18 (56.3) | 10 (37.0) | |
| 2 | 13 (50.0) | 10 (38.5) | 7 (21.9) | 10 (37.0) | |
| 3 | 5 (19.2) | 4 (15.4) | 7 (21.9) | 7 (25.9) | |
| Interstitial inflammation†, n (%) | 0.48 | ||||
| 0 | 0 (0) | 1 (3.8) | 1 (3.1) | 0 (0) | |
| 1 | 18 (69.2) | 18 (69.2) | 27 (84.4) | 17 (63.0) | |
| 2 | 8 (30.8) | 7 (26.9) | 4 (12.5) | 10 (37.0) | |
| Arteriosclerosis†, n (%) | 0.17 | ||||
| 0 | 1 (3.8) | 3 (11.5) | 3 (9.4) | 2 (7.4) | |
| 1 | 10 (38.5) | 12 (46.2) | 20 (62.5) | 12 (44.4) | |
| 2 | 15 (57.7) | 9 (34.6) | 9 (28.1) | 13 (48.1) | |
| Arteriolar hyalinosis†, n (%) | 0.50 | ||||
| 0 | 0 (0) | 3 (11.5) | 1 (3.1) | 2 (7.4) | |
| 1 | 6 (23.1) | 10 (38.5) | 8 (25.0) | 6 (22.2) | |
| 2 | 20 (76.9) | 13 (50.0) | 23 (71.9) | 19 (70.4) | |
Data are presented as percent for categorical variables. † Defined by RPS Diabetic Nephropathy Classification.
Abbreviations: ESRD, end-stage renal disease; RPS, Renal Pathology Society; IFTA, interstitial fibrosis and tubular atrophy.
Spearman's correlation analysis showed that baseline serum transferrin positively correlated with baseline eGFR (r=0.21, P=0.03), serum hemoglobin (r=0.39, P<0.001) and albumin (r=0.69, P<0.001) but negatively correlated with proteinuria (r=-0.42, P<0.001) (Figure S3).
Tissue iron and transferrin staining
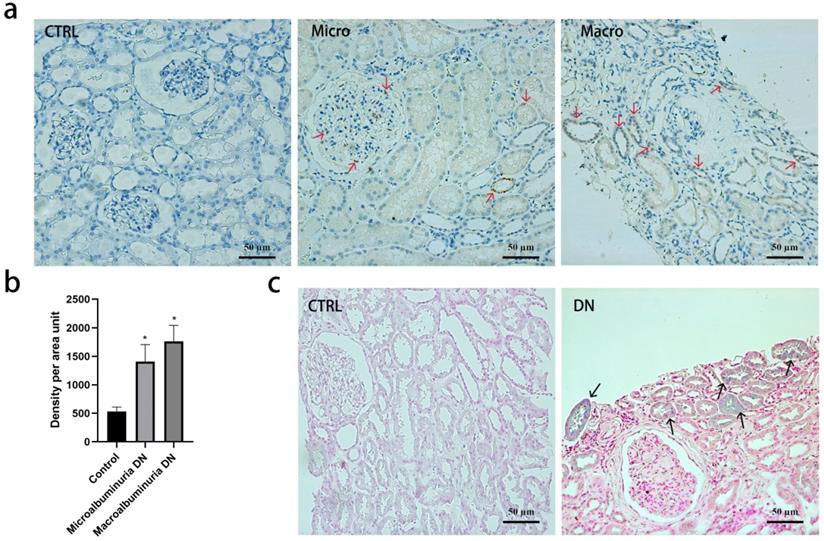
Immunohistochemistry revealed that transferrin was absent in normal kidney tissue but positive in DN kidney biopsies (Figure 3a and 3b). Staining of transferrin was strongly positive in the tubular epithelial cells but glomerular staining was less intense in DN. Perl's staining demonstrated that iron was deposited in a granular pattern in the tubular epithelial cells in DN, but not in controls (Figure 3c).
Transferrin and iron staining in kidney biopsy specimens. (a) Tissue transferrin (red arrows) by immunohistochemistry in normal kidney tissue, diabetic kidney tissue with microalbuminuria or macroalbuminuria. 200×, Bar=50 μm. (b) Quantification of the transferrin staining shows a significant increase in diabetic kidney tissue compared with normal kidney tissue (*p <0 001, compared with control group). Experiments were performed with ten participants for each group, and the results are expressed as mean ± SD. (c) Tissue iron deposition (black arrows) by Perl's staining in normal kidney tissue and diabetic kidney tissue. 200×, Bar=50 μm.
Discussion
Our results demonstrated that serum transferrin was an indicator for predicting ESRD in patients with T2DM and biopsy-proven DN, independent of other clinical features and pathological findings. Moreover, in DN, we detected iron deposition and transferrin staining more intensely in the tubular epithelial cells compared with normal controls. To our knowledge, this study is the first to reveal the associations between iron status and renal outcomes in patients with T2DM.
Serum transferrin, a glycoprotein with two-iron binding domains, is the most important molecule for transporting iron into cells. Produced mainly in the liver, transferrin has diverse functions such as iron transport across intestinal mucosa, intracellular iron transport, and, by chelating free iron, providing non-specific immunity against microorganisms [28, 29]. Previous study showed that low serum transferrin concentration was associated with liver transplantation and/or death [30]. But the relationship between transferrin and ESRD was unclear. The low concentrations of serum transferrin in patients with DN might be related to increased urinary transferrin excretion and iron deposition in the kidney. One of the proposed mechanisms of renal damage by transferrin is related to free iron toxicology. Zhang et al. suggested that transferrin-bound iron in the circulation is filtered by the pathological glomerulus into the tubular lumen [31], where it binds to transferrin receptors on the surface of tubular cells and is internalized by endosomes, ultimately leading to release of iron [7]. Our assays revealed that iron was deposited heavily in tubular cells, thus, providing a source of iron that could act on renal tubular cells. In a diabetic circumstance, cytokines cause an increase in transferrin receptors on the cell surface, favoring tissue accumulation of transferrin and deposition of iron [32]. Iron nephrotoxicity is due to 1) the production of cell-damaging reactive radicals by Fenton reactions, and 2) ferroptosis, programmed cell death triggered by iron [33], and 3) iron-induced RAS activation by upregulation of intra renal renin expression [34].
Another potential mechanism of renal injury by transferrin was the direct effect on proximal tubular cells or podocytes. In the early stages of DN, Gonzalez et al. found transferrin preferentially deposited in the cytoplasm of glomerular podocytes from diabetic patients [35]. The iron liberated from transferrin may contribute to the diabetogenic effect on the kidney. The increased transferrin upregulated complement C3 synthesis, and endothelin-1 and monocyte chemoattractant peptide-1 expression in cultured proximal tubular cells [36], which led to cell death.
In addition to its iron handling function, Reeds et al. proposed that transferrin concentration could be used to assess nutritional status [37]. Neyra et al. reported that serum transferrin had a shorter half-life than albumin, thus, serum transferrin concentration is theoretically a more sensitive marker of early protein depletion [38]. In our study, we observed that serum transferrin level was positively correlated with serum albumin and hemoglobin, which suggested that patients with lower transferrin had poor nutritional status and, in turn, they were more susceptible to infection.
TIBC was considered to represent serum transferrin levels [39, 40]. Although correlation between TIBC and transferrin is generally good, the reported conversion factors between the two analytes show large differences. Because iron binds to other plasma proteins (mainly albumin), TIBC methods generally overestimate transferrin iron-binding capacity [41]. We found that only the lowest TIBC quartile was associated with ESRD.
Previous epidemiology studies showed that low ferritin and high transferrin saturation were associated with better renal outcomes in patients with CKD or hemodialysis [42-44]. However, we did not find these relationships in our cohort. Ferritin is the main iron storage protein, and ferritin concentration is a common primary parameter for diagnosing absolute iron deficiency. Ferritin is also regulated by acute-phase proteins. The chronic inflammation in DN could contribute, to some extent, to increased ferritin concentration [45]. In addition, the increase in serum ferritin that occurs during infection, in liver disease, and which is associated with malignancies, may hinder assessment of iron in DN with the concurrent presence of the foregoing conditions [46]. Thus, the relationship between ferritin and renal outcomes in patients with CKD should be viewed with caution for patients with DN. TSAT reflects iron transport and sequestration, but it is also associated with inflammatory markers in DM. Although serum ferritin and transferrin saturation are easily attainable, they exhibit large biological variability that, contributes to inaccurate prediction of ESRD in DN.
There are several limitations to this study. First, due to the retrospective observational design, selection bias was inevitable and the sample size was limited. Nevertheless, we included in our analyses essentially all patients with biopsy-proven DN and complete iron status data who met the inclusion criteria (Figure 1). The clinical characteristics distributed similarly between patients with and without complete iron status data. The association of the serum transferrin with ESRD remained robust even after adjustment of multiple confounding factors. Second, in this association study, we could not discern whether altered iron homeostasis was a consequence or a driver of disease progression in patients with DN. Previous studies supported the conclusion that iron and iron-containing molecules overload the kidney and cause direct injury to renal tubular cells in vitro [47, 48] and in vivo [49]. In addition, in animal models of DN, iron chelators reduced the severity of kidney injury [50-52]. On the basis of current evidence, we propose that the excess tissue iron may cause development and progression of kidney disease [53]. Third, for this single-center study, we recruited only biopsy-proven DN patients, a condition that limited generalization of the prognostic value of low serum transferrin concentration for progression to ESRD. Still, the patients in our study included each stage of CKD with a wide range of diabetic duration. Moreover, all patients had undergone renal biopsy and had accurate pathology data. The comparisons of pathological parameters and iron status data for renal prognosis, which could not be obtained in the generalized diabetic population, provided stronger evidence for the conclusion of this study. The results in this study suggested that iron status should be monitored during all stages of chronic kidney disease.
In summary, we showed that serum transferrin predicted kidney-free survival independent of other iron status markers in biopsy-proven DN patients. Simultaneous changes in the same direction for serum transferrin and eGFR predicted a worse renal outcome. Therefore, in clinical settings, both low serum transferrin concentration and low eGFR can be of high diagnostic value in concomitantly predicting ESRD. Our findings emphasized that the availability of catalytic iron or iron that was available to participate in free radical reactions was a prerequisite for iron toxicity. Interventional trials are necessary to examine strategies to modulate the effect of iron metabolism on ESRD.
Abbreviations
T2DM: type 2 diabetes mellitus; DN: diabetic nephropathy; ESRD: end-stage renal disease; HR: hazard ratio; CKD: chronic kidney disease; ESA: erythropoiesis-stimulating agents; RPS: Renal Pathology Society; NDRD: nondiabetic renal diseases; ANCA: anti-neutrophil cytoplasmic antibody; GBM: glomerular basement membrane; BMI: body mass index; RAAS: renin-angiotensin aldosterone system; eGFR: estimated glomerular filtration rate; TIBC: total iron-binding capacity; TSAT: transferrin saturation; SD: standard deviation; IQR: interquartile ranges; LSD: least significant difference; CI: confidence interval; ROC: receiver operating characteristic; AUC: area under the curve.
Supplementary Material
Supplementary figures and tables.
Acknowledgements
The authors would like to thank the participating patients for their cooperation with this study.
Author Contributions
All authors participated in conceive, design, and review of the manuscript; Lijun Zhao analyzed the data, interpreted the results. Lijun Zhao drafted the manuscript. Fang Liu analyzed and interpreted data, edited/revised, and approved the final version of the manuscript. Lin Li performed pathological reviewing. Lijun Zhao, Yutong Zou, Junlin Zhang, Rui Zhang, Honghong Ren, and Ruikun Guo carried out the data collecting and recording, contributed to the discussion. Jie Zhang contributed to the discussion of this manuscript. Fang Liu is the guarantor of this work and had full access to all the data in this study, and takes responsibility for the integrity of the data.
Funding
This study was supported by the projects of the National Natural Science Foundation of China (81970626 and 81670662), Key Research and Development Project of Sichuan Science and Technology Department (19ZDYF1273), the Popularization Project of the Science and Technology Project of the Sichuan Health Planning Committee (19PJ250). The funding source played no role in study design, data analysis, and manuscript writing or submission.
Ethics approval
All procedures performed in studies involving human participants were in accordance with the ethical standards of the institutional and/or national research committee and with the 1964 Helsinki Declaration and its later amendments or comparable ethical standards. This study was approved by the institutional review board at the West China Hospital of Sichuan University [Approval No. 2003 (1)].
Informed consent
Informed consent was obtained from all individual participants included in the study.
Competing Interests
The authors have declared that no competing interest exists.
References
1. Zhang L, Long J, Jiang W. et al. Trends in Chronic Kidney Disease in China. The New England journal of medicine. 2016;375:905-6
2. Wang L, Gao P, Zhang M. et al. Prevalence and Ethnic Pattern of Diabetes and Prediabetes in China in 2013. Jama. 2017;317:2515-23
3. Hansen JB, Moen IW, Mandrup-Poulsen T. Iron: the hard player in diabetes pathophysiology. Acta Physiol (Oxf). 2014;210:717-32
4. Shah S. Role of iron in progressive renal disease. American journal of kidney diseases: the official journal of the National Kidney Foundation. 2001;37:S30-3
5. Cheung CL, Cheung TT, Lam KS. et al. High ferritin and low transferrin saturation are associated with pre-diabetes among a national representative sample of U.S. adults. Clinical nutrition (Edinburgh, Scotland). 2013;32:1055-60
6. Robles NR, Ramos JL, Chavez E. et al. Iron deficiency in chronic kidney disease patients with diabetes mellitus. Diabetes & metabolic syndrome. 2018;12:933-7
7. Gaweda AE. Markers of iron status in chronic kidney disease. Hemodialysis international International Symposium on Home Hemodialysis. 2017;21(Suppl 1):S21-s7
8. Egrie JC, Browne JK. Development and characterization of novel erythropoiesis stimulating protein (NESP). Nephrology, dialysis, transplantation: official publication of the European Dialysis and Transplant Association - European Renal Association. 2001 16 Suppl 3
9. Macdougall IC. CERA (Continuous Erythropoietin Receptor Activator): a new erythropoiesis-stimulating agent for the treatment of anemia. Curr Hematol Rep. 2005;4:436-40
10. Locatelli F, Bárány P, Covic A. et al. Kidney Disease: Improving Global Outcomes guidelines on anaemia management in chronic kidney disease: a European Renal Best Practice position statement. Nephrology, dialysis, transplantation: official publication of the European Dialysis and Transplant Association - European Renal Association. 2013;28:1346-59
11. Cho ME, Hansen JL, Peters CB. et al. An increased mortality risk is associated with abnormal iron status in diabetic and non-diabetic Veterans with predialysis chronic kidney disease. Kidney international. 2019;96:750-60
12. Maruyama Y, Yokoyama K, Yokoo T. et al. The Different Association between Serum Ferritin and Mortality in Hemodialysis and Peritoneal Dialysis Patients Using Japanese Nationwide Dialysis Registry. PloS one. 2015;10:e0143430
13. Hasuike Y, Nonoguchi H, Tokuyama M. et al. Serum ferritin predicts prognosis in hemodialysis patients: the Nishinomiya study. Clinical and experimental nephrology. 2010;14:349-55
14. Robles NR, Ramos JL, Chavez E. et al. Iron deficiency in chronic kidney disease patients with diabetes mellitus. Diabetes Metab Syndr. 2018;12:933-7
15. Davis RJ, Corvera S, Czech MP. Insulin stimulates cellular iron uptake and causes the redistribution of intracellular transferrin receptors to the plasma membrane. The Journal of biological chemistry. 1986;261:8708-11
16. Li L, Zhang X, Li Z. et al. Renal pathological implications in type 2 diabetes mellitus patients with renal involvement. Journal of diabetes and its complications. 2017;31:114-21
17. Pinsker JE, Shank T, Dassau E. et al. Comment on American Diabetes Association. Approaches to glycemic treatment. Sec. 7. In Standards of Medical Care in Diabetes-2015. Diabetes Care 2015;38(Suppl. 1):S41-S48. Diabetes care. 2015;38:e174
18. Madhusudhan T, Wang H, Dong W. et al. Defective podocyte insulin signalling through p85-XBP1 promotes ATF6-dependent maladaptive ER-stress response in diabetic nephropathy. Nature communications. 2015;6:6496
19. Tervaert TW, Mooyaart AL, Amann K. et al. Pathologic classification of diabetic nephropathy. Journal of the American Society of Nephrology: JASN. 2010;21:556-63
20. Yamanouchi M, Furuichi K, Hoshino J. et al. Nonproteinuric Versus Proteinuric Phenotypes in Diabetic Kidney Disease: A Propensity Score-Matched Analysis of a Nationwide, Biopsy-Based Cohort Study. Diabetes care. 2019;42:891-902
21. Wang Y, Zhang J, Zhao Y. et al. COL4A3 Gene Variants and Diabetic Kidney Disease in MODY. Clinical journal of the American Society of Nephrology: CJASN. 2018;13:1162-71
22. Mise K, Hoshino J, Ubara Y. et al. Renal prognosis a long time after renal biopsy on patients with diabetic nephropathy. Nephrology, dialysis, transplantation: official publication of the European Dialysis and Transplant Association - European Renal Association. 2014;29:109-18
23. Okada T, Nagao T, Matsumoto H. et al. Histological predictors for renal prognosis in diabetic nephropathy in diabetes mellitus type 2 patients with overt proteinuria. Nephrology. 2012;17:68-75
24. Mottl AK, Gasim A, Schober FP. et al. Segmental Sclerosis and Extracapillary Hypercellularity Predict Diabetic ESRD. Journal of the American Society of Nephrology: JASN. 2018;29:694-703
25. Zhao LJ, Xiao Y, Meng X. et al. Application of a Simple Quantitative Assessment of Atherosclerotic Lesions in Freshly Isolated Aortas from Rabbits. Cardiovasc Toxicol. 2018;18:537-46
26. Gray RJ. A Proportional Hazards Model for the Subdistribution of a Competing Risk AU - Fine, Jason P. Journal of the American Statistical Association. 1999;94:496-509
27. Mise K, Hoshino J, Ueno T. et al. Clinical and pathological predictors of estimated GFR decline in patients with type 2 diabetes and overt proteinuric diabetic nephropathy. Diabetes/metabolism research and reviews. 2015;31:572-81
28. Ganz T. Iron and infection. International journal of hematology. 2018;107:7-15
29. Frazer DM, Anderson GJ. The regulation of iron transport. BioFactors (Oxford, England). 2014;40:206-14
30. Anastasiou OE, Kälsch J, Hakmouni M. et al. Low transferrin and high ferritin concentrations are associated with worse outcome in acute liver failure. Liver international: official journal of the International Association for the Study of the Liver. 2017;37:1032-41
31. Zhang D, Meyron-Holtz E, Rouault TA. Renal iron metabolism: transferrin iron delivery and the role of iron regulatory proteins. Journal of the American Society of Nephrology: JASN. 2007;18:401-6
32. Hirayama M, Kohgo Y, Kondo H. et al. Regulation of iron metabolism in HepG2 cells: a possible role for cytokines in the hepatic deposition of iron. Hepatology (Baltimore, Md). 1993;18:874-80
33. Dixon SJ, Lemberg KM, Lamprecht MR. et al. Ferroptosis: an iron-dependent form of nonapoptotic cell death. Cell. 2012;149:1060-72
34. Chaudhary K, Chilakala A, Ananth S. et al. Renal Iron Accelerates the Progression of Diabetic Nephropathy in HFE (High Fe-iron) Gene Knockout Mouse Model of Iron Overload. American journal of physiology Renal physiology. 2019
35. Gonzalez S, Vargas L. Diabetogenic transferrin damages podocytes in early human diabetic nephropathy. Horm Metab Res. 2001;33:84-8
36. Tang S, Lai KN, Chan TM. et al. Transferrin but not albumin mediates stimulation of complement C3 biosynthesis in human proximal tubular epithelial cells. American journal of kidney diseases: the official journal of the National Kidney Foundation. 2001;37:94-103
37. Reeds PJ, Laditan AA. Serum albumin and transferrin protein-energy malnutrition. Their use in the assessment of marginal undernutrition and the prognosis of severe undernutrition. The British journal of nutrition. 1976;36:255-63
38. Neyra NR, Hakim RM, Shyr Y. et al. Serum transferrin and serum prealbumin are early predictors of serum albumin in chronic hemodialysis patients. Journal of renal nutrition: the official journal of the Council on Renal Nutrition of the National Kidney Foundation. 2000;10:184-90
39. Beerenhout C, Bekers O, Kooman JP. et al. A comparison between the soluble transferrin receptor, transferrin saturation and serum ferritin as markers of iron state in hemodialysis patients. Nephron. 2002;92:32-5
40. Kalantar-Zadeh K, Kleiner M, Dunne E. et al. Total iron-binding capacity-estimated transferrin correlates with the nutritional subjective global assessment in hemodialysis patients. American journal of kidney diseases: the official journal of the National Kidney Foundation. 1998;31:263-72
41. Kasvosve I, Delanghe J. Total iron binding capacity and transferrin concentration in the assessment of iron status. Clinical chemistry and laboratory medicine. 2002;40:1014-8
42. Rambod M, Kovesdy CP, Kalantar-Zadeh K. Combined high serum ferritin and low iron saturation in hemodialysis patients: the role of inflammation. Clinical journal of the American Society of Nephrology: CJASN. 2008;3:1691-701
43. Ogawa C, Tsuchiya K, Tomosugi N. et al. Low levels of serum ferritin and moderate transferrin saturation lead to adequate hemoglobin levels in hemodialysis patients, retrospective observational study. PloS one. 2017;12:e0179608
44. Lee SW, Kim YH, Chung W. et al. Serum Hepcidin and Iron Indices Affect Anemia Status Differently According to the Kidney Function of Non-Dialysis Chronic Kidney Disease Patients: Korean Cohort Study For Outcome in Patients with Chronic Kidney Disease (KNOW-CKD). Kidney & blood pressure research. 2017;42:1183-92
45. Fernandez-Real JM, Lopez-Bermejo A, Ricart W. Cross-talk between iron metabolism and diabetes. Diabetes. 2002;51:2348-54
46. Kalantar-Zadeh K, Kalantar-Zadeh K, Lee GH. The fascinating but deceptive ferritin: to measure it or not to measure it in chronic kidney disease? Clinical journal of the American Society of Nephrology: CJASN. 2006;1(Suppl 1):S9-18
47. Sheerin NS, Sacks SH, Fogazzi GB. In vitro erythrophagocytosis by renal tubular cells and tubular toxicity by haemoglobin and iron. Nephrology, dialysis, transplantation: official publication of the European Dialysis and Transplant Association - European Renal Association. 1999;14:1391-7
48. Sponsel HT, Alfrey AC, Hammond WS. et al. Effect of iron on renal tubular epithelial cells. Kidney international. 1996;50:436-44
49. Gao W, Li X, Gao Z. et al. Iron increases diabetes-induced kidney injury and oxidative stress in rats. Biological trace element research. 2014;160:368-75
50. Ikeda Y, Enomoto H, Tajima S. et al. Dietary iron restriction inhibits progression of diabetic nephropathy in db/db mice. American journal of physiology Renal physiology. 2013;304:F1028-36
51. Morita T, Nakano D, Kitada K. et al. Chelation of dietary iron prevents iron accumulation and macrophage infiltration in the type I diabetic kidney. Eur J Pharmacol. 2015;756:85-91
52. Zou C, Liu X, Liu R. et al. Effect of the oral iron chelator deferiprone in diabetic nephropathy rats. Journal of diabetes. 2017;9:332-40
53. Martines AM, Masereeuw R, Tjalsma H. et al. Iron metabolism in the pathogenesis of iron-induced kidney injury. Nat Rev Nephrol. 2013;9:385-98
Author contact
![]() Corresponding author: Fang Liu, MD, PhD. Department: Division of Nephrology, West China Hospital of Sichuan University; No. 37, Guoxue Alley, Chengdu, Sichuan Province, China, 610041; Tel.: 86-28-18980601214; Fax: 86-28-85422335; E-mail: liufangfhcom.
Corresponding author: Fang Liu, MD, PhD. Department: Division of Nephrology, West China Hospital of Sichuan University; No. 37, Guoxue Alley, Chengdu, Sichuan Province, China, 610041; Tel.: 86-28-18980601214; Fax: 86-28-85422335; E-mail: liufangfhcom.