Impact Factor ISSN: 1449-1907
- Issue 8; 2026
- Issue 7; 2026
- Issue 6; 2026
- Issue 5; 2026
- Issue 4; 2026
- Volume 23; 2026
- Past Issues
- Editorial Board
- Cover Images
- Index & Coverage
- Cover Suggestion
- Special Issues
Introduction
Materials and Methods
Results
Discussion
Conclusions
Abbreviations
Acknowledgements
References

 Global reach, higher impact
Int J Med Sci 2020; 17(11):1610-1624. doi:10.7150/ijms.46874 This issue Cite
Research Paper
Association of CXCL13 and Immune Cell Infiltration Signature in Clear Cell Renal Cell Carcinoma
Fangdong Jiao, Hao Sun, Qingya Yang, Hui Sun, Zehua Wang, Ming Liu, Jun Chen ![]()
Department of Urology, Qilu Hospital (Qingdao), Cheeloo College of Medicine, Shandong University, 758 Hefei Road, Qingdao, Shandong, 266035, China.
Received 2020-4-10; Accepted 2020-6-2; Published 2020-6-27
Abstract
Clear cell renal cell carcinoma (ccRCC) is one of the most commonly diagnosed kidney tumors and is often accompanied by immune cell infiltration. In this study, we attempted to identify microenvironment-associated genes and explore the correlation between CXCL13 and tumor-infiltrating immune cells (TIICs). Gene expression profiles and their corresponding clinical information were downloaded from The Cancer Genome Atlas (TCGA) database. The ESTIMATE (Estimation of Stromal and Immune cells in Malignant Tumor tissues using Expression data) algorithm was used to calculate immune cell and stromal cell scores, according to which patients were divided into high- and low-score groups, allowing differentially expressed genes (DEGs) to be identified. Functional enrichment and PPI network analysis were used to identify the functions of the DEGs. CIBERSORT algorithm and TIMER analysis were used to evaluate the immune score. Oncomine and TCGA database were used to explore CXCL13 mRNA expression level in ccRCC. High ESTIMATE score was significantly associated with prognosis. Functional enrichment analysis clarified that DEGs were associated with T cell activation, immune response-regulating cell surface receptor signaling pathway, and positive regulation of cytokine production. PPI network was used to identify CXCL13 as a hub gene. And CIBERSORT algorithm and TIMER analysis showed that strong correlation between CXCL13 expression level and TIICs. Oncomine database was used to validate high CXCL13 expression level in ccRCC tissue, compared to normal tissues. In conclusion, we obtained a list of tumor microenvironment-related genes and identified CXCL13 as an immune response biomarker in patients with ccRCC, GSEA analysis, wound healing and transwell assays showed CXCL13 played a role in tumor migration.
Keywords: Clear cell renal cell carcinoma, immune cell infiltration signature, CXCL13, TCGA
Introduction
Renal cell carcinoma (RCC) is the one of the most common types of kidney tumor, and remains a major global medical problem despite the numerous new treatment options available [1]. Among these RCCs, the most common subtype is clear cell RCC (ccRCC) [2]. Despite the novel, targeted immune drug therapy has increased the prognosis of patients, elucidating the mechanism of RCC remains vital. Blocking the interaction between programmed death-1 (PD-1)/programmed death-ligand 1 (PD-L1) has been shown to improve the prognosis of RCC [3], whilst promoting T-cell proliferation and survival by using high-doses of interleukin-2 has an objective response in approximately 10-25 % of patients [4]. These results reflect the sensitivity of RCC to immunotherapy. RCC is often accompanied by the tumor-infiltrating immune cells (TIICs), including macrophages and lymphocytes [5]. Infiltration by lymphocytes is an immune reaction associated with the elimination of cancer cells and thus improved prognosis in most cancers, including lung cancer, colorectal cancer, and ovarian cancer [6]. However, higher levels of tumor-infiltrating lymphocytes usually indicates a poor prognosis and reduced survival in RCC [7, 8]. These findings suggest that the tumor microenvironment plays a crucial role in the occurrence and development of RCC.
The tumor microenvironment consists of immune cells, mesenchymal cells, endothelial cells, extracellular matrix (ECM) molecules, and inflammatory mediators [9]. Studies have shown that the tumor microenvironment affects the gene expression of tumor tissues and patient outcome, and therefore has a diagnostic and prognostic value for tumors [10-13]. Immune and stromal cells make up the non-tumor components of the tumor microenvironment. The ESTIMATE (Estimation of Stromal and Immune cells in Malignant Tumor tissues using Expression data) algorithm has been developed to predict tumor purity using gene expression data [12]. By analyzing the specific gene expression signature of a tumor, ESTIMATE can calculate immune cell and stromal cell scores to predict non-tumor cell infiltration. Other specific gene expression signature-based algorithms have been shown to be effective when applied to colon cancer [14], breast cancer [15], prostate cancer [16] and glioblastoma [13]. Furthermore, a newly computational algorithm, CIBERSORT, was used to enumerate 22 immune cell subsets based on 547 key genes, and could reveal the several TIICs expression levels in different groups.
Several prognostic factors are currently available for RCC, including tumor staging, lymph node involvement, histological subtypes, and Fuhrman grading which are gold standard to predict the prognosis of RCC. Despite these biomarkers were used for early detection or prognosis, we still needed another biomarkers to enlarge the prognosis network of RCC [17]. The Cancer Genome Atlas (TCGA) has been established to map the genome variations of human cancers using genomic analysis techniques, providing a wealth of clinical and expression profile data [18, 19]. In this study, we used the dataset of patients with ccRCC from the TCGA database, ESTIMATE algorithm to evaluate the effect of non-tumor cell infiltration on prognosis, identifying a series of microenvironment-related genes, and CIBERSORT algorithm to quantify the proportions of immune cells.
In this study, we identified CXCL13 is associated with TIICs and prognosis of ccRCC patients. And GSEA analysis showed CXCL13 might play an important role in tumor migration.
Materials and Methods
Database and identification of microenvironment-associated genes
The gene expression profiles and clinical data of patients with ccRCC was obtained from the TCGA data portal (https://tcga-data.nci.nih.gov/tcga/) and the ESTIMATE algorithm was used to calculate immune cell and stromal cell scores from the downloaded data. Data analysis was performed using the R software package, limma [20]. A fold change of > 1.5 and false discovery rate (FDR) of < 0.05 were used as cutoffs to identify differentially expressed genes (DEGs). Volcano plots and heat maps were generated using the ggplot2 and pheatmap packages, respectively, whilst the Venn diagram package was used to identify overlapping genes.
DEG enrichment analysis and protein-protein interaction (PPI) network construction
Gene ontology (GO) enrichment analysis and Kyoto Encyclopedia of Genes and Genomes (KEGG) pathway enrichment analysis were performed using DAVID (The Database for Annotation, Visualization and Integrated Discovery) [21]. An FDR of < 0.05 was used as the cut-off value. The STRING database [22] and cytoscape software [23] were used to retrieve and reconstruct a PPI network. Important nodes and subnetworks were predicted and explored using cytohubba, a cytoscape plugin [24], and the top 10 hub genes were selected from the results of each method.
Assessment of immune cell type fractions
To quantify the proportions of immune cells in the ccRCC samples, the analytical tool called CIBERSORT and the LM22 gene signature were used in this study (https://cibersortx.stanford.edu/). The LM22 gene signature contains 547 genes that distinguish 22 human hematopoietic cell phenotypes, with the analysis conducted with 1,000 permutations [25]. These TIICs included B cells (memory and naïve B cells), dendritic cells(activated and resting dendritic cells), macrophages (M0, M1 and M2 macrophages), 7 T-cell types (T follicular helper cells, resting memory CD4+ T cells, activated memory CD4+ T cells, naïve CD4+ T cells, gamma delta T cells, CD8+ T cells and T regulatory cells), natural killer cells (resting natural killer and activated NK cells), mast cells (resting and activated mast cells), monocytes, plasma cells, neutrophils and eosinophils. The CIBERSORT values generated were defined as immune cell infiltration fraction per sample. For each sample, the sum of 22 evaluated immune cell type fractions equaled 1.
TIMER Database analysis
TIMER is a comprehensive resource for systematic analysis of immune infiltrates across diverse cancer types (https://cistrome.shinyapps.io/timer/) [26]. It applies a deconvolution previously published statistical method to infer the abundance of TIICs from TCGA cohort, including 10,897 samples across 32 cancer types [27].
Oncomine Database analysis
The expression level of CXCL13 in ccRCC was identified in the Oncomine database (https://www.oncomine.org/resource/login.html) [28]. The threshold was determined according to the following values: p value of 0.05, fold change of 2.0.
Gene set enrichment analysis (GSEA) analysis
GSEA was used to further understand CXCL13-related pathways. The expression level of CXCL13 was used as the phenotype annotation and ccRCC patients in the TCGA cohort were dichotomized into low and high categories. GSEA version 3.0 software (www.broadinstitute.org/gsea) was used to analyze data. The Molecular Signatures Database (MSigDB) of c5 (c5.all.v6.2.symbols.gmt) was used to assess the functional differences [29, 30]. FDR < 0.01 was used as the cut-off criteria.
Cell culture and reagents
All cells were obtained from ATCC. 786-O and OS-RC-2 cells were cultured in RPMI-1640 medium (Gibco) containing 10% fetal bovine serum (Gibco). Recombinant human CXCL13 was purchased from PeproTech.
Wound healing and transwell assay
Cell migration was determined by wound healing assay. Briefly, CXCL13-treated and control cells in 6-well plates were wounded by using sterile 200 μl pipette tip for 20h. The speed of wound closure was determined by Photograph. Meanwhile, polycarbonate membrane filters of the chamber were used for the transwell assay. 200 μl cells suspension at a density of 5×10⁵ cells/ml in serum-free medium were seeded into the upper part of the chamber. And the lower chamber was filled with 600 μl medium containing 10% fetal bovine serum. After 24 h of incubation at 37 °C, and the migrated cells adhered to the bottom of the upper chamber were fixed in methanol and stained with crystal violet, photographed and counted via Image J.
Statistical analysis
The Statistical Package for Social Science (SPSS version 23.0) program was performed in this study. To investigate potential risk factors for overall mortality, a log-rank test was performed during Kaplan-Meier survival analysis. Correlation analysis was assessed by using chi-square test and Pearson's correlation coefficient test. The two-tailed p value was used in this study, and a p value of <0.05 considered statistically significant (* p<0.05, ** p<0.01, *** p<0.001 and **** p<0.0001).
Results
Immune cell and stromal cell scores are associated with renal cell carcinoma survival
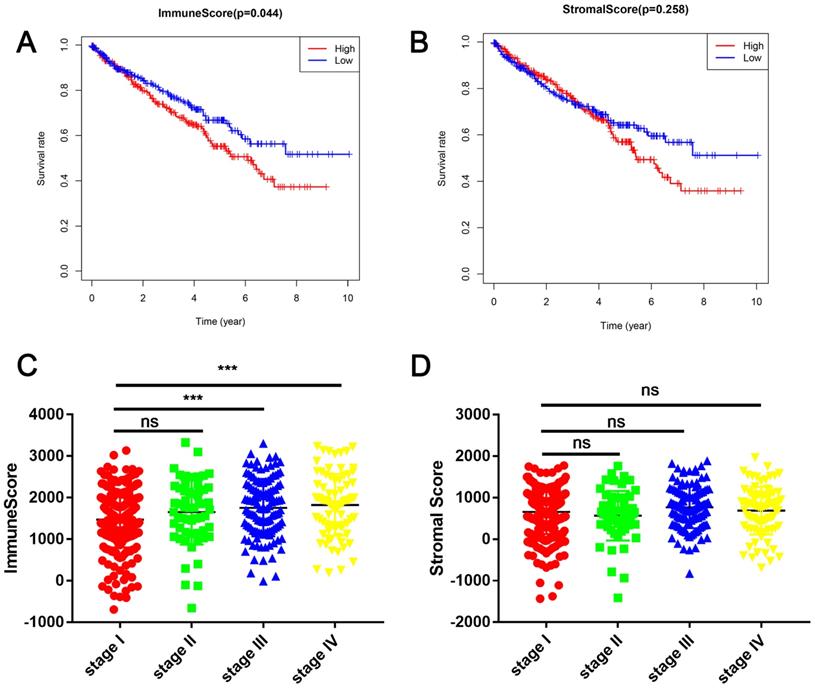
In this study, the clinical information and gene expression profiles of 530 patients with RCC were downloaded from the TCGA database. Of these patients, 188 (35.5 %) were females and 342 (64.5 %) were males, while 265 (50 %) cases were stage I, 55 (10.3 %) were stage II, 124 (23.4 %) were stage III, 83 (15.7 %) were stage IV, and 3 (0.6 %) were of unknown stage. The ESTIMATE algorithm was used to calculate immune cell and stromal cell scores to predict the infiltration of non-tumor cells. Next, we divided the patients with RCC into high- and low-score groups based on the median immune cell and stromal cell scores. The clinicopathologic characteristics of the 530 patients are shown in Table 1. Kaplan-Meier survival analysis revealed that patients with low immune cell scores had a higher survival rate than those with high immune cell scores (Figure 1A). Similarly, patients with lower stromal cell scores had increased overall survival (Figure 1B), although there was no statistically significant difference. Next, we analyzed the relationship between these scores and clinical stage, revealing that immune cell scores were higher in patients with a higher pathological stage (Figure 1C).
Patient characteristics and pathologic features
| Immune scores | P-value | StromalScore | P-value | ||||
|---|---|---|---|---|---|---|---|
| Variables | Total patients | low | high | low | high | ||
| Age | 60.56± 12.14 | 60.77± 12.15 | 60.35±12.14 | 62.38±11.96 | 58.75±12.06 | ||
| 0.931 | 0.003 | ||||||
| <60 | 245 | 122 | 123 | 105 | 140 | ||
| ≥60 | 285 | 143 | 142 | 160 | 125 | ||
| Gender | 0.069 | 0.084 | |||||
| female | 186 | 103 | 83 | 103 | 83 | ||
| male | 344 | 162 | 182 | 162 | 182 | ||
| Stage | 0.011 | 0.11 | |||||
| stage I | 265 | 151 | 114 | 132 | 133 | ||
| stage II | 56 | 25 | 31 | 37 | 20 | ||
| stage III | 123 | 55 | 68 | 59 | 64 | ||
| stage IV | 82 | 32 | 50 | 37 | 45 | ||
| unknown | 3 | 1 | 2 | 0 | 3 | ||
Immune cell and stromal cell scores are associated with renal cell carcinoma (RCC) survival (A) Patients with RCC were divided into two groups based on their immune cell scores. As shown in the Kaplan-Meier survival curve, patients with low immune cell scores had a higher overall survival than those with high immune cell scores (hazard ratio [HR] 1.372; 95 % CI 1.01-1.864; P = 0.0430 by log-rank test). (B) In a similar manner, patients with RCC were divided into two groups based on their stromal cell scores. The Kaplan-Meier survival curve shows no statistically significant difference between the two groups (P = 0.2547 by log-rank test). (C) Immune cell scores were higher in patients with a higher pathological stage. (***P < 0.001, by one-way ANOVA followed by Tukey's multiple-comparison post-hoc test). (D) The stromal cell scores showed no statistically significant differences at different pathological stages.
Comparison of the gene expression profiles of patients with RCC with different immune cell and stromal cell scores
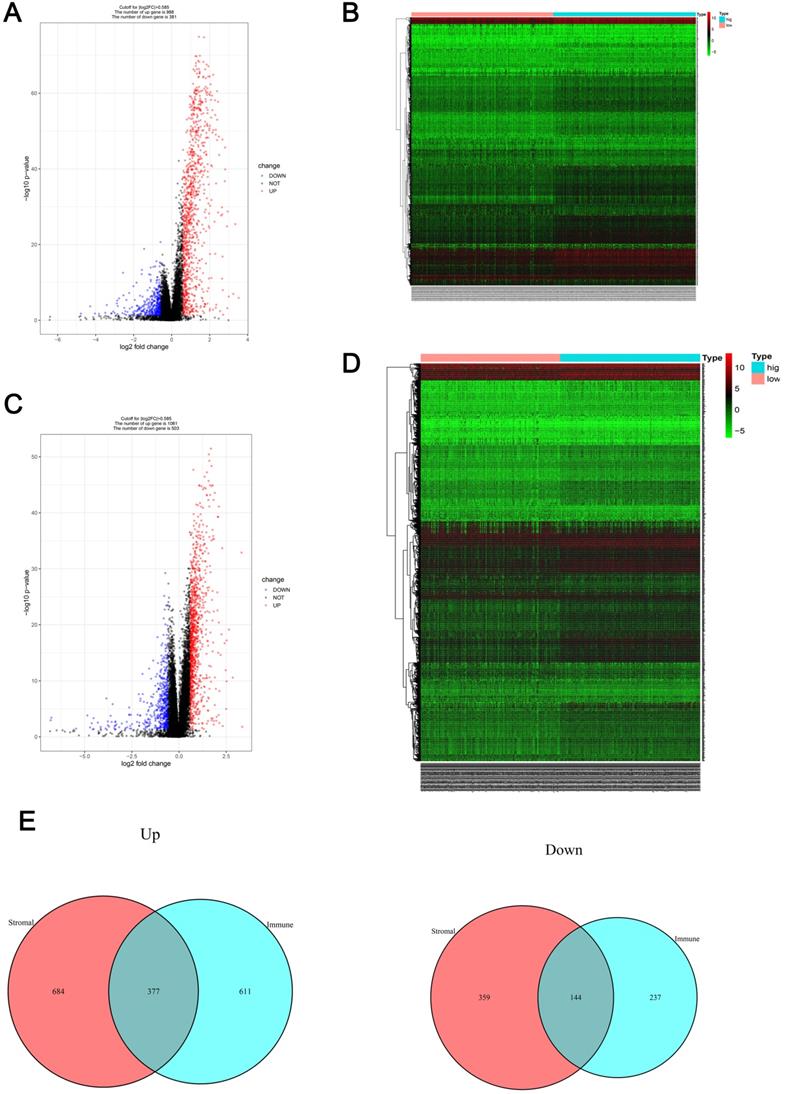
Patients were divided into low- and high-immune cell score groups and their gene expression profiles were analyzed to identify DEGs with corrected P-values < 0.05 and FDRs > 1.5. A total of 1369 DEGs (988 up-regulated and 381 down-regulated) were identified (Figure 2A) and visualized using a heatmap (Figure 2B). Using a similar method with the stromal cell scores, 1564 DEGs (1061 up-regulated and 503 down-regulated) were identified (Figure 2C, D). The co-regulated DEGs (377 co-upregulated and 144 co-downregulated) were visualized using Venn diagrams (Figure 2E).
Gene expression profile comparison of patients with RCC with different immune cell and stromal cell scores (A-B) The volcano plot and heatmap show the 1369 genes (988 up-regulated and 381 down-regulated) identified based on the immune cell scores. (C-D) The volcano plot and heatmap show the 1564 genes (1061 up-regulated and 503 down-regulated) identified based on the stromal cell scores. (E) Venn diagrams show the 377 co-upregulated and 144 co-downregulated genes.
GO and KEGG pathway enrichment analysis of DEGs
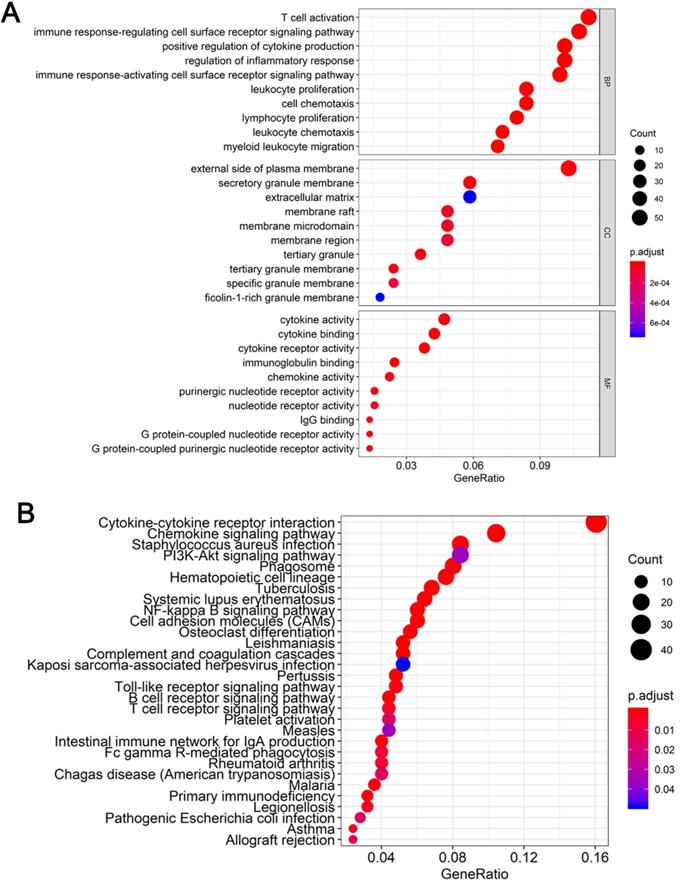
To determine the functions of the 521 DEGs, we performed GO enrichment analysis; the top 10 GO terms are shown in Figure 3A. DEGs were enriched for T cell activation, immune response-regulating cell surface receptor signaling pathway, and positive regulation of cytokine production in the biological process category, the external side of the plasma membrane, secretory granule membrane, and extracellular matrix in the cellular component category, and cytokine activity, cytokine binding, and cytokine receptor activity in the molecular function category. We also performed KEGG pathway enrichment analysis to determine the pathways most enriched for DEGs, which included cytokine-cytokine receptor interactions, chemokine signaling pathways, and the PI3K-AKT signaling pathway (Figure 3B).
Functional enrichment analysis of DEGs (A) Top 10 biological process, cellular component, and molecular function terms for the co-DEGs. (B) KEGG pathways enriched for the co-DEGs.
PPI network analysis and identification of prognosis-associated genes
To explore the relationships between the DEGs, The Search Tool for the Retrieval of Interacting Genes (STRING) database and Cytoscape software were used to construct a PPI network for the DEGs (Figure 4A). The important nodes and subnetworks of the PPI were predicted and explored using CytoHubba; the 10 most significant node genes were ADCY7, GPR55, CCR4, GNG8, GNB4, C3, CCL21, CCR7, CCL19, and CXCL13.
PPI network analysis and identification of prognosis-associated genes (A) Protein-protein interaction networks of the co-DEGs. (B-D) Kaplan-Meier plotters and log-rank tests for the prognostic value of DEGs. (B) CC4, (C) GNG8, (D) CXCL13.
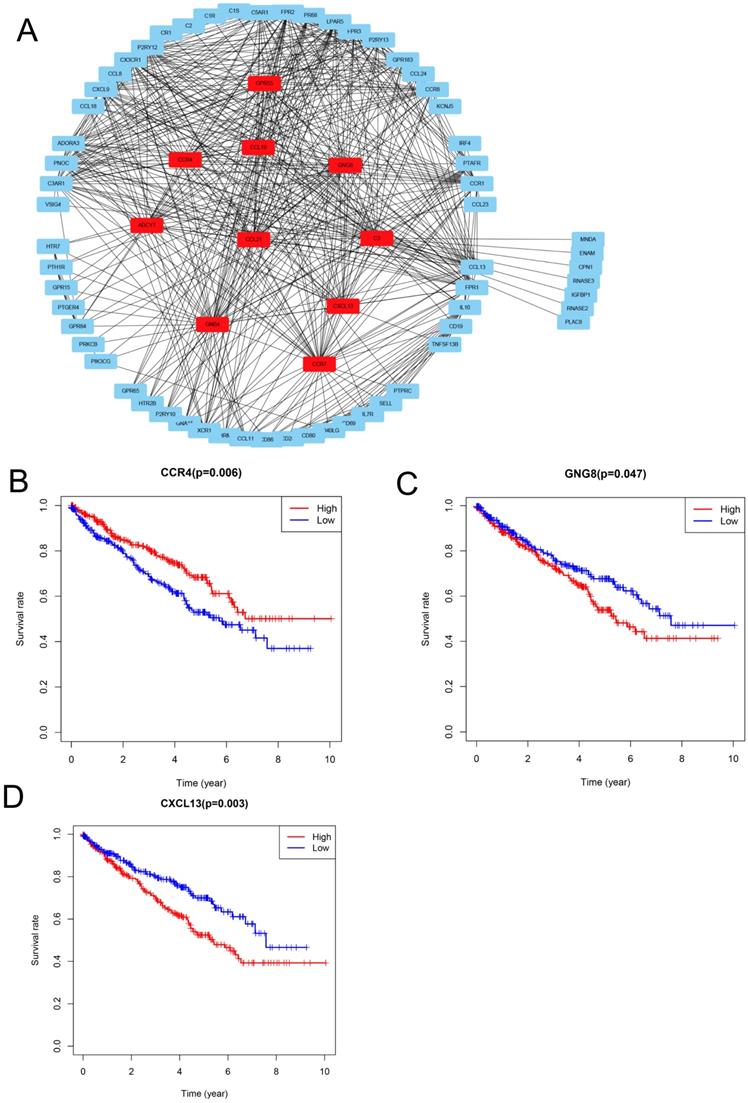
Since high levels of immune cell infiltration can reduce RCC prognosis, we identified genes affecting the prognosis of patients with RCC among top 10 hub genes. As shown in Figure 4B-D, CCR4, GNG8 and CXCL13 were associated with prognosis of ccRCC patients.
The distribution of TIICs in ccRCC according to CXCL13 expression level
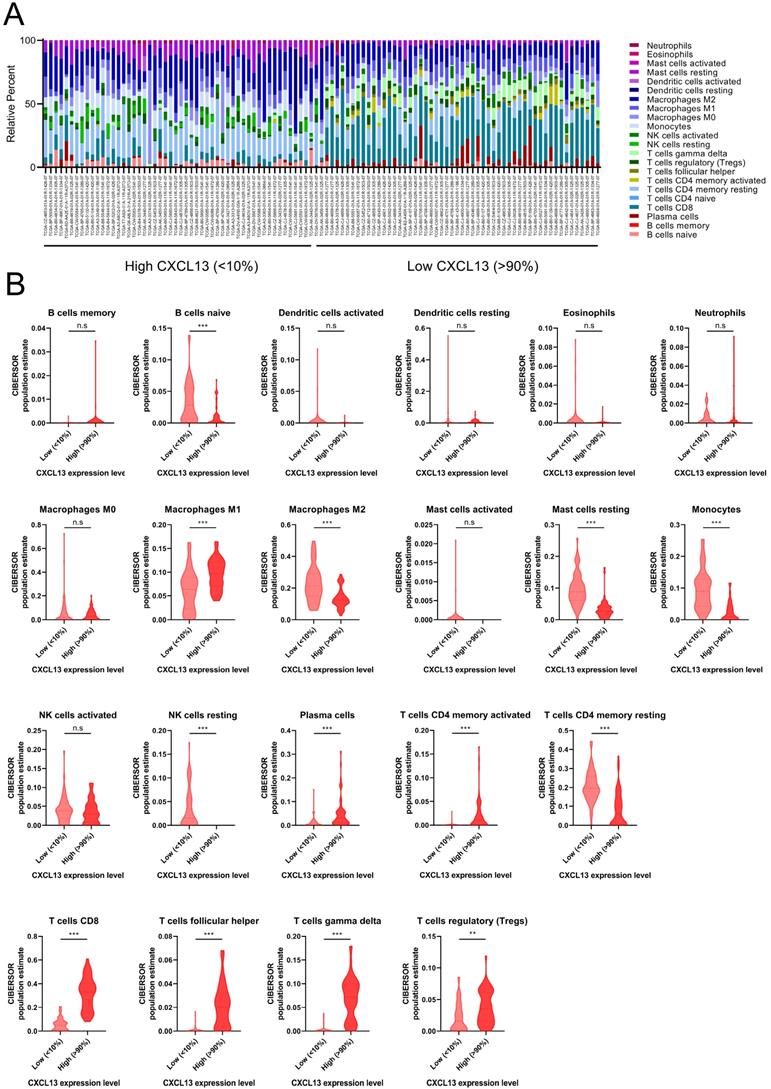
ccRCC patients from TCGA was divided into low (bottom 10% lowest-expressing CXCL13 samples) and high CXCL13 (top 10% highest-expressing CXCL13 samples) expression group. The differences between 22 subpopulations of TIICs in two groups were investigated using the CIBERSORT algorithm. We evaluated the average proportion of each immune cell type. Figure 5A was shown the details of the distribution of TIICs in both groups. There were large differences in the composition of TIICs in two groups. The results revealed that macrophages M1 cells were highly present in high CXCL13 ccRCC tissues, as well as plasma cells, CD4+ memory activated T cells, CD8+ T cells, follicular helper T cells, gamma delta T cells and Tregs (p<0.05). Moreover, the proportion of naïve B cells, macrophages M2 cells, resting mast cells, monocytes, resting NK cells and CD4+ memory resting T cells was higher in low CXCL13 expression tissues compared to high CXCL13 expression tissues (p<0.05).
The landscape of immune infiltration in ccRCC (A) The difference of immune infiltration between top 10% highest-expressing and bottom 10% lowest-expressing CXCL13 samples. (B) The quantified contrast of the distribution of TIIC subtypes between top 10% highest-expressing and bottom 10% lowest-expressing CXCL13 samples *p < 0.05; **p < 0.01, ***p<0.001.
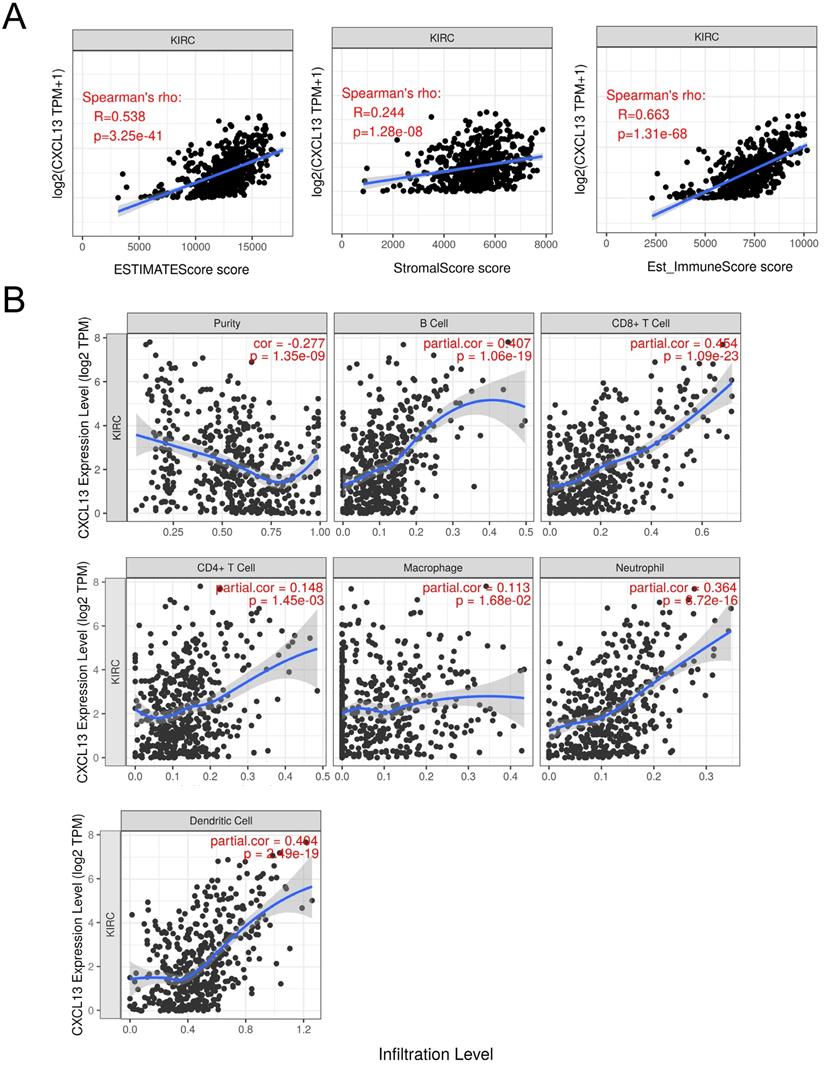
To further determine the correlation between CXCL13 and TIICs, ESTIMATE was used to evaluate immune score. As shown in Figure 6A, strong correlation was found in ESTIMATE score, stromal score and immune score (r=0.538, 0.244 and 0.663, respectively). TIMER analysis was used to clarify the correlation of CXCL13 expression with immune infiltration level in ccRCC, and the results revealed that CXCL13 expression was significantly negatively related to tumor purity and had significant positive correlations with infiltrating levels of B cells, CD8+ T cells, CD4+ T cells, macrophages, neutrophils, and dendritic cells (Figure 6B). Additionally, we analyzed the correlation between CXCL13 expression and immune marker genes of immune cells (Table 2), and we found that the expression levels of most marker sets of immune cells are correlated with CXCL13, except for M1 macrophage, natural killer cell, Th2 and Th17 cells.
Correlation of CXCL13 expression with immune infiltration level in ccRCC. (A) The correlation of CXCL13 with ESTIMATE score, stromal score and immune score. (B) CXCL13 expression is significantly negatively related to tumor purity and has significant positive correlations with infiltrating levels of B cells, CD8+ T cells, CD4+ T cells, macrophages, neutrophils, and dendritic cells.
The association with immune cell markers and CXCL13 expression level
| Description | Gene marker | r | P |
|---|---|---|---|
| CD8+ T cell | CD8A | 0.5756 | **** |
| CD8B | 0.5212 | **** | |
| T cell (general) | CD3D | 0.589 | **** |
| CD3E | 0.6135 | **** | |
| CD2 | 0.6021 | **** | |
| B cell | CD19 | 0.6094 | **** |
| CD79A | 0.4251 | **** | |
| Monocyte | CD86 | 0.3852 | **** |
| CD115 (CSF1R) | 0.3022 | **** | |
| M1 Macrophage | INOS (NOS2) | -0.06597 | ns |
| COX2(PTGS2) | -0.0151 | ns | |
| M2 Macrophage | CD163 | 0.2232 | **** |
| VSIG4 | 0.3423 | **** | |
| MS4A4A | 0.3002 | **** | |
| Neutrophils | CD66b (CEACAM8) | 0.008424 | ns |
| CD11b (ITGAM) | 0.04541 | ns | |
| Natural killer cell | KIR2DL1 | -0.03222 | ns |
| KIR2DL3 | 0.05152 | ns | |
| KIR2DL4 | 0.3342 | ns | |
| KIR3DL1 | -0.0444 | ns | |
| KIR3DL2 | 0.0731 | ns | |
| KIR3DL3 | 0.05221 | ns | |
| Dendritic cell | HLA-DPB1 | 0.2912 | **** |
| HLA-DQB1 | 0.2099 | **** | |
| HLA-DRA | 0.2839 | **** | |
| HLA-DPA1 | 0.2647 | **** | |
| Th1 | T-bet (TBX21) | 0.4259 | **** |
| STAT4 | 0.4852 | **** | |
| STAT1 | 0.4578 | **** | |
| IFN-γ (IFNG) | 0.6612 | **** | |
| Th2 | GATA3 | 0.0744 | ns |
| STAT6 | -0.05662 | ns | |
| IL13 | 0.1663 | *** | |
| Tfh | BCL6 | 0.05778 | ns |
| IL21 | 0.4444 | **** | |
| Th17 | STAT3 | 0.02595 | ns |
| IL17A | 0.01578 | ns | |
| Treg | FOXP3 | 0.5057 | **** |
| CCR8 | 0.383 | **** | |
| TGFβ (TGFB1) | 0.2035 | **** | |
| T cell exhaustion | PD-1 (PDCD1) | 0.6266 | **** |
| CTLA4 | 0.6144 | **** | |
| LAG3 | 0.6436 | **** | |
| GZMB | 0.5386 | **** |
Identification of CXCL13 associated biological pathways
To further evaluate CXCL13 expression in various cancers, the differential CXCL13 expression between the tumor and normal tissues across all TCGA cohorts was shown in Figure 7A. Furthermore, CXCL13 expression was significantly higher in ccRCC (Figure 7B). Furthermore, CXCL13 was positively associated with tumor stage and tumor grade (Figure 7C-D). Additionally, CXCL13 mRNA levels in ccRCCs were analyzed using the Oncomine database. The results showed CXCL13 expression was higher in tumor tissues, compared to the normal tissues (Figure 7E-G).
CXCL13 expression levels in ccRCC (A) Human CXCL13 expression levels in different types of tumor from TCGA database were determined by TIMER analysis. (B) CXCL13 expression level between non-tumor tissues and tumor tissues from ccRCC. (C) CXCL13 expression level among different tumor stages. (D) CXCL13 expression level among different tumor grades. (E-G) CXCL13 mRNA expression level in Oncomine database. (H-I) GSEA plot showed CXCL13 expression associated with immune response and cell adhesion processes *p < 0.05; **p < 0.01, ***p<0.001.
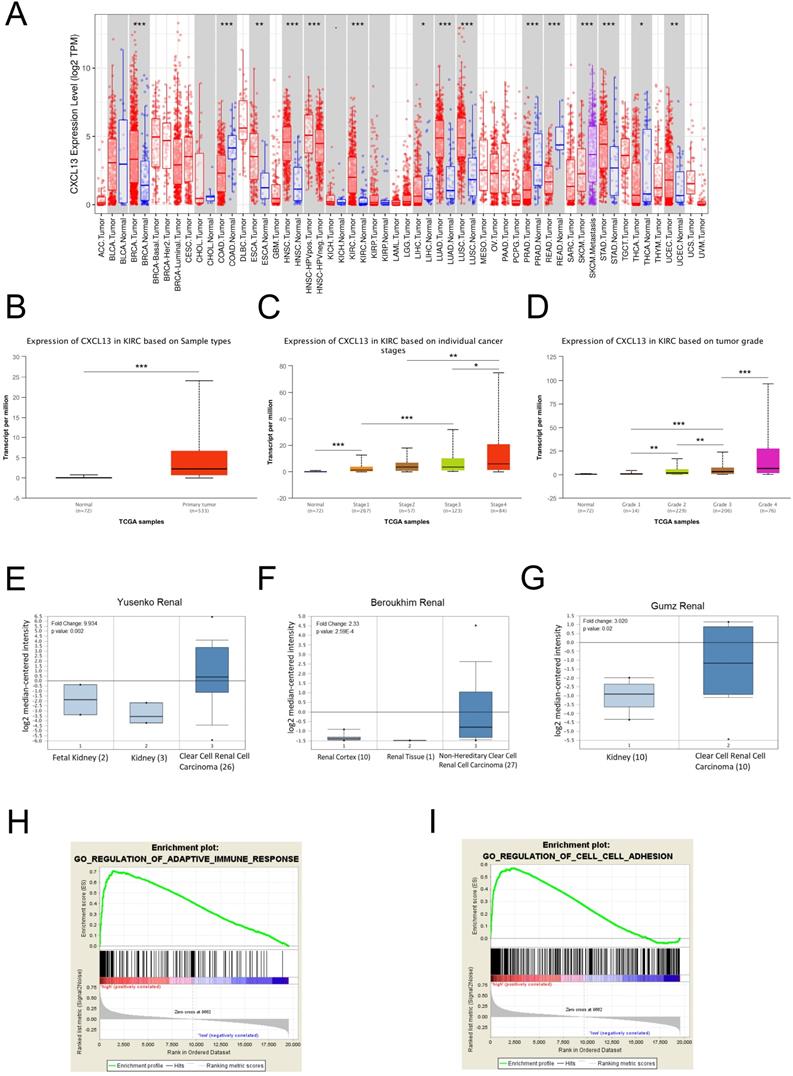
According to the different CXCL13 expression levels, GSEA analysis, a robust computational method that determines whether the defined set of genes shows statistically significant differences, was used to determine biologic characteristics. Immune response and cell adhesion were enriched significantly, indicating that CXCL13 might play a vital role in these biological processes in ccRCC (Figure 7H-I).
CXCL13 promotes migration ability in renal cell lines
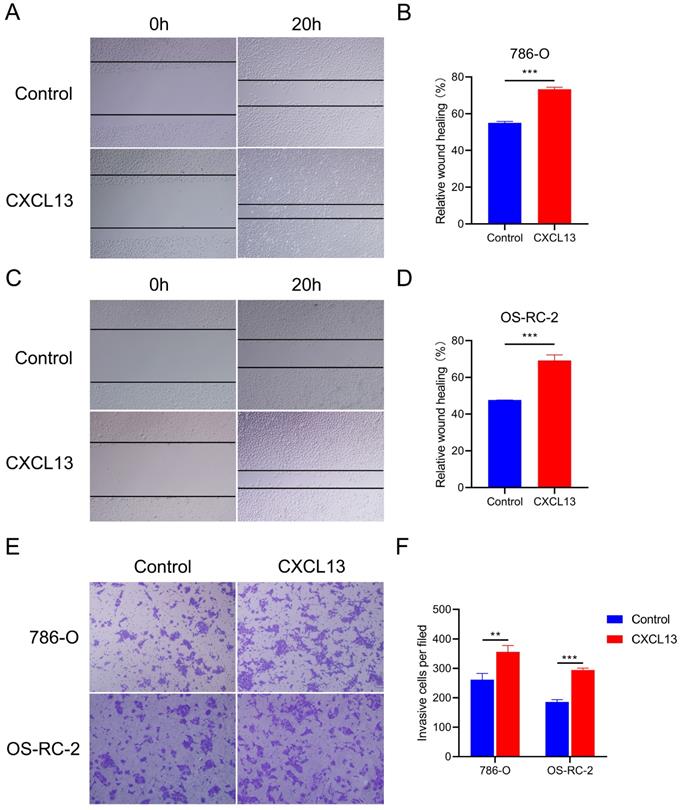
To identify the effects of CXCL13 on the motility of RCC, wound healing assays were performed in 786-O and OS-RC-2 cells. The results showed that treatment with CXCL13 (50 ng/ml) significant increased the speed of wound closure in both cell lines (Figure 8A-D). Transwell assay showed a great increased migrating cells in CXCL13 treated cells (50 ng/ml), compared to control cells (Figure 8E-F). Taken together, these results indicated that CXCL13 significantly promoted the migration ability of RCC.
CXCL13 promote the migration ability of RCC. (A-D) The wound healing assays were used to examine the relative migration ability of CXCL13. Wound closure was observed after 20h. The normalized wound area of control cells at 0 h was set as 1. (E-F) Migration of 786-O and OS-RC-2 cells were measured by the transwell migration assay. Transwell assay was observed after 24h **p < 0.01, ***p<0.001.
Discussion
TCGA is an open access database which uses a genome-wide approach to reveal the genetic characteristics of cancers. Many studies of cancers such as RCC have screened diagnostic and prognostic biomarkers using TCGA [31, 32]. Previous studies have shown that intrinsic tumor genes can cause changes in the tumor microenvironment [33, 34], which affect the occurrence and development of tumors, tumor progression, drug resistance, and overall prognosis [35-37]. The RCC tumor microenvironment is unlike that of other tumor types [38]; in most cancers, increased CD8+ T cell density is associated with improved prognosis [6], yet in RCC increased CD8+ T cell density is often associated with a worse outcome [39]. A previous study which performed clustering analyses on the infiltrating immune cells in RCC, revealed a total of 17 macrophage and 22 T cell subsets [40]. Therefore, the tumor immune microenvironment appears to play an important role in the occurrence and development of RCC.
In this study, we calculated immune cell and stromal cell scores using the ESTIMATE algorithm, finding that patients with a high immune cell score were likely to have a poor prognosis. Next, we identified 521 co-DEGs by comparing the gene expression of patients with high immune cell and stromal cell scores against those with low immune cell and stromal cell scores. GO term analysis revealed that the co-DEGs functions mainly involved the tumor microenvironment, such as T cell activation, immune response-regulating cell surface receptor signaling pathway, positive regulation of cytokine production, and cytokine activity. KEGG pathway enrichment analysis showed that the DEGs were enriched in cytokine-cytokine receptor interactions and the chemokine signaling pathway. Functional enrichment analysis confirmed that these DEGs were closely related to the RCC microenvironment. Next, we performed PPI network analysis and found 10 microenvironment-associated hub genes, including GPR55, CCR4, C3, CCL21, CCR7, CCL19, and CXCL13, which have been reported to promote proliferation, angiogenesis, migration, and invasiveness by altering the tumor microenvironment [41-44], and identified CCR4, GNG8 and CXCL13 were associated with prognosis of ccRCC patients. Furthermore, we evaluated the correlation between TIICs and CXCL13 and CXCL13 mRNA expression in ccRCC. GESA analysis enriched immune response and cell adhesion pathway, indicating that CXCL13 had potential role in tumor migration.
Chemokines are a family of chemotactic cytokines or ligands, which were related to direct migration of immune cells and tumor cells [45, 46]. CXCL13, and its receptor, CXCR5 (CXCL13/CXCR5 axis), serve as an important pathway of tumor proliferation and metastasis [47-49]. Previous studies demonstrated that CXCL13 upregulation was regarded as a biomarker for poor prognosis in various cancers, including ccRCC [50-52]. Since high immune cell and stromal cell scores are associated with poor prognosis of ccRCC patients, we identified tumor microenvironment-associated genes that correlated with the prognosis of patients with ccRCC. We identified CXCL13 was associated with TIICs and enhanced the effect of migration.
Cancer cells are usually recognized by immune system, including innate and adaptive immunity. And the immune surveillance is driven by a network of mediators, such as cytokines and chemokines, et al [53]. On one hand, chemokines regulate tumor microenvironment and initiation of antitumor immune response. On the other hand, chemokines could recruit immune-suppressive regulators and immunoinhibitory mediators to make immune escape. This means CXCL13 could act as a tumor-specific biomarker.
Previous studies had demonstrated that CXCL13 was associated with epithelial-to-mesenchymal transition (EMT) and could activate CXCR5/ERK pathway in breast cancer [48, 49]. EMT is an important way highly associated with cell adhesion. Dysregulation of cell adhesion was associated with cancer progression and metastasis through promoting the motility of tumor cells and migration into adjacent tissues or invade vascular to distinct organs. Consistent with our results, CXCL13 expression level was positively correlated with immune response and cell adhesion by GSEA analysis. Wound healing and transwell assays showed CXCL13 promoted the migration ability in RCC.
However, there were several limitations in this study. First, the results analysis from TCGA have not detected in GEO database. Second, the detailed functions and potential mechanisms of CXCL13 in ccRCC are needed to be validated in vitro and in vivo experiment, which would be conducted in our further studies.
Conclusions
In summary, we produced a list of tumor microenvironment-related genes and identified CXCL13 expression level correlated with poor prognosis and increased TIICs of ccRCC. Therefore, CXCL13 likely plays an important role in immune cell infiltration, acts as a prognosis biomarker in patients with ccRCC and has potential role in tumor migration. However, our findings need to be validated in future studies.
Abbreviations
RCC: renal cell carcinoma; ccRCC: clear cell renal cell carcinoma; TIICs: tumor-infiltrating immune cells; ECM: extracellular matrix; TCGA: The Cancer Genome Atlas; PD-1: programmed death-1; PD-L1: programmed death-ligand 1; ESTIMATE: Estimation of Stromal and Immune cells in Malignant Tumor tissues using Expression data; DEGs: differentially expressed genes; FDR: false discovery rate; GO: gene ontology; KEGG: Kyoto Encyclopedia of Genes and Genomes; PPI: protein-protein interaction; GSEA: Gene set enrichment analysis; MSigDB: The Molecular Signatures Database; EMT: epithelial-to-mesenchymal transition.
Acknowledgements
This work was supported by Primary Research & Development Plan of Shandong Province (Grant 2019GSF108246 to F Jiao).
Competing Interests
The authors have declared that no competing interest exists.
References
1. Ljungberg B, Bensalah K, Canfield S. et al. EAU guidelines on renal cell carcinoma: 2014 update. Eur Urol. 2015;67:913-24
2. Lopez-Beltran A, Carrasco JC, Cheng L, Scarpelli M, Kirkali Z, Montironi R. 2009 update on the classification of renal epithelial tumors in adults. Int J Urol. 2009;16:432-43
3. Motzer RJ, Escudier B, McDermott DF. et al. Nivolumab versus Everolimus in Advanced Renal-Cell Carcinoma. N Engl J Med. 2015;373:1803-13
4. Alva A, Daniels GA, Wong MK. et al. Contemporary experience with high-dose interleukin-2 therapy and impact on survival in patients with metastatic melanoma and metastatic renal cell carcinoma. Cancer Immunol Immunother. 2016;65:1533-1544
5. Daurkin I, Eruslanov E, Stoffs T. et al. Tumor-associated macrophages mediate immunosuppression in the renal cancer microenvironment by activating the 15-lipoxygenase-2 pathway. Cancer Res. 2011;71:6400-9
6. Fridman WH, Pages F, Sautes-Fridman C, Galon J. The immune contexture in human tumours: impact on clinical outcome. Nat Rev Cancer. 2012;12:298-306
7. Nakano O, Sato M, Naito Y. et al. Proliferative activity of intratumoral CD8(+) T-lymphocytes as a prognostic factor in human renal cell carcinoma: clinicopathologic demonstration of antitumor immunity. Cancer Res. 2001;61:5132-6
8. Bromwich EJ, McArdle PA, Canna K. et al. The relationship between T-lymphocyte infiltration, stage, tumour grade and survival in patients undergoing curative surgery for renal cell cancer. Br J Cancer. 2003;89:1906-8
9. Hanahan D, Coussens LM. Accessories to the crime: functions of cells recruited to the tumor microenvironment. Cancer cell. 2012;21:309-22
10. Curry JM, Sprandio J, Cognetti D. et al. Tumor microenvironment in head and neck squamous cell carcinoma. Semin Oncol. 2014;41:217-34
11. Galon J, Pages F, Marincola FM. et al. The immune score as a new possible approach for the classification of cancer. J Transl Med. 2012;10:1
12. Yoshihara K, Shahmoradgoli M, Martinez E. et al. Inferring tumour purity and stromal and immune cell admixture from expression data. Nat Commun. 2013;4:2612
13. Jia D, Li S, Li D, Xue H, Yang D, Liu Y. Mining TCGA database for genes of prognostic value in glioblastoma microenvironment. Aging. 2018;10:592-605
14. Alonso MH, Ausso S, Lopez-Doriga A. et al. Comprehensive analysis of copy number aberrations in microsatellite stable colon cancer in view of stromal component. Br J Cancer. 2017;117:421-31
15. Priedigkeit N, Watters RJ, Lucas PC. et al. Exome-capture RNA sequencing of decade-old breast cancers and matched decalcified bone metastases. JCI insight. 2017;2:95703
16. Shah N, Wang P, Wongvipat J. et al. Regulation of the glucocorticoid receptor via a BET-dependent enhancer drives antiandrogen resistance in prostate cancer. ELife. 2017;6:27861
17. Delahunt B, Srigley JR, Montironi R, Egevad L. Advances in renal neoplasia: recommendations from the 2012 International Society of Urological Pathology Consensus Conference. Urology. 2014;83:969-74
18. Tomczak K, Czerwińska P, Wiznerowicz M. The Cancer Genome Atlas (TCGA): an immeasurable source of knowledge. Contemp Oncol (Pozn). 2015;19:68-77
19. Weinstein JN, Collisson EA, Mills GB. et al. The Cancer Genome Atlas Pan-Cancer analysis project. Nat Genet. 2013;45:1113-20
20. Ritchie ME, Phipson B, Wu D. et al. limma powers differential expression analyses for RNA-sequencing and microarray studies. Nucleic Acids Res. 2015;43:47
21. Huang da W, Sherman BT, Lempicki RA. Systematic and integrative analysis of large gene lists using DAVID bioinformatics resources. Nat Protoc. 2009;4:44-57
22. Szklarczyk D, Franceschini A, Wyder S. et al. STRING v10: protein-protein interaction networks, integrated over the tree of life. Nucleic Acids Res. 2015;43:447-52
23. Shannon P, Markiel A, Ozier O. et al. Cytoscape: a software environment for integrated models of biomolecular interaction networks. Genome Res. 2003;13:2498-504
24. Chin CH, Chen SH, Wu HH, Ho CW, Ko MT, Lin CY. cytoHubba: identifying hub objects and sub-networks from complex interactome. BMC Syst Biol. 2014;8(Suppl 4):S11
25. Newman AM, Liu CL, Green MR. et al. Robust enumeration of cell subsets from tissue expression profiles. Nat Methods. 2015;12:453-7
26. Li T, Fan J, Wang B. et al. TIMER: A Web Server for Comprehensive Analysis of Tumor-Infiltrating Immune Cells. Cancer Res. 2017;77:108-110
27. Li B, Severson E, Pignon JC. et al. Comprehensive analyses of tumor immunity: implications for cancer immunotherapy. Genome Biol. 2016;17:174
28. Rhodes DR, Kalyana-Sundaram S, Mahavisno V. et al. Oncomine 3.0: genes, pathways, and networks in a collection of 18,000 cancer gene expression profiles. Neoplasia. 2007;9:166-80
29. Kim M, Kim JH, Jang HR. et al. LRRC3B, encoding a leucine-rich repeat-containing protein, is a putative tumor suppressor gene in gastric cancer. Cancer Res. 2008;68:7147-55
30. Vecchi M, Nuciforo P, Romagnoli S. et al. Gene expression analysis of early and advanced gastric cancers. Oncogene. 2007;26:4284-94
31. Wu J, Jin S, Gu W. et al. Construction and Validation of a 9-Gene Signature for Predicting Prognosis in Stage III Clear Cell Renal Cell Carcinoma. Front Oncol. 2019;9:152
32. Luo Y, Chen L, Wang G, Xiao Y, Ju L, Wang X. Identification of a three-miRNA signature as a novel potential prognostic biomarker in patients with clear cell renal cell carcinoma. J Cell Biochem. 2019;120:13751-64
33. Zhou Z, Lu ZR. Molecular imaging of the tumor microenvironment. Adv Drug Deliv Rev. 2017;113:24-48
34. Chanmee T, Ontong P, Itano N. Hyaluronan: A modulator of the tumor microenvironment. Cancer Lett. 2016;375:20-30
35. Tang YA, Chen YF, Bao Y. et al. Hypoxic tumor microenvironment activates GLI2 via HIF-1α and TGF-β2 to promote chemoresistance in colorectal cancer. Proc Natl Acad Sci U S A. 2018;115:5990-5999
36. Bobko AA, Eubank TD, Driesschaert B. et al. Interstitial Inorganic Phosphate as a Tumor Microenvironment Marker for Tumor Progression. Sci Rep. 2017;7:41233
37. Caetano MS, Zhang H, Cumpian AM. et al. IL6 Blockade Reprograms the Lung Tumor Microenvironment to Limit the Development and Progression of K-ras-Mutant Lung Cancer. Cancer Res. 2016;76:3189-99
38. Drake CG, Stein MN. The Immunobiology of Kidney Cancer. J Clin Oncol. 2018: Jco2018792648.
39. Giraldo NA, Becht E, Pagès F. et al. Orchestration and Prognostic Significance of Immune Checkpoints in the Microenvironment of Primary and Metastatic Renal Cell Cancer. Clin Cancer Res. 2015;21:3031-40
40. Chevrier S, Levine JH, Zanotelli VRT. et al. An Immune Atlas of Clear Cell Renal Cell Carcinoma. Cell. 2017;169:736-749.e18
41. Ford LA, Roelofs AJ, Anavi-Goffer S. et al. A role for L-alpha-lysophosphatidylinositol and GPR55 in the modulation of migration, orientation and polarization of human breast cancer cells. B Br J Pharmacol. 2010;160:762-71
42. Zha H, Wang X, Zhu Y. et al. Intracellular Activation of Complement C3 Leads to PD-L1 Antibody Treatment Resistance by Modulating Tumor-Associated Macrophages. Cancer Immunol Res. 2019;7:193-207
43. Maolake A, Izumi K, Natsagdorj A. et al. Tumor necrosis factor-α induces prostate cancer cell migration in lymphatic metastasis through CCR7 upregulation. Cancer Sci. 2018;109:1524-1531
44. Workel HH, Lubbers JM, Arnold R. et al. A Transcriptionally Distinct CXCL13(+)CD103(+)CD8(+) T-cell Population Is Associated with B-cell Recruitment and Neoantigen Load in Human Cancer. Cancer Immunol Res. 2019;7:784-796
45. Yu F, Xie Y, Wang Y, Peng ZH, Li J, Oupický D. Chloroquine-Containing HPMA Copolymers as Polymeric Inhibitors of Cancer Cell Migration Mediated by the CXCR4/SDF-1 Chemokine Axis. ACS Macro Lett. 2016;5:342-345
46. Jung Y, Ahn SH, Park H. et al. MCP-1 and MIP-3α Secreted from Necrotic Cell-Treated Glioblastoma Cells Promote Migration/Infiltration of Microglia. Cell Physiol Biochem. 2018;48:1332-1346
47. Airoldi I, Cocco C, Morandi F, Prigione I, Pistoia V. CXCR5 may be involved in the attraction of human metastatic neuroblastoma cells to the bone marrow. Cancer Immunol Immunother. 2008;57:541-8
48. Biswas S, Sengupta S, Roy Chowdhury S. et al. CXCL13-CXCR5 co-expression regulates epithelial to mesenchymal transition of breast cancer cells during lymph node metastasis. Breast Cancer Res Treat. 2014;143:265-76
49. Ma JJ, Jiang L, Tong DY, Ren YN, Sheng MF, Liu HC. CXCL13 inhibition induce the apoptosis of MDA-MB-231 breast cancer cells through blocking CXCR5/ERK signaling pathway. Eur Rev Med Pharmacol Sci. 2018;22:8755-8762
50. Zhu Z, Zhang X, Guo H, Fu L, Pan G, Sun Y. CXCL13-CXCR5 axis promotes the growth and invasion of colon cancer cells via PI3K/AKT pathway. Mol Cell Biochem. 2015;400:287-95
51. Singh R, Gupta P, Kloecker GH, Singh S, Lillard JW Jr. Expression and clinical significance of CXCR5/CXCL13 in human non-small cell lung carcinoma. Int J Oncol. 2014;45:2232-40
52. Xu T, Ruan H, Song Z. et al. Identification of CXCL13 as a potential biomarker in clear cell renal cell carcinoma via comprehensive bioinformatics analysis. Biomed Pharmacother. 2019;118:109264
53. Whiteside TL. Immune responses to malignancies. T J Allergy Clin Immunol. 2010;125(Suppl 2):S272-83
Author contact
![]() Corresponding author: Jun Chen, Address: Department of Urology, Qilu Hospital (Qingdao), Cheeloo College of Medicine, Shandong University, 758 Hefei Road, Qingdao, Shandong, 266035, China. Phone: +86 18561810509; Fax: +86 532-66850532; E-mail: chenjunxinxiangedu.com.
Corresponding author: Jun Chen, Address: Department of Urology, Qilu Hospital (Qingdao), Cheeloo College of Medicine, Shandong University, 758 Hefei Road, Qingdao, Shandong, 266035, China. Phone: +86 18561810509; Fax: +86 532-66850532; E-mail: chenjunxinxiangedu.com.