Impact Factor ISSN: 1449-1907

 Global reach, higher impact
Int J Med Sci 2014; 11(8):834-840. doi:10.7150/ijms.6961 This issue Cite
Research Paper
Determinants of Right Ventricular Muscle Mass in Idiopathic Dilated Cardiomyopathy: Impact of Left Ventricular Muscle Mass and Pulmonary Hypertension
Julia Vormbrock1, Jeanette Liebeton1, Sophia Wirdeier1, Axel Meissner1, Thomas Butz1, Hans-Joachim Trappe1, Gunnar Plehn2 ![]()
1. Department of Cardiology and Angiology, University of Bochum, Germany;
2. Department of Cardiology, Johanniter-Krankenhaus, Duisburg, Germany.
Received 2013-6-20; Accepted 2014-5-26; Published 2014-6-7
Abstract
Introduction: Although chronic pulmonary hypertension and right ventricular (RV) function carry important functional and prognostic implications in idiopathic dilated cardiomyopathy (IDC), little information on RV muscle mass (RVMM) and its determinants has been published.
Methods: Our study comprised thirty-five consecutive patients with IDC, left ventricular (LV) ejection fraction <40% and NYHA class ≥2. Hemodynamic data and parameters on LV and RV geometry were derived from right heart catheterisation and cardiac magnetic resonance imaging.
Results: RVMM was normalized to body size using a common linear, body surface area based approach (RVMMI) and by an allometric index (RVMM-AI) incorporating adjustment for age, height and weight. Stepwise multiple regression analysis revealed that pulmonary artery pressure and left ventricular muscle mass were independent predictors of RVMM-AI. The interventricular mass ratio of RV and LV mass (IVRM) was closely related to RVMM (r = 0.79, p < 0.001) and total muscle mass (r = 0.39, p < 0.02). However, there was no significant relationship between LVMM and IVMR (r = 0.17, p = 0.32).
Conclusion: Our data suggest that an increase in RV mass in IDC may be explained by two mechanisms: First, as a consequence of the myopathic process itself resulting in a balanced hypertrophy of both ventricles. Second, due to the chamber specific burden of pulmonary artery pressure rise, resulting in unbalanced RV hypertrophy.
Keywords: Right ventricular muscle mass, heart failure, myocardial hypertrophy.
Introduction
In patients with idiopathic pulmonary hypertension (IPH) important insights into the interaction between pulmonary circulation and the right ventricle (RV) have been gained in recent years. RV hypertrophy leading to an increase in right ventricular muscle mass (RVMM) is viewed as an initial adaptive process to afterload increase in these cases. It was suggested that identification of hypertrophy measured by RVMM may provide important information, that identifies the effect of elevated pulmonary artery pressure on RV function earlier than RV ejection fraction (RVEF)1. When RVMM was normalized to left ventricular musle mass (LVMM) the resulting ventricular mass index was shown to provide a more accurate noninvasive estimate of pulmonary artery pressure than Doppler echocardiography2.
Although chronic pulmonary hypertension in heart failure carries important functional and prognostic implications, the mechanisms of RV hypertrophy in IDC have been hardly investigated. It is not clear, if RV pressure overload has a significant impact on RV mass in the setting of IDC and if this impact results in a an unbalanced RV to LV mass ratio. Conversely, heterogeneity in the LV hypertrophic response may itself affect the ventricular mass relation. To answer these questions our study combined MRI and hemodynamic data to provide an comprehensive analysis of determinants of RV mass in IDC.
Patients and Methods
Thirty- five consecutive IDC patients with reduced left ventricular ejection fraction (LVEF < 40%) and NYHA functional class ≥ 2 were included. All patients were referred to diagnostic cardiac left and right catheterisation to evaluate suspected heart disease. All patients underwent cardiac magnetic resonance imaging (MRI) examination. The diagnosis of IDC has been established on the basis of the exclusion of other causes of left ventricular (LV) dysfunction. Significant stenoses of the epicardial arteries (> 50% of the luminal diameter) were excluded by coronary angiography. Patients with valvular heart disease or primary pulmonary hypertension were excluded from this study. Active myocarditis and myocardial infiltrative and storage diseases were excluded according to MRI criteria. All patients had sinus rhythm and had no evidence of fluid retention at the time of the study. Heart failure medication was maxed out in all patients and described according to the current guidelines. Medication was not changed for 4 weeks before the study. MRI data and derived parameters were compared to those of a control group, which received examination for evaluation of chest discomfort. Patients of the control group had a normal general examination, a normal rest and exercise electrocardiogram, a normal echocardiography and normal cardiovascular MRI.
Cardiac magnetic resonance imaging, right heart catheterization and derived parameters
All cardiac MRI scans for the assessment of LVMM and RVMM, ejection fraction and volumes were performed on a 1.5- Tesla system (Sonata Magnetom, Siemens Medical Solutions, Erlangen, Germany). Images were gated with a precordial ECG and acquired during end-expiratory breathhold. Cardiac cine images were obtained by true fast imaging with steady state precession (TrueFisp, Siemens Medical Solutions) with a repetition time of 3.98 ms, an echo time of 1.2 ms and a flip angle of 80°. The angulation of the LV long axis view was defined in a transverse and a parasagittal scout image using T1- weighted spin echo sequences. The LV short axis view was defined as imaging planes perpendicular to the left ventricular long axis view. Contiguous short axis images were acquired with a slice thickness of 7 mm and an interslice gap of 3 mm from apex to the cardiac base. Image analysis was performed using a analytical software package (CMR Tools; Cardiovascular Imaging Solutions, London, UK). End-diastole and end-systole were defined by the phase images with the largest and smallest cavity volumes. The endocardial border of the right and left ventricle was manually contoured at end-diastole and end-systole in each slice of the contiguous short axis images. The epicardial border was outlined at end-diastole in each of these images. Blood volumes above the cardiac valves were excluded from left and right ventricular volume measurement. The ventricular septum was defined as part of the LV. Papillary muscles were included in the mass and excluded from the volume. RVMM and LVMM were calculated as the epicardial volume minus the endocardial volume multiplied by the specific gravity of myocardium (1.05 g/cm). Right and left ventricular volumes were calculated by summation of ventricular cavity areas at end-systole and end-diastole multiplied by slice thickness.
Besides quantification of absolute right and left ventricular muscle mass a linear and non-linear normalization strategy was used to eliminate the association of ventricular mass with body size:
- Right ventricular muscle mass normalized to body surface area (RVMMI): Linear normalization for body surface area (BSA) has traditionally been used to normalize cardiac dimensions to body size. This method assumes that there is a linear, proportional relationship between the physiologic dependent variable and body size.
- Right ventricular muscle mass index based on allometric modeling (RVMM-AI): Since the relationship between cardiac dimensions and body size follows a curvilinear relationship, application of linear scaling methods may not be appropriate and under- or overcorrection may occur. We therefore used an allometric normalization model as proposed by Kawut et al.3. Based on a large MRI study population it takes into account the effects of age, gender, height and body weight on right ventricular mass. When applied no residual correlations with height or body weight were observed. RVMM-AI represents the ratio between absolute RVMM and a predicted RVMM based on the allometric normalization model: RVMM-AI = RV mass (g)/(10.59 x age-0.320xHt1.135xWt0.315); [female]. RVMM-AI = RV mass (g)/(11.25 x age-0.320xHt1.135xWt0.315); [male].
Left ventricular muscle mass was normalized to BSA (LVMMI) and according to an allometric model (LVMM/BSA-1.4) from the Asklepios study4. Ventricular volume data were solely normalized to BSA. Right ventricular muscle mass was further evaluated in terms of the degree of right ventricular dilatation (relative right ventricular muscle mass = RVMM/RVEDV) and the degree of left ventricular mass increase (interventricular mass ratio = IVMR = RVMM/LVMM).
Right and left ventricular function was further characterized by hemodynamic evaluation using a standard thermodilution catheter. The following parameters were measured: pulmonary artery systolic pressure (PASP), pulmonary artery mean pressure (PAMP), pulmonary capillary wedge pressure (PCWP), heart rate (HR), systemic artery systolic pressure (RRsys), cardiac output (CO) and cardiac index (CI).
To characterize hemodynamic, geometric and clinical features associated with an increased right ventricular muscle mass patients were divided into three subgroups according to the tertiles of RVMM-AI. To evaluate the strength of relation between variables associated with RVMMI and RVMM-AI a correlation analysis within the whole group of IDC patients was performed. To identify potentially independent determinants of right ventricular muscle mass in IDC patients a forward stepwise multivariate regression analysis was performed.
Statistical Analysis
All statistical analysis was performed using SPSS statistical software (version 15.0; SPSS Inc., Chicago, Ill., USA). Data are expressed as means ± SD. Patients were grouped into tertiles based on the distribution of RVMM-AI (subgroup A ≤ 1.17, subgroup B > 1.17 ≤ 2.51, subgroup C > 2.51). ANOVA or a χ2- test was used for comparisons between tertiles. Differences between each pair of groups were assessed by the Tukey test.
For correlation analysis the paired t test and Pearson linear correlation coefficient were used.
To select variables independently related to RVMM a multivariate regression analysis was performed. Two models incorporating RVMM-AI or RVMMI as independent variables were evaluated. All parameters that correlated significantly with these indices were submitted to a forward stepwise multivariate regression model except those who a part of the calculation formula of RVMMI or RVMM-AI or those who were related to the right ventricle itself.
Results
Comparison of cardiac geometry in IDC and healthy subjects
Differences between IDC patients and a healthy control group regarding baseline characteristics are summarized in Table 1.
Baseline parameters and RV mass and RV mass indexes in IDC patients and control group
| Parameter | control group | IDC | Significance |
|---|---|---|---|
| patients (n) | 13 | 35 | |
| age (years) | 59.84 ± 14.54 | 60.34 ± 12.66 | 0.91 |
| height (cm) | 168.33 ± 9.55 | 176.46 ± 7.11 | 0.02 |
| weight (kg) | 76.25 ± 14.85 | 90.65 ± 15.35 | 0.007 |
| RVEF (%) | 39.22 ± 6.41 | 27.98 ± 12.17 | 0.003 |
| RVEDV (ml) | 103.46 ± 35.11 | 161.34 ± 49.29 | 0.001 |
| RVESV (ml) | 61.69 ± 18.66 | 115.69 ± 42.99 | < 0.001 |
| RVMM (g) | 39.62 ± 10.11 | 49.11 ± 28.48 | 0.25 |
| RVMMI (g/m2) | 21.03 ± 4.37 | 23.18 ± 11.80 | 0.36 |
| RVMM/RVEDV (g/ml) | 0.40 ± 0.11 | 0.29 ± 0.14 | 0.017 |
| RVMM-AI | 1.81 ± 0.41 | 2.00 ± 1.04 | 0.003 |
| IVMR (RVMM/LVMM) | 0.42 ± 0.07 | 0.26 ± 0.11 | < 0.001 |
| LVMM (g) | 94.38 ± 23.98 | 183.60 ± 63.15 | < 0.001 |
| LVEF (%) | 64.54 ± 5.19 | 19.93 ± 6.51 | < 0.001 |
| LVEDV (ml) | 96.69 ± 25.70 | 292.17 ± 103.93 | < 0.001 |
| LVESV (ml) | 35.15 ± 13.01 | 229.34 ± 96.28 | < 0.001 |
| LVMM/LVEDV (g/ml) | 0.99 ± 0.19 | 0.64 ± 0.17 | < 0.001 |
| LVMMI (g/m2) | 50.08 ± 10.29 | 88.57 ± 27.65 | < 0.001 |
| LVMM/BSA-1.4 | 39.0 ± 7.50 | 66.3 ± 20.5 | 0.002 |
BSA = body surface area; CI = cardiac index; HR = heart rate; IVMR = interventricular mass ratio; LVEDV = left ventricular end-diastolic volume; LVEF = left ventricular ejection fraction; LVESV = left ventricular end-systolic volume; LVMM/BSA-1.4 = left ventricular muscle mass based on allometric normalization; LVMM = left ventricular muscle mass; LVMMI = left ventricular muscle mass normalized to body surface area; PAMP = pulmonary artery mean pressure; PCWP = pulmonary capillary wedge pressure; RRdia = arterial diastolic pressure; RRsys = arterial systolic pressure; RVEDV = right ventricular end-diastolic volume; RVEF =right ventricular ejection fraction; RVESV = right ventricular end-systolic volume; RVMM-AI = right ventricular muscle mass corrected by age, mass and height; RVMM = right ventricular muscle mass; RVMMI = right ventricular muscle mass normalized to body surface area
IDC patients are generally characterized by an increased left ventricular muscle mass as demonstrated by an increase in absolute LVMM (183.60 ± 63.15 g vs. 94.38 ± 23.98 g, p < 0.001) as well as an increase in its normalized values LVMMI and LVMM/BSA-1.4 (88.57 ± 27.65 g/m2 vs. 50.08 ± 10.29, p < 0.001 respectively 66.3 ± 20.5 vs. 39.0 ± 7.50, p = 0.002). However, when normalized to end-diastolic volume (LVEDV) the resulting LVMM/LVEDV ratio was decreased in IDC (0.64 ± 0.17 g/ml vs. 0.99 ± 0.19 g/ml, p < 0.001).
There were no significant differences in RVMM and RVMMI between both groups (Table 1). However, RVMM-AI was significantly increased in IDC-patients. Relative RV mass was significantly lower in heart failure patients (0.29 ± 0.14 g/ml vs. 0.44 ± 0.11 g/ml, p = 0.017), indicating an unbalanced enlargement of RV cavity in IDC patients. IVMR was smaller than predicted from control patients (0.26 ± 0.11 vs. 0.42 ± 0.07, p < 0.001) and ranged from 0.06 to 0.49 in these patients (Table 1).
Intra-group comparison of IDC patients according to RVMM-AI
Patients with IDC were arbitrarily divided into tertiles according to RVMM-AI distribution. Right ventricular mass increase was accompanied by a significant increase in left ventricular mass as demonstrated by significant differences in LVMMI and LVMM/BSA-1.4 between the three subgroups. Hemodynamic data, ventricular ejection fraction and ventricular cavity dimensions did not differ significantly between the groups. Furthermore, there was no significant difference in NYHA class and anthropometric measurements, except body weight (Table 2).
Anthropometric, hemodynamic and MRI data in patient subgroups based on the distribution of RVMM-AI
| subgroup A (≤ 1.17 ) | subgroup B (> 1.17; ≤ 2.51) | subgroup C (> 2.51) | p | |
|---|---|---|---|---|
| patients (n) | 11 | 12 | 12 | |
| age (years ± SD) | 56.5 ± 11 | 62.3 ± 16.3 | 61.8 ± 9.7 | 0.50 |
| height (cm ± SD) | 174.3 ± 6.4 | 176.3 ± 8.0 | 178.6 ± 6.7 | 0.36 |
| weight (kg ± SD) | 80.1 ± 11.9 | 91.2 ± 12.1 | 98.4 ± 16.6 | 0.01 |
| NYHA-class | 2.5 ± 0.5 | 2.5 ± 0.5 | 3.0 ± 0.8 | 0.13 |
| PAMP (mmHg ± SD) | 16.7 ± 9.5 | 16.9 ± 9.8 | 25.4 ± 12.4 | 0.11 |
| PCWP (mmHg ± SD) | 9.7 ± 9.2 | 10.5 ± 9.3 | 13.5 ± 9.3 | 0.61 |
| RRsys (mmHg ± SD) | 113.2 ± 10.8 | 115.8 ± 11.1 | 111.3 ± 15.0 | 0.87 |
| RRdia (mmHg ± SD) | 79.7 ± 3.9 | 82.2 ± 19.6 | 63.7 ± 28.3 | 0.32 |
| HR (min-1 ± SD) | 73.8 ± 15.6 | 69.0 ± 11.4 | 78.0 ± 19.5 | 0.54 |
| CI (l/min/m2 ± SD) | 2.9 ± 0.9 | 2.3 ± 0.9 | 2.8 ± 0.9 | 0.52 |
| LVEF (% ± SD) | 20.7 ± 5.0 | 24.8 ± 8.3 | 21.7 ± 9.5 | 0.68 |
| LVEDVI (ml ± SD) | 129.9 ± 34.0 | 129.4 ± 38.6 | 160.8 ± 65.2 | 0.22 |
| LVESVI (ml ± SD) | 104.1 ± 28.4 | 97.3 ± 32.1 | 129.8 ± 66.4 | 0.22 |
| LVMMI | 71.5 ± 21.8 | 85.2 ± 21.5 | 107.5 ± 27.8 | 0.004 |
| LVMM/BSA-1.4 | 55.3 ± 17.6 | 63.5 ± 15.7 | 79.3 ± 21.3 | 0.01 |
| RVEF (% ± SD) | 24.7 ± 10.2 | 34.3 ± 13.6 | 24.7 ± 10.5 | 0.08 |
| RVEDVI (ml ± SD) | 63.8 ± 16.9 | 77.8 ± 14.2 | 88.5 ± 22.3 | 0.10 |
| RVESVI (ml ± SD) | 48.9 ± 16.6 | 51.8 ± 15.4 | 64.9 ± 21.9 | 0.07 |
Abbreviations see Table 1.
Univariate and multivariate correlates of RVMM-AI and RVMMI
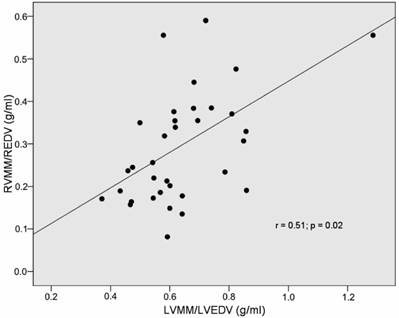
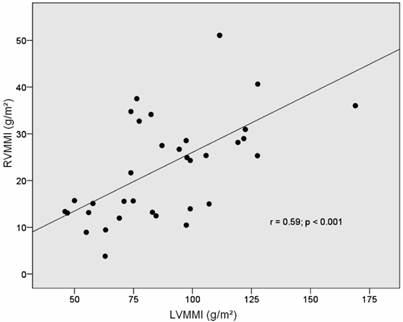
An increase in right ventricular muscle mass is linked to right ventricular cavity dilatation as demonstrated by a significant positive correlation of RVMM-AI and RVMMI with right ventricular end-diastolic volumes. Among parameters that were not related to the right ventricle itself, left ventricular muscle mass showed a strong correlation with right ventricular muscle mass (Figs 1-2). Among the hemodynamic and functional parameters, pulmonary artery mean pressure and NYHA functional class showed a moderate positive correlation with both indices of RV mass (Table 3).
Correlation of RVMM/RVEDV-index and LVMM/LVEDV-index in IDC patients.
Correlation of RVMMI and LVMMI (muscle mass normalized to body surface area).
Correlates of different right ventricular mass (RVMM) indices.
| RVMM-AI | RVMMI (g/m2) | IVMR | ||||
|---|---|---|---|---|---|---|
| r = | p = | r = | p = | r = | p = | |
| LVMM/BSA-1.4 | 0.52 | 0.002 | 0.52 | 0.001 | ns | ns |
| LVMMI | 0.59 | <.001 | 0.6 | <.001 | ns | ns |
| LVEF (%) | ns | ns | ns | ns | ns | ns |
| RVEF (%) | ns | ns | ns | ns | ns | ns |
| RVEDVI | 0.44 | 0.01 | 0.44 | 0.009 | 0.6 | <.001 |
| RVESVI | ns | ns | 0.34 | 0.049 | 0.59 | <.001 |
| PAMP (mmHg) | 0.39 | 0.03 | 0.39 | 0.03 | 0.57 | 0.001 |
| PCWP (mmHg) | ns | ns | ns | ns | 0.36 | 0.04 |
| NYHA class | 0.41 | 0.02 | 0.42 | 0.02 | ns | ns |
| Heart rate (min-1) | ns | ns | 0.46 | 0.04 | ns | ns |
Abbreviations see Table 1.
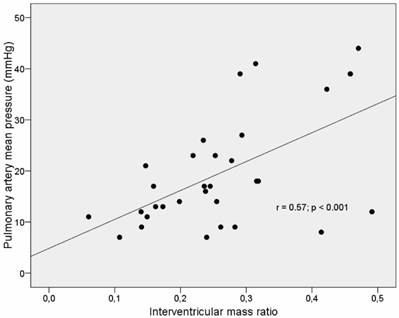
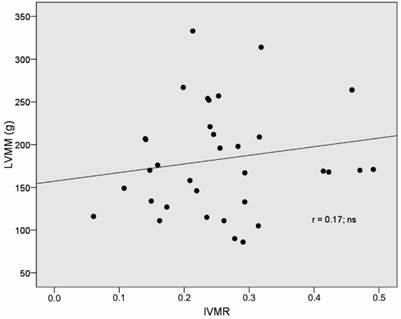
IVMR was significantly related to RVMM-AI (r= 0.77, p <0.001) and RVMMI (r= 0.80, p <0.001) (Table 4). Furthermore, there was a strong correlation between IVMR and pulmonary artery mean pressure (r= 0.57, p < 0.001) (Table 3, Fig 3). However, no correlation between IVMR and indices of left ventricular muscle mass was found (Table 4, Fig 4).
Correlation of muscle mass and muscle mass indices to IVMR (RVMM/LVMM ratio).
| Parameter | Correlation | Significance |
|---|---|---|
| RVMM (g) | 0.79 | < 0.001 |
| LVMM (g) | 0.17 | 0.32 |
| RVMMI (g/m2) | 0.80 | < 0.001 |
| RVMM-AI | 0.77 | < 0.001 |
| LVMMI (g/m2) | 0.06 | 0.75 |
| LVMM/BSA-1.4 | -0.08 | 0.64 |
| Total muscle mass (g) | 0.39 | 0.02 |
Abbreviations see Table 1.
Correlation of pulmonary artery mean pressure and the interventricular mass ration (IVMR) in IDC-patients.
Correlation of LVMM and RVMM/ LVMM-ratio in IDC patients.
In a multivariate regression model left ventricular muscle mass and pulmonary artery mean pressure were identified as independent predictors of RVMM-AI. Pulmonary artery mean pressure was identified as the sole independent predictor of RVMMI (Table 5).
Results of stepwise multivariate regression analysis.
| Multivariate predictors of RVMM-AI | |||
| Coefficient | Std. Error | p Value | |
| (Constant) | -1.4 | 0.63 | 0.03 |
| LVMM/BSA-1.4 | 0.037 | 0.008 | <.001 |
| PAMP (mmHg) | 0.05 | 0.013 | <.001 |
| Multivariate predictors of RVMMI | |||
| Coefficient | Std. Error | p Value | |
| (Constant) | 10.67 | 4.4 | 0.024 |
| PAMP (mmHg) | 0.90 | 0.24 | 0.001 |
Abbreviations see Table 1.
Discussion
Right and left ventricular remodelling
In idiopathic dilated cardiomyopathy left ventricular geometry is characterised by an eccentric hypertrophy5,6, notably in patients with advanced stages of IDC7. Our study confirmed this pattern by demonstrating a significant left ventricular dilatation and an increase in left ventricular mass in these patients. Surprisingly, a concomitant increase in right ventricular mass was not observed. Although RV dilatation was clearly evident, average right ventricular muscle mass was not increased. This finding indicates that wall thinning and thus RV eccentric remodelling is the typical RV phenotypic response pattern in IDC. In concordance with this view Doherty et al.8 showed no significant difference in RV muscle mass between IDC and control patients. The significant elevation of RV mass demonstrated by Quaife et al.9 and Beltrami et al.10 may be explained by a more advanced stage of myopathic disease and technical factors. In contrast to our patients who were evaluated under stable clinical conditions and modern drug therapy both studies comprised post-mortem specimens suggestive of end-stage disease. Furthermore, imaging based quantification of myocardial RV mass excluding papillary muscles may have contributed to these divergent findings.
One important finding of our study was that the myopathic process resulted in a significant reduction of the interventricular mass relation. In healthy subjects RV free wall comprises about 30% of total mass. In IDC this relationship is significantly altered due to an imbalanced increase in LV mass. As a result, the RV comprises about 20% of LV mass. The observed shift in RV/LV mass ratio is in good concordance with the above mentioned data by Doherty et al.8.
Right ventricular hypertrophy and pulmonary hypertension
Although obvious, the issue of pressure overload induced RV hypertrophy has hardly been addressed in the setting of left sided heart failure. In IPH the myocardium bears no intrinsic abnormalities and RV hypertrophy develops as a compensatory response to elevated RV afterload11,12,13. Our study demonstrated a significant relationship between RV muscle mass and pulmonary artery pressure in IDC. There are two possible explanations for this finding. First, the adaptive capabilities of the RV myocardium to pressure overload are preserved in heart failure patients. And second, RV hypertrophy may result from the myopathic process itself. In this scenario pulmonary hypertension may probably reflect a more advanced stage of myocardial disease and hemodynamic burden and a true causal relationship to RV hypertrophy may be lacking.
Relation of right to left ventricular muscle mass
There was no relationship between left ventricular muscle mass and the interventricular mass ratio. This finding can be interpreted in the following way. Deviations in left ventricular muscle mass are usually accompanied by similar deviations in right ventricular muscle mass As a consequence the interventricular mass ratio remains unchanged. This finding supports the assumption that there is a baseline, balanced form of biventricular hypertrophy in patients with IDC, which develops in a consensual manner in both ventricles. This pattern may be a consequence of the underlying myopathic process or reflect shared properties of myocardium beyond the myopathic process such as a common genetic background or a uniform reaction to certain humoral stimuli.
In contrast to variations in left ventricular muscle mass, variations in right ventricular muscle mass had a significant impact on the IVMR. We suggest that this finding is an expression of a second, unbalanced form of ventricular hypertrophy present in heart failure, which is closely related to RV pressure overload. We assume that RV hypertrophy due to pressure overload develops as a chamber-specific phenomenon in IDC patients and does not induce LV hypertrophy. As a consequence of this unbalanced form of biventricular hypertrophy IVMR increases as right ventricular mass increases. Most previous studies reported that in states of isolated RV or LV pressure or volume overload, hypertrophy is usually restricted to the affected ventricle. Vonk- Noordegraaf et al.14 reported that patients with severe emphysema had an elevated right ventricular muscle mass and that RV hypertrophy resulted in a significantly increased RV/LV wall thickness ratio in presence of a normal RV/LV volume ratio. Leeuwenburgh et al.15 demonstrated that chronic RV pressure overload led to a significant increase in right-to-left ventricle wall thickness ratio in neonatal sheep hearts. The principle of a chamber-specific coupling of hemodynamic load and hypertrophy may further be extended to states of biventricular hemodynamic overload. An increased volume load exposed on either ventricle typically results in a balanced ventricular hypertrophy as demonstrated in arteriovenous shunt formations or in the athletes heart16,17. However, exceptions from this principle have been noted. In multivariate analysis Cuspidi et al.18 found that RV wall thickness was the best independent correlate of LVMM in patients with essential hypertension. In this study right ventricular hypertrophy was associated with LV hypertrophy in one- fifth of the patients. Gottdiener et al.19 demonstrated that in patients with LV pressure overload RV hypertrophy is closely related to LV hypertrophy but not to pulmonary hypertension. A possible explanation for this apparently conflicting result is that the majority of patients reported in this study had arterial hypertension. The latter condition is known to induce myocardial hypertrophy on a multifactorial basis including humoral factors that may affect both ventricles19.
Study limitations
The hemodynamic burden exposed to the right ventricle was characterized in terms of singular pressure measurements. Left atrial volume estimation and quantification of functional mitral regurgitation was not performed. Such measurements are supposed to provide more reliable information on the average effect of LV filling pressure and subsequently pulmonary artery pressure rise over time. Inclusion of papillary muscles into right ventricular mass measurements may explain a systematically higher RV mass than predicted. Despite careful application of two different normalization methods including an allometric model (the most advanced to our knowledge), a strong correlation between body weight and RVMM remained. The reason for the exaggeration of the RVMM-weight relationship in our population is not clear. Since body weight is incorporated into both normalization formulas it was not introduced into the multivariate regression model.
Conclusions
The present study revealed two important characteristics of RV hypertrophy in IDC patients. First, there is a close relationship between left and right ventricular muscle mass. This finding indicates that ventricular remodelling of both ventricles is coupled probably due to a shared myopathic process. Second, RV hypertrophy is further determined by the extent of pulmonary artery pressure rise indicating that there is a preserved ability of the RV to respond to an increased afterload. This component of RV hypertrophy has no impact on LV hypertrophy and can therefore be considered as a chamber-specific phenomenon.
Competing Interests
The authors have declared that no competing interest exists.
References
1. Pattynama PMT, Willems LNA, Smit AH, Van der Wall EE, de Roos A. Early diagnosis of cor pulmonale with MR imaging of the right ventricle. Radiology. 1992;182:375-9
2. Saba TS, Foster J, Cockburn M, Cowan M, Peacock AJ. Ventricular mass index using magnetic resonance imaging accurately estimates pulmonary artery pressure. Eur Respir J. 2002;20:1519-1524
3. Kawut SM, Lima JAC, Barr G, Chahal HC, Jain A, Tandri H, Praestgaard A, Bagiella E, Kizer JR, Johnson WC, Kronmal RA, Bluemke DA. Sex and Race Differences in Right Ventricular Structure and Funktion. Circulation. 2011;123:2542-2551
4. Chirinos JA, Segers P, De Buyzere ML, Kronmal RA, Claessens M, Gillebert TC, John-Sutton MS, Raja MW, Rietzschel ER. Left Ventricular Mass: Allometric Scaling, Normative Values, Effect of Obesity, and Prognostic Performance. Hypertension. 2010;56:91
5. Dec GW, Fuster V. Idiopathic dilated cardiomyopathy. N Engl J Med. 1994;331:1564-1575
6. Linzbach AJ. Heart failure from the point of view of quantitative anatomy. Am J Cardiol. 1960;5:370-82
7. Plehn G, Vormbrock J, Lefringhausen L, van Bracht M, Plehn A, Butz T, Trappe H-J, Meissner A. Prevalence of ventricular discordance and ist relation to functional capacity in idiopathic dilated cardiomyopathy. Clin Res Cardiol. 2009;98:371-378
8. Doherty NE, Fufita N, Caputo GR, Higgins CB. Measurement of right ventricular mass in normal and dilated cardiomyopathic ventricles using cine magnetic resonance imaging. Am J Cardiol. 1992;69:1223-1228
9. Quaife RA, Lynch D, Badesch DB, Voelkel NF, Lowes BD, Robertson AD, Bristow MR. Right ventricular phenotypic characteristics in subjects with primary pulmonary hypertension or idiopathic dilated cardiomyopathy. Journal of Cardiac Failure. 1999;5:46-54
10. Beltrami CA, Finato N, Rocco M, Feruglio GA, Puricelli C, Cigola E, Sonnenblick EH, Olivetti G, Anversa P. The cellular basis of dilated cardiomyopathy in humans. J Mol Cell Cardiol. 1995;27:291-305
11. Champion HC, Michelakis ED, Hassoun PM. Comprehensive invasive and noninvasive approach to the right ventricle- pulmonary circulation unit. Circulation. 2009;120:992-1007
12. Voelkel NF, Quaife RA, Leinwand LA, Barst RJ, McGoon MD, Meldrum DR, Dupuis J, Long CS, Rubin LJ, Smart FW, Suzuki YJ, Gladwin M, Denhom EM, Gail DB. Right ventricular function and failure: Report of a national heart, lung and blood institute working group on cellular and molecular mechanisms of right heart failure. Circulation. 2006;114:1883-1891
13. Van Wolferen SA, Marcus JT, Boonstra A, Marques KMJ, Bronzwaer JGF, Spreeuwenberg MD, Postmus PE, Vonk- Noordegraaf A. Prognostic value of right ventricular mass, volume, and function in idiopathic pulmonary arterial hypertension. European Heart Journal. 2007;28:250-1257
14. Vonk- Noordegraaf A, Marcus JT, Roseboom B, Postmus PE, Faes TJ, de Vries PM. The effect of right ventricular Hypertrophy on left ventricular ejection fraction in pulmonary emphysema. Chest. 1997;112:640-645
15. Leeuwenburgh BPJ, Helbing WA, Wenink ACG, Steendijk P, de Jong R, Dreef EJ, Gittenberger-de Groot A, Baan J, van der Laarse A. Chronic right ventricular pressure overload results in a hyperplastic rather than a hypertrophic myocardial response. Journal of Anatomy. 2008;212:286-294
16. Dolgilevich SM, Siri FM, Atlas SA, Eng C. Changes in collagenase and collagen gene expression after induction of aortocaval fistula in rats. Am J Physiol Heart Circ Physiol. 2001;281:H207-H214
17. Scharhag J, Schneider G, Urhausen A, Rochette V, Kramann B, Kindermann W. Athlete´s Heart. Right and left ventricular mass and function in male endurance athletes and untrained individuals determined by magnetic resonance imaging. J Am Coll Cardiol. 2002;40:1856-1863
18. Cuspidi C, Negri F, Giudici V, Valerio C, Meani S, Sala C, Esposito A, Masaidi M, Zanchetti A, Mancia G. Prevalence and clinical correlates of right ventricular hypertrophy in essential hypertension. J Hypertens. 2009;27:854-860
19. Gottdiener JS, Gay JA, Maron BJ, Fletcher RD. Increased right ventricular wall thickness in left ventricular pressure overload: echocardiographic determination of hypertrophic response of the “nonstressed” ventricle. J Am Coll Cardiol. 1985;6137:550-555
Author contact
![]() Corresponding author: Gunnar Plehn, MD. Department of Cardiology, Johanniter-Krankenhaus Rheinhausen, Kreuzacker 1-7,
47228 Duisburg, Tel. 02065/97-1401/-1402
Fax 02065/97-1480 e-mail: Julia.Vormbrockde.
Corresponding author: Gunnar Plehn, MD. Department of Cardiology, Johanniter-Krankenhaus Rheinhausen, Kreuzacker 1-7,
47228 Duisburg, Tel. 02065/97-1401/-1402
Fax 02065/97-1480 e-mail: Julia.Vormbrockde.