Impact Factor ISSN: 1449-1907

 Global reach, higher impact
Int J Med Sci 2013; 10(11):1430-1436. doi:10.7150/ijms.6645 This issue Cite
Research Paper
Brachial-Ankle Pulse Wave Velocity Predicts Decline in Renal Function and Cardiovascular Events in Early Stages of Chronic Kidney Disease
Hye Eun Yoon1,2, Dong Il Shin1,3, Sung Jun Kim1,2, Eun Sil Koh1, Hyeon Seok Hwang1, Sungjin Chung1, Seok Joon Shin1,2 ![]()
1. Department of Internal Medicine, College of Medicine, The Catholic University of Korea;
2. Division of Nephrology, Department of Internal Medicine, Incheon St. Mary's Hospital;
3. Division of Cardiology, Department of Internal Medicine, Incheon St. Mary's Hospital.
Received 2013-5-8; Accepted 2013-7-29; Published 2013-8-22
Abstract
Objective: In this study, we investigated the predictive capacity of the brachial-ankle aortic pulse wave velocity (baPWV), a marker of arterial stiffness, for the decline in renal function and for cardiovascular events in the early stages of chronic kidney disease (CKD).
Method: Two hundred forty-one patients who underwent a comprehensive check-up were included and were divided into two groups according to their estimated glomerular filtration rates (eGFR): patients with CKD categories G2, G3a and G3b (30 ≤ eGFR < 90 ml/min/1.73m2, eGFR < 90 group; n=117) and those with eGFR ≥ 90 ml/min/1.73 m2 (eGFR ≥ 90 group; n=124). The change in renal function, the eGFR change, was determined by the slope of eGFR against time. We analysed whether baPWV was associated with eGFR change or predicted cardiovascular events.
Results: baPWV was independently associated with eGFR change in a multivariate analysis of the total patients (β=-0.011, p=0.011) and remained significantly associated with eGFR change in a subgroup analysis of the eGFR < 90 group (β=-0.015, p=0.035). baPWV was independently associated with cardiovascular events (odds ratio=1.002, p=0.048) in the eGFR < 90 group, but not in the eGFR ≥ 90 group. The receiver operative characteristic curve analysis showed that 1,568 cm/sec was the cut-off value of baPWV for predicting CV events in the eGFR < 90 group (area under curve=0.691, p=0.03)
Conclusions: In patients with early stages of CKD, baPWV was independently associated with the decline in renal function and short-term cardiovascular events.
Keywords: arterial stiffness, cardiovascular disease, chronic kidney disease, pulse wave velocity.
Introduction
Patients with chronic kidney disease (CKD) have increased cardiovascular (CV) morbidity and mortality (1). Furthermore, increased arterial stiffness is one of the non-traditional CV risk factors in the CKD population (2). Arterial stiffness may also play a role in the progression of CKD (3-6). Pulse wave velocity (PWV), which is one of the markers of arterial stiffness, can be measured non-invasively (7). The gold standard measurement is the carotid-femoral PWV (cfPWV), which directly reflects the aortic PWV (7). Recently, however, the brachial-ankle PWV (baPWV) has been reported to be a good marker of arterial stiffness, and the measurement of baPWV is simpler and more applicable to general population studies than previously used measures (8, 9). Until now, previous reports have shown that baPWV is associated with the progression of CKD (3) and CV outcomes only in patients with late stages of CKD (10, 11). However, the impact of baPWV on the change in renal function and CV events has not been demonstrated for the early stages of CKD. The purpose of this study was to investigate whether baPWV is associated with changes in renal function and CV events in patients with early stages of CKD who are treated in the community.
Materials and Methods
Study Population
Seven hundred thirty-four subjects were screened, who underwent a comprehensive check-up, including the measurement of baPWV, between January 2011 and February 2012. Four hundred ninety-three patients who lacked follow-up measurements of serum creatinine were excluded, so 241 subjects were included in the final analysis. The study was approved by the Institutional Review Board of the Catholic University of Korea (OC13RISI0024).
Patients were divided into groups according to the guideline provided by the Kidney Disease: Improving Global Outcomes (KDIGO) organization (12). CKD patients with evidence of kidney damage lasting for > 3 months and eGFR < 90 ml/min/1.73 m2 (CKD categories G2, G3a and G3b) were assigned to the eGFR < 90 group (n = 117) and subjects with eGFR ≥ 90 ml/min/1.73 m2 were assigned to the eGFR ≥ 90 group (n = 124).
Measurement of baPWV
baPWV was measured with an automated device, a Colin waveform analyser (VP1000, Colin Co. Ltd, Komaki, Japan), which measures the pulse volume waveforms of the brachial and tibial arteries via a connection to a plethysmographic sensor (9). The baPWV measurement was made in a room with a temperature around 25 °C after the subject had rested for 5 min in a supine position. The distance of each segment (Lb-La) was calculated based on the patient's height, and the time delay from the ascending point of the brachial waveform to the ascending point of each ankle waveform (DTba) was determined automatically. baPWV was calculated as the pulse wave propagation distance (Lb-La) divided by the pulse wave propagation time (DTba) and expressed in cm/s. baPWV was measured bilaterally three times in each patient, repeated measurements were taken at 10-second intervals via an automatic gain analysis, and the average value was calculated. The higher of the bilateral baPWV values was used for the analysis. Systolic and diastolic blood pressure and heart rate were measured twice using an appropriate cuff size by the same device. The average of systolic and diastolic blood pressure of bilateral arms was used for analysis.
Collection of Demographic and Clinical Data
Demographic and clinical data were retrospectively collected from medical records. Patients were defined as having diabetes if fasting glucose was > 125 mg/dL or hypoglycaemic agents were used. Subjects were defined to have hypertension is the systolic blood pressure was ≥140 mmHg or diastolic blood pressure was ≥90 mmHg or anti-hypertensive agents were used. Blood samples for biochemical assays were drawn in the fasting state and analysed with routine laboratory methods. Serum creatinine was measured by the alkaline picrate kinetic method (Jaffé method) in Olympus AU 5420 analyzer (Olympus, Bechman Coulter, CA, USA). Body mass index was calculated by dividing weight (kg) by height (m2). The estimated glomerular filtration rate (eGFR) was calculated from the serum creatinine concentration, age, sex, and race using the abbreviated Modification of Diet in Renal Disease (MDRD) formula (13). Albuminuria was assessed as urinary albumin-creatinine ratio from spot urine samples. Urinary albumin was measured by a spectrophotometry method on AU5400 chemistry system (Beckman Coulter, Fullerton, USA).
Assessment of Changes in Renal Function and Definition of the CV events
The change in renal function, the eGFR change, was assessed by the slope of eGFR plotted against time. Time was defined as the interval between the comprehensive check-up and the most recent follow-up. CV events were defined as coronary heart disease (angina pectoris or myocardial infarction), cerebrovascular disease (transient ischaemic attack, cerebral infarction, or cerebral haemorrhage), peripheral vascular disease, arrhythmia, and heart failure.
Statistical Analysis
Continuous data are presented as means ± standard deviations (SD) and were compared using Student's t test. Categorical data were compared using the χ2 test. A univariate analysis followed by a multivariate linear regression analysis was used to identify the factors associated with the change in renal function. Because the formula for eGFR includes age and the simultaneous adjustment for age and eGFR might produce confusing results within the linear regression model, age was not included in the multivariate linear regression analysis. A univariate analysis followed by a multivariate forward logistic regression analysis was used to identify the factors associated with the CV events. The estimated standard error of the coefficient (B1) was used to establish the confidence interval (CI) of the odds ratio (OR). To obtain the cut-off value of baPWV that predicts CV events, we evaluated the area under the curve (AUC) for receiver operating characteristic (ROC) curve analysis. A p value of less than 0.05 indicated significance. Statistical analyses were performed using SPSS.
Results
Patient Characteristics
The baseline characteristics of the study patients are shown in Table 1. The median baseline eGFR was 91.7 ml/min/1.73 m2 (range, 35-181 ml/min/1.73 m2), the median follow-up period was 369 days (326 to 488 days), and the median baPWV was 1,405 cm/s (range, 998-2,545 cm/s). The eGFR < 90 group showed higher prevalence of male and smoker, lower eGFR, and higher baPWV, uric acid and albuminuria levels than the eGFR ≥ 90 group. In the eGFR < 90 group, 85.5% of patients were in CKD category G2 (60 ≤ eGFR < 90 ml/min/1.73 m2, n = 100), 12.8% of patients were in CKD category G3a (45 ≤ eGFR < 60 ml/min/1.73 m2, n = 15), and 1.7% of patients were in CKD category G3b (30 ≤ eGFR < 45 ml/min/1.73 m2, n = 2).
Baseline characteristics of the study patients.
| Variables | Total population | eGFR < 90 group | eGFR ≥ 90 group | p |
|---|---|---|---|---|
| Age (years) | 52.9 ± 9.2 | 53.9 ± 10.0 | 52.0 ± 8.4 | 0.114 |
| Male, n (%) | 131 (54.4) | 72 (61.5) | 59 (47.6) | 0.03 |
| Baseline eGFR, ml/min/1.73m2 | 94.5 ± 26.9 | 72.5 ± 11.2 | 115.3 ± 19.8 | < 0.001 |
| Smoking, n (%) | 50 (20.7) | 31 (26.5) | 19 (15.3) | 0.033 |
| Diabetes, n (%) | 22 (9.1) | 12 (10.3) | 10 (8.1) | 0.555 |
| Hypertension, n (%) | 59 (24.5) | 34 (29.1) | 25 (20.2) | 0.108 |
| Use of statin, n (%) | 32 (13.3) | 16 (13.7) | 16 (12.9) | 0.86 |
| CV events, n (%) | 15 (6.2) | 10 (8.5) | 5 (4.0) | 0.147 |
| Systolic BP (mmHg) | 122.4 ± 13.5 | 122.9 ± 13.6 | 121.9 ± 13.5 | 0.532 |
| Diastolic BP (mmHg) | 79.2 ± 11.2 | 80.6 ± 10.5 | 77.9 ± 11.8 | 0.055 |
| Body mass index (kg/m2) | 24.4 ± 3.0 | 24.7 ± 2.8 | 24.1 ± 3.2 | 0.109 |
| baPWV (cm/sec) | 1461.0 ± 263.4 | 1518.6 ± 277.0 | 1406.7 ± 238.4 | 0.001 |
| Follow-up periods (days) | 389.4 ± 40.9 | 386.7 ± 39.6 | 391.9 ± 42.0 | 0.316 |
| Laboratory parameters | ||||
| Hematocrit (%) | 41.1 ± 4.0 | 42.0 ± 3.5 | 41.0 ± 4.0 | 0.166 |
| Fasting glucose (mg/dL) | 100.3 ± 25.5 | 101.6 ± 21.3 | 99.1 ± 29.0 | 0.449 |
| Albumin (g/dL) | 4.5 ± 0.2 | 4.6 ± 0.3 | 4.5 ± 0.2 | 0.154 |
| Calcium (mg/dL) | 9.2 ± 0.4 | 9.3 ± 0.4 | 9.2 ± 0.4 | 0.223 |
| Phosphorus (mg/dL) | 3.6 ± 0.5 | 3.5 ± 0.5 | 3.6 ± 0.5 | 0.292 |
| Uric acid (mg/dL) | 5.2 ± 1.5 | 5.9 ± 1.5 | 4.5 ± 1.1 | < 0.001 |
| Total cholesterol (mg/dL) | 197.2 ± 36.5 | 197.2 ± 38.7 | 197.2 ± 34.4 | 0.995 |
| Triglyceride (mg/dL) | 142.5 ± 98.2 | 152.1 ± 81.1 | 133.4 ± 111.5 | 0.139 |
| LDL-cholesterol (mg/dL) | 126.2 ± 28.3 | 127.5 ± 30.2 | 124.9 ± 26.4 | 0.484 |
| C-reactive protein (mg/L) | 1.2 ± 2.0 | 1.1 ± 1.8 | 1.3 ± 2.2 | 0.431 |
| Albuminuria (mg/g) | 57.7 ± 137.6 | 107.4 ± 185.6 | 10.0 ± 9.1 | 0.02 |
Values are expressed as mean ± SD. eGFR: estimated glomerular filtration rate; CV: cardiovascular; BP: blood pressure; baPWV:brachial artery pulse wave velocity; LDL: low density lipoprotein.
Association between baPWV and eGFR Changes
The median eGFR change was -0.39 ml/min/1.73 m2 per year (range, -79.81 to 68.03 ml/min/1.73 m2 per year) in the total population, -0.24 ml/min/1.73 m2 per year (range, -15.06 to 60.08 ml/min/1.73 m2 per year) in the eGFR < 90 group, and -0.50 ml/min/1.73 m2 per year (range, -79.81 to 68.03 ml/min/1.73 m2 per year) in the eGFR ≥ 90 group. Table 2 shows the determinants of eGFR change in the total study population and the eGFR < 90 group. In the total population, the eGFR change showed a significantly negative association with baPWV and C-reactive protein levels and a positive association with serum albumin in the univariate analysis. In the multivariate analysis, the eGFR change was independently associated with baPWV and serum albumin. In a subgroup analysis of the eGFR < 90 group, the eGFR change showed a significant negative association with baPWV, uric acid level, and albuminuria and a positive association with phosphorus levels in the univariate analysis. In the multivariate analysis, baPWV and albuminuria were independently associated with eGFR change. In a subgroup analysis of the eGFR ≥ 90 group, baPWV was the only parameter which significantly correlated with the eGFR change (β = -0.021, p = 0.008) in univariate analysis.
Determinants of eGFR change.
| Parameters | Total population | eGFR < 90 ml/min/1.73m2 | |||||||
|---|---|---|---|---|---|---|---|---|---|
| Univariate | Multivariate | Univariate | Multivariate | ||||||
| ß coefficient | p | ß coefficient | p | ß coefficient | p | ß coefficient | p | ||
| Male versus female | -0.288 | 0.91 | -9.613 | 0.097 | |||||
| Smoking | 0.57 | 0.84 | 0.763 | 0.759 | |||||
| Diabetes | -5.635 | 0.156 | -1.038 | 0.775 | |||||
| Hypertension | 0.832 | 0.755 | -2.634 | 0.275 | |||||
| Use of statin | 3.751 | 0.266 | -1.72 | 0.59 | |||||
| CV diseases | 4.931 | 0.298 | 3.158 | 0.421 | |||||
| Systolic BP | -0.078 | 0.363 | -0.03 | 0.71 | |||||
| Diastolic BP | -0.031 | 0.766 | 0.04 | 0.703 | |||||
| Body mass index | -0.344 | 0.365 | -0.133 | 0.738 | |||||
| baPWV | -0.01 | 0.018 | -0.011 | 0.011 | -0.008 | 0.038 | -0.015 | 0.035 | |
| Hematocrit | 0.079 | 0.785 | -0.618 | 0.086 | |||||
| Fasting glucose | -0.056 | 0.215 | -0.019 | 0.718 | |||||
| Albumin | 10.65 | 0.023 | 11.761 | 0.011 | 6.995 | 0.112 | |||
| Calcium | 0.303 | 0.131 | 3.59 | 0.258 | |||||
| Phosphorus | -0.087 | 0.968 | 5.561 | 0.018 | -3.805 | 0.254 | |||
| Uric acid | -0.378 | 0.624 | -1.478 | 0.047 | 2.945 | 0.115 | |||
| Total cholesterol | -0.029 | 0.358 | 0.005 | 0.868 | |||||
| Triglyceride | -0.01 | 0.383 | 0.004 | 0.779 | |||||
| LDL-cholesterol | -0.436 | 0.119 | 0.011 | 0.771 | |||||
| C-reactive protein | -1.198 | 0.033 | -0.287 | 0.642 | |||||
| Albuminuria (mg/g) | -0.022 | 0.253 | -0.023 | 0.028 | -0.035 | 0.01 | |||
This model included sex, smoking, diabetes, hypertension, use of statin, cardiovascular diseases, systolic and diastolic pressure, body mass index, brachial artery pulse wave velocity, hematocrit, fasting glucose, albumin, calcium, phosphorus, total cholesterol, triglyceride, LDL-cholesterol, C-reactive protein, and albuminuria. Categorical variables (sex, smoking, diabetes, hypertension, use of statin, cardiovascular events) were used as dummy variable, therefore assigned values of 1 (yes) and 0 (no), respectively. eGFR: estimated glomerular filtration rate; CV: cardiovascular; BP: blood pressure; baPWV: brachial artery pulse wave velocity; LDL: low density lipoprotein.
We also performed analysis of the eGFR change using the modified MDRD study equation for Korean population (14). In this analysis, the eGFR change in the total population showed a significant correlation with baPWV (β = -0.009, p = 0.013), C-reactive protein (β = -1.042, p = 0.035), and serum albumin (β = 9.392, p = 0.022) in the univariate analysis. In the multivariate analysis, the eGFR change also showed significant associations with baPWV (β = -0.01, p = 0.008) and serum albumin (β = 10.412, p = 0.01. In a subgroup analysis of the eGFR < 90 group, the eGFR change showed significant associations with baPWV (β = -0.009, p = 0.02), uric acid (β = -1.566, p = 0.024), phosphorus (β = 4.979, p = 0.026) and albuminuria (β = -0.018, p = 0.038) in the univariate analysis. In the multivariate analysis, baPWV (β = -0.014, p = 0.006) and albuminuria (β = -0.037, p = 0.001) were independently associated with eGFR change. In a subgroup analysis of the eGFR ≥ 90 group, the eGFR change correlated significantly with baPWV (β = -0.014, p = 0.026) and uric acid (β = -2.850, p = 0.047) in the univariate analysis. In the multivariate analysis, only baPWV was independently associated with eGFR change (β = -0.021, p = 0.008).
Association between baPWV and CV Events
The CV event rate was significantly higher in the eGFR < 90 group than the eGFR ≥ 90 group (10.3% versus 3.2%, p = 0.037). In the eGFR < 90 group, 12 CV events occurred (10.3%) during follow-up (median 367 days, range 326 to 488 days), which included coronary heart disease (n = 5) cerebrovascular disease (n = 6), and arrhythmia (n = 1). In the eGFR ≥ 90 group, four CV events occurred (3.2%) during follow-up (median 370 days, range 329 to 475 days), which included coronary heart disease (n = 1) and cerebrovascular disease (n = 3).
Table 3 shows the predictors of CV events in the total study population and the eGFR < 90 group. In the univariate analysis, age, hypertension, and baPWV were significantly associated with CV events. In the multivariate analysis, age and hypertension were independent predictors of CV events. In a subgroup analysis of the eGFR < 90 group, age and baPWV were significantly associated with CV events in the univariate analysis. In the multivariate analysis, only baPWV was an independent predictor of CV events. In a subgroup analysis of the eGFR ≥ 90 group, age (OR, 1.16; 95% CI, 1.02-1.32; p = 0.02) and hypertension (OR, 13.36; 95% CI, 1.33-134.62; p = 0.028) were significantly associated with CV events in the univariate analysis. In the multivariate analysis, only hypertension was an independent predictor of CV events (OR, 13.36; 95% CI, 1.33-134.62; p = 0.028).
Predictors of short-term cardiovascular events.
| Parameters | Total population | eGFR < 90 ml/min/1.73m2 | |||||||
|---|---|---|---|---|---|---|---|---|---|
| Univariate | Multivariate | Univariate | Multivariate | ||||||
| OR (95% CI) | p | OR (95% CI) | p | OR (95% CI) | p | OR (95% CI) | p | ||
| Age (per 1 year) | 1.09 (1.03 - 1.16) | 0.002 | 1.09 (1.02 - 1.15) | 0.008 | 1.07 (1.00 - 1.13) | 0.048 | |||
| Male versus female | 1.43 (0.50 - 4.08) | 0.5 | 0.19 (0.02 - 2.33) | 0.188 | |||||
| Baseline eGFR (per 1 ml/min/1.73m2) | 0.99 (0.97 - 1.01) | 0.189 | 1.04 (0.98 - 1.11) | 0.184 | |||||
| eGFR change (per 1 ml/min/1.73m2/year) | 1.01 (0.98 - 1.03) | 0.71 | 0.98 (0.92 - 1.03) | 0.418 | |||||
| Smoking | 0.87 (0.24 - 3.20) | 0.839 | 0.92 (0.23 - 3.63) | 0.901 | |||||
| Diabetes | 1.46 (0.31 - 6.91) | 0.63 | 1.90 (0.36 - 9.91) | 0.446 | |||||
| Hypertension | 4.50 (1.60 - 12.69) | 0.004 | 3.38 (1.17 - 9.79) | 0.025 | 2.75 (0.82 - 9.24) | 0.102 | |||
| Use of statin | 3.33 (1.08 - 10.33) | 0.037 | 2.36 (0.57 - 9.86) | 0.239 | |||||
| CV diseases | 1.01 (0.12 - 8.17) | 0.996 | 0.97 (0.11 - 8.39) | 0.978 | |||||
| Systolic BP | 1.04 (1.00 - 1.08) | 0.035 | 1.03 (0.99 - 1.08) | 0.175 | |||||
| Diastolic BP | 1.02 (0.98 - 1.07) | 0.292 | 1.01 (0.95 - 1.07) | 0.784 | |||||
| Body mass index | 1.01 (0.86 - 1.19) | 0.915 | 0.95 (0.76 - 1.21) | 0.697 | |||||
| baPWV (per 1 cm/sec) | 1.01 (1.00 - 1.01) | 0.008 | 1.002 (1.000 - 1.004) | 0.048 | 1.002 (1.000 - 1.004) | 0.048 | |||
| Hematocrit | 1.06 (0.93 - 1.21) | 0.399 | 0.96 (0.79 - 1.17) | 0.69 | |||||
| Fasting glucose | 0.10 (0.98 - 1.02) | 0.935 | 1.00 (0.98 - 1.03) | 0.91 | |||||
| Albumin | 0.55 (0.07 - 4.53) | 0.582 | 0.15 (0.01 - 1.88) | 0.142 | |||||
| Calcium | 0.98 (0.83 - 1.16) | 0.85 | 0.38 (0.06 - 2.25) | 0.283 | |||||
| Phosphorus | 1.04 (0.40 - 2.72) | 0.937 | 1.27 (0.35 - 4.69) | 0.715 | |||||
| Uric acid | 1.04 (0.74 - 1.45) | 0.842 | 0.89 (0.58 - 1.38) | 0.612 | |||||
| Total cholesterol | 1.01 (1.00 - 1.02) | 0.206 | 1.01 (0.99 - 1.02) | 0.327 | |||||
| Triglyceride | 1.00 (1.00 - 1.01) | 0.744 | 1.00 (0.99 - 1.01) | 0.703 | |||||
| LDL-cholesterol | 1.01 (0.99 - 1.02) | 0.483 | 1.00 (0.98 - 1.02) | 0.955 | |||||
| C-reactive protein (per 1 mg/L) | 0.89 (0.62 - 1.30) | 0.555 | 0.92 (0.60 - 1.43) | 0.723 | |||||
| Albuminuria (mg/g) | 1.00(0.99 - 1.006) | 0.922 | 0.997(0.99 - 1.004) | 0.416 | |||||
Adjustments were made for age, sex, baseline eGFR, eGFR change, smoking, diabetes, hypertension, use of statin, cardiovascular diseases, systolic and diastolic pressure, body mass index, brachial artery pulse wave velocity, hematocrit, fasting glucose, albumin, calcium, phosphorus, total cholesterol, triglyceride, LDL-cholesterol, C-reactive protein, and albuminuria. OR, odds ratio per 1SD increment, if there is no comment; CI, confidence interval; eGFR: estimated glomerular filtration rate; CV: cardiovascular; BP: blood pressure; baPWV: brachial artery pulse wave velocity; LDL: low density lipoprotein.
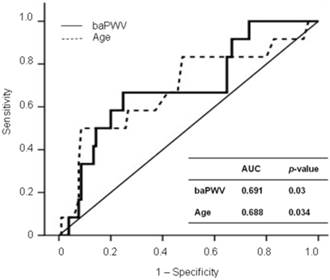
Figure 1 shows the ROC curves for CV events in the eGFR < 90 group. The baPWV provided a higher predictive value for CV events (AUC, 0.691; p = 0.03) than age (AUC, 0.688; p = 0.034). The ROC curve showed that 1,568 cm/sec was the cut-off value of baPWV for predicting CV events in the eGFR < 90 group (sensitivity, 0.667; specificity, 0.752).
ROC curve analysis for CV outcomes with calculated AUCs.
Discussion
Previous reports on the clinical implications of arterial stiffness in CKD mainly focused on moderate to severe CKD (2-5, 15, 16). The purpose of the present study was to evaluate the predictive capacity of baPWV for the progression of early stages of CKD and for short-term CV events. Our results demonstrate that baPWV was significantly associated with eGFR change both in patients with early stages of CKD and in subjects with normal eGFR. baPWV also independently predicted short-term CV events in patients in the early stages of CKD.
Increased arterial stiffness has been shown in previous studies to be associated with reduced eGFR(17-19). Moreover, recent evidence has demonstrated that arterial stiffness independently predicts the progression of CKD (3-6) In those studies, arterial stiffness was assessed by the measurement of baPWV (3), cfPWV (4), radial-dorsalis pedis PWV (5), and/or the augmentation index (5, 6). In the present study, we also showed a significant association between baPWV and eGFR change in the eGFR < 90 group, which included the patients in the early stages of CKD (categories G2, G3a and G3b). Our study differs from those reported previously in that our study population predominantly included patients with CKD category 2 (stage 2), whereas previous studies (3-5) focused on CKD stages 3-5 according to the National Kidney Foundation-Kidney Disease Outcomes Quality Initiative guidelines (20). Several studies have shown that the aortic PWV is not associated with CKD (21) and does not predict CKD progression (15). In those studies, cfPWV was measured, which is the gold standard measurement for arterial stiffness and directly reflects the aortic PWV (7, 22). baPWV may not be as accurate as cfPWV, because baPWV reflects the status of both the central and peripheral arteries. However, there is evidence supporting the use of the baPWV measurement as a marker of arterial stiffness and baPWV correlates strongly with cfPWV (8, 9). The study by Upadhyay et al. (21) did not include CKD stage 2 patients, whereas the study by Chue et al. (15) included patients with CKD stages 2 to 4 recruited from specialist renal clinics. Our study population was subjects who had undergone a comprehensive check-up at our hospital and were treated in the community rather than by renal specialists. This difference explains the predominance of CKD category 2 patients in our study population. Our results suggest that baPWV significantly can reflect disease progression in early stages of CKD as well as albuminuria. The mechanism underlying this association is unclear, but it has been suggested that arterial stiffness might result in the greater transmission of systolic blood pressure to the glomerular capillaries, the exacerbation of glomerular hypertension, and the progression of renal damage (23, 24), although our study did not show an association between blood pressure and eGFR change.
Arterial stiffness has been reported to be an independent predictor of CV mortality and morbidity both in non-dialysis CKD patients (2) and in dialysis patients (22). We have also reported that PWV predicts CV outcomes in haemodialysis patients (16). In those studies, arterial stiffness was assessed by measuring cfPWV. Increasing evidence indicates that baPWV is also an independent predictor of CV outcomes in patients with CKD stage 5 (10, 11). However, the impact of baPWV on CV events in the early stages of CKD has not been reported. The present study showed that baPWV was independently associated with CV events in the eGFR < 90 group, although the follow-up period was relatively short. Therefore, baPWV may provide an additional risk assessment tool for short-term CV events in patients with CKD categories G2, G3a and G3b. Several mechanisms have been suggested to explain this association. One is that increased arterial stiffness leads to an increased left ventricular load and an increased myocardial oxygen demand (25, 26). Another is that increased arterial stiffness increases the cycle stress on arterial wall thickening and promotes atherosclerosis (27).
Our study had several limitations. First, because it was an observational study, drug effects were not assessed, including the anti-hypertensive agents such as angiotensin receptor blockers and/or angiotensin-converting enzyme inhibitors, which may be the reason why there was no association between the eGFR change and blood pressure. Second, the time point and frequency of serum creatinine measurement were not regularly scheduled, which partly explains the wide range of eGFR changes. Third, the causes of renal dysfunction in the eGFR < 90 group which may affect the eGFR change was not analysed because the subjects were treated in the community and were not under treatment by a specialist nephrologist. Fourth, there was a difference in sex between the eGFR < 90 group and the eGFR ≥ 90 group. This may be because of the small number of patients. However, the sex did not show a significant effect on the eGFR change or CV events in both groups. Fifth, the follow-up period was relatively short and the sample size was small. This may explain the relatively low ß-coefficient and low OR of baPWV, despite the predictive values of baPWV for eGFR change and CV outcomes were significant. If the follow-up period is extended and the sample size is larger, the statistical power would be enhanced. In addition, albuminuria did not predict CV outcomes in our study probably because of the short follow-up period, although it is known to predict kidney and CV risks (28).
In conclusion, the present study shows that baPWV is associated with the decline in renal function and short-term CV events in patients with early stages of CKD. These findings extend the indications for baPWV measurement to the early stages of CKD and may be useful in the risk stratification of CKD progression and adverse CV outcomes in these patients.
Acknowledgements
This study was supported by a grant through the National Research Foundation of Korea (NRF) funded by the Ministry of Education, Science, and Technology, Republic of Korea (20110013312).
Competing Interests
The authors have declared that no competing interest exists.
References
1. Go AS, Chertow GM, Fan D. et al. Chronic kidney disease and the risks of death, cardiovascular events, and hospitalization. N Engl J Med. 2004;351:1296-305
2. Karras A, Haymann JP, Bozec E. et al. Large artery stiffening and remodeling are independently associated with all-cause mortality and cardiovascular events in chronic kidney disease. Hypertension. 2012;60:1451-7
3. Chen SC, Chang JM, Liu WC. et al. Brachial-ankle pulse wave velocity and rate of renal function decline and mortality in chronic kidney disease. Clin J Am Soc Nephrol. 2011;6:724-32
4. Ford ML, Tomlinson LA, Chapman TP. et al. Aortic stiffness is independently associated with rate of renal function decline in chronic kidney disease stages 3 and 4. Hypertension. 2010;55:1110-5
5. Taal MW, Sigrist MK, Fakis A. et al. Markers of arterial stiffness are risk factors for progression to end-stage renal disease among patients with chronic kidney disease stages 4 and 5. Nephron Clin Pract. 2007;107:c177-81
6. Takenaka T, Mimura T, Kanno Y. et al. Qualification of arterial stiffness as a risk factor to the progression of chronic kidney diseases. Am J Nephrol. 2005;25:417-24
7. Asmar R, Benetos A, Topouchian J. et al. Assessment of arterial distensibility by automatic pulse wave velocity measurement. Validation and clinical application studies. Hypertension. 1995;26:485-90
8. Tanaka H, Munakata M, Kawano Y. et al. Comparison between carotid-femoral and brachial-ankle pulse wave velocity as measures of arterial stiffness. J Hypertens. 2009;27:2022-7
9. Yamashina A, Tomiyama H, Takeda K. et al. Validity, reproducibility, and clinical significance of noninvasive brachial-ankle pulse wave velocity measurement. Hypertens Res. 2002;25:359-64
10. Morimoto S, Yurugi T, Aota Y. et al. Prognostic significance of ankle-brachial index, brachial-ankle pulse wave velocity, flow-mediated dilation, and nitroglycerin-mediated dilation in end-stage renal disease. Am J Nephrol. 2009;30:55-63
11. Washida N, Wakino S, Hayashi K. et al. Brachial-ankle pulse wave velocity predicts silent cerebrovascular diseases in patients with end-stage renal diseases. J Atheroscler Thromb. 2010;17:165-72
12. Chapter 1. Definition and classification of CKD. Kidney International Supplements. 2013;3:19-62
13. Levey AS, Bosch JP, Lewis JB. et al. A more accurate method to estimate glomerular filtration rate from serum creatinine: a new prediction equation. Modification of Diet in Renal Disease Study Group. Ann Intern Med. 1999;130:461-70
14. Lee CS, Cha RH, Lim YH. et al. Ethnic coefficients for glomerular filtration rate estimation by the Modification of Diet in Renal Disease study equations in the Korean population. J Korean Med Sci. 2010;25:1616-25
15. Chue CD, Edwards NC, Davis LJ. et al. Serum phosphate but not pulse wave velocity predicts decline in renal function in patients with early chronic kidney disease. Nephrol Dial Transplant. 2011;26:2576-82
16. Shin SJ, Kim YK, Chung S. et al. The impact of the aortic pulse wave velocity on the cardiovascular outcomes of hemodialysis patients. J Korean Med Sci. 2009;24(Suppl):S121-8
17. Kawamoto R, Kohara K, Tabara Y. et al. An association between decreased estimated glomerular filtration rate and arterial stiffness. Intern Med. 2008;47:593-8
18. Ohya Y, Iseki K, Iseki C. et al. Increased pulse wave velocity is associated with low creatinine clearance and proteinuria in a screened cohort. Am J Kidney Dis. 2006;47:790-7
19. Chen JH, Chen SC, Liu WC. et al. Determinants of peripheral arterial stiffness in patients with chronic kidney disease in southern Taiwan. Kaohsiung J Med Sci. 2009;25:366-73
20. K/DOQI clinical practice guidelines for chronic kidney disease. evaluation, classification, and stratification. Am J Kidney Dis. 2002;39:S1-266
21. Upadhyay A, Hwang SJ, Mitchell GF. et al. Arterial stiffness in mild-to-moderate CKD. J Am Soc Nephrol. 2009;20:2044-53
22. Blacher J, Guerin AP, Pannier B. et al. Impact of aortic stiffness on survival in end-stage renal disease. Circulation. 1999;99:2434-9
23. Bidani AK, Griffin KA, Picken M. et al. Continuous telemetric blood pressure monitoring and glomerular injury in the rat remnant kidney model. Am J Physiol. 1993;265:F391-8
24. Griffin KA, Picken MM, Churchill M. et al. Functional and structural correlates of glomerulosclerosis after renal mass reduction in the rat. J Am Soc Nephrol. 2000;11:497-506
25. Bots ML, Dijk JM, Oren A. et al. Carotid intima-media thickness, arterial stiffness and risk of cardiovascular disease: current evidence. J Hypertens. 2002;20:2317-25
26. Dart AM, Kingwell BA. Pulse pressure--a review of mechanisms and clinical relevance. J Am Coll Cardiol. 2001;37:975-84
27. Shyy JY, Chien S. Role of integrins in endothelial mechanosensing of shear stress. Circ Res. 2002;91:769-75
28. Levey AS, de Jong PE, Coresh J. et al. The definition, classification, and prognosis of chronic kidney disease: a KDIGO Controversies Conference report. Kidney Int. 2011;80:17
Author contact
![]() Corresponding author: Seok Joon Shin, MD, PhD. Department of Internal medicine, Incheon St. Mary's Hospital, College of Medicine, The Catholic University of Korea. 56 Dongsu-ro, Pupyung-gu, Incheon, Republic of Korea, 403-720. Tel: 82-32-280-5091, Fax: 82-32-280-5987 E-mail: imkidneyac.kr.
Corresponding author: Seok Joon Shin, MD, PhD. Department of Internal medicine, Incheon St. Mary's Hospital, College of Medicine, The Catholic University of Korea. 56 Dongsu-ro, Pupyung-gu, Incheon, Republic of Korea, 403-720. Tel: 82-32-280-5091, Fax: 82-32-280-5987 E-mail: imkidneyac.kr.