Impact Factor ISSN: 1449-1907
- Issue 6; 2026
- Issue 5; 2026
- Issue 4; 2026
- Issue 3; 2026
- Issue 2; 2026
- Volume 23; 2026
- Past Issues
- Editorial Board
- Cover Images
- Index & Coverage
- Cover Suggestion
- Special Issues
Introduction
Materials and Methods
Results
Discussion
Abbreviations
Supplementary Material
Acknowledgements
References

 Global reach, higher impact
Int J Med Sci 2019; 16(4):537-547. doi:10.7150/ijms.31274 This issue Cite
Research Paper
Microarray Analysis of Long Non-Coding RNAs and Messenger RNAs in a Mouse Model of Oxygen-Induced Retinopathy
Lusi Zhang1,2*, Xiaolin Fu1,2,3*, Huilan Zeng1,2, Jiang-Hui Wang4,5, Yingqian Peng1,2, Han Zhao1,2, Jingling Zou1,2, Liwei Zhang1,2, Yun Li1,2, Shigeo Yoshida6, Yedi Zhou1,2 ![]()
1. Department of Ophthalmology, The Second Xiangya Hospital, Central South University, Changsha, Hunan 410011, China
2. Hunan Clinical Research Center of Ophthalmic Disease, Changsha, Hunan 410011, China
3. Department of Ophthalmology, Hainan Western Central Hospital, Danzhou, Hainan 571799, China
4. Centre for Eye Research Australia, Royal Victorian Eye and Ear Hospital, East Melbourne, Victoria, Australia
5. Ophthalmology, Department of Surgery, University of Melbourne, East Melbourne, Victoria, Australia
6. Department of Ophthalmology, Kurume University School of Medicine, Kurume, Fukuoka 830-0011, Japan
* These authors contributed equally to this work.
Received 2018-11-6; Accepted 2019-2-8; Published 2019-4-20
Abstract
Objective: Retinal neovascularization is a severe complication of many ocular diseases. To clarify the possible functions and therapeutic potential of long non-coding RNAs (lncRNAs) and messenger RNAs (mRNAs) in retinal neovascularization, we assessed their expression profile in a mouse model of oxygen-induced retinopathy (OIR).
Methods: Microarray analysis was performed to identify altered lncRNA and mRNA expressions between OIR and control mice. The microarray results were validated by qRT-PCR. Gene Ontology (GO) and Kyoto Encyclopedia of Genes and Genomes (KEGG) pathway analyses were conducted to determine biological functions and signaling pathways of the altered or interacted mRNAs. A coding-non-coding gene co-expression (CNC) network was constructed to identify the interaction of lncRNAs and mRNAs.
Results: We identified 198 up-regulated and 175 down-regulated lncRNAs (fold change≥2.0, P<0.05), respectively in OIR mice compared to control mice. We also identified 412 up-regulated and 127 down-regulated mRNAs (fold change≥2.0, P<0.05), respectively in OIR mice compared to control mice. GO and KEGG analyses suggested that altered mRNAs were enriched in immune system process, exopeptidase activity, ECM-receptor interaction and protein digestion and absorption. Four validated lncRNAs (ENSMUST00000165968, ENSMUST00000153785, ENSMUST00000134409, and ENSMUST00000154285) and the nearby coding gene pairs were analyzed. A CNC network profile based on those validated altered lncRNAs as well as 410 interacted mRNAs was composed of 509 connections. Moreover, the GO and KEGG analyses demonstrated that these interacted mRNAs mainly enriched in blood vessel development, angiogenesis, cell adhesion molecules and leukocyte transendothelial migration pathways.
Conclusion: Our data highlight the utility of altered lncRNA and mRNA profiling in understanding the pathogenesis of ischemia-induced retinal neovascularization and further suggest that therapeutic potential of altered lncRNA for retinal neovascularization.
Keywords: lncRNA, mRNA, microarray, expression profile, oxygen-induced retinopathy, retinal neovascularization, angiogenesis
Introduction
Proliferative diabetic retinopathy (PDR), retinopathy of prematurity (ROP) and retinal vein occlusions are major causes of blindness worldwide, and retinal neovascularization is the key pathogenesis of these ocular diseases [1]. Although anti-vascular endothelial growth factor (VEGF) therapies have been applied in those retinal neovascular diseases [2], the effect and efficiency is not satisfied in some patients[3], and intravitreal injection of anti-VEGF agents may also lead to numerous systemic and local complications, such as tractional retinal detachment, endophthalmitis and acute elevation of blood pressure [2, 4]. Thus, identification of novel targets that play important roles in retinal neovascularization is urgently needed to treat patients who are not responsible for anti-VEGF therapy.
Long non-coding RNAs (lncRNAs) are more than 200 nucleotides long that function at chromatin organization [5], transcriptional and post-transcriptional regulation [6]. LncRNAs locate in the nucleus and/or cytoplasm, and are recognized to be expressed in a tissue-specific manner [7], indicating that lncRNAs may play crucial regulatory roles in a wide range of biological and pathological processes [8-12]. Moreover, studies have shown that dysregulation of lncRNAs is associated with several ocular diseases, such as diabetic retinopathy [13, 14], glaucoma [15], proliferative vitreoretinopathy [16] and retinoblastoma [17]. Moreover, targeting some important lncRNAs, such as MIAT [14] and MALAT1 [18], have been proved to ameliorate pathogenesis of diabetic microvascular complication. Oxygen-induced retinopathy (OIR) is a mouse model which widely used in investigating retinal neovascularization [19-21]. However, the expressions profile and functions of lncRNAs in retinal neovascularization still remain unclear in this model.
In this study, we performed microarray to profile the lncRNAs and mRNAs expression in a mouse model of OIR. Subsequently, we interrogated the putative functions of the altered lncRNA and mRNAs through the in silico analysis to reveal the underlying regulatory networks in retinal neovascularization. Our results provide a clue for understanding the potential mechanism of ocular pathological neovascularization on the lncRNA aspect.
Materials and Methods
Animals and ethics statement
C57BL/6J mice were purchased from Hunan SJA Laboratory Animal Co., Ltd. and were used in all experiments. All of the experimental procedures in the present study were approved by the Institutional Animal Care and Use Committee of Central South University, China. Animals were treated based on the ARVO Statement for the Use of Animals in Ophthalmic and Vision Research.
Oxygen-induced retinopathy mouse model
OIR mouse model was induced as previously described [19-21]. In brief, newborn pups were exposed to 75% oxygen at postnatal day 7 (P7), and were returned to room air 5 days later at P12. We used pups kept in room air continuously as the control group. Retinas were collected at P17 in both OIR and room air control mice.
Microarray analysis
We isolated total RNA from retinas by using Trizol RNA extraction kit (Invitrogen life technologies). Retinas from both eyes of a mouse were mixed as one sample. The quantification of RNA was assessed by Nano Drop ND-1000, and standard denaturing agarose gel electrophoresis was performed to evaluate RNA integrity. The expression profile of lncRNAs and mRNAs were detected by Arraystar Mouse LncRNA Microarray (V3.0, including 35923 lncRNA and 24881 mRNA transcripts). A total of 6 samples (3 OIR and 3 room air controls) were used for microarray analysis. The tissue preparations and microarray hybridization were performed by using the Agilent Gene Expression Hybridization Kit (Agilent Technology, USA). Acquired array images were analyzed by Feature Extraction software (Agilent Technologies, version 11.0.1.1).
Quantitative real-time reverse transcription polymerase chain reaction (qRT-PCR)
Total RNA of 500 ng was reverse-transcripted using RevertAid First Strand cDNA Synthesis Kit (Thermo Scientific, Waltham, MA, USA) and oligo (dT) primers. Quantitative PCR primer sequences are listed in Table 1. qRT-PCR was conducted on the Applied Biosystems® StepOneTM Plus Real-Time PCR System (Thermo Scientific, Waltham, MA, USA) using FastStart SYBR Green Master (Sigma, St. Louis, MO, USA). Relative quantification data were normalized to β-actin and analyzed by ∆∆Ct method which has been previously described by Livak[22].
The primer sequences designed for qRT-PCR.
| Gene name | Forward and reverse primer | Product length (bp) |
|---|---|---|
| β-actin | F:5' GTGCTATGTTGCTCTAGACTTCG 3' R:5' ATGCCACAGGATTCCATACC 3' | 174 |
| ENSMUST00000165968 | F:5' CAGGATGCAGCAGGTGGAAGC 3' R:5' TGCTCCAGGCTGTAGTCTGTGG 3' | 132 |
| ENSMUST00000153785 | F:5' AGGTTCCTCTCCTAGCAGATCATTCTC 3' R:5' GAGCGGCAACTTCTGAGGTCTTAC 3' | 99 |
| ENSMUST00000134409 | F:5' GCTGAGTCCTCTTGCTGTGCTC 3' R:5' GTACCTGGAGGCTTGGCATGAC 3' | 158 |
| ENSMUST00000154285 | F:5' CCGCTTGGTGGTGCATGTATCC 3' R:5' CCAAGGTGCTGAGTGGCTAAGG 3' | 184 |
Gene Ontology (GO) analysis, Kyoto Encyclopedia of Genes and Genomes (KEGG) pathway analysis and lncRNAs/mRNAs co-expression network
To reveal putative biological changes in mRNA profile and the possible influence of these co-expressed genes and lncRNAs between OIR and control mice, GO analysis (http://www.geneontology.org) and KEGG pathway analysis (http://www.genome.jp/kegg/) were conducted on altered mRNAs, and the interacted mRNAs within the network.
This coding-non-coding gene co-expression (CNC) network was constructed from 4 validated lncRNAs, and the Pearson correlation coefficients (PCCs) ≥ 0.99 was chosen as the baseline of correlation analysis. Cytoscape V2.8.3 (The Cytoscape Consortium, San Diego, CA, USA) was used to graphically represent the interaction.
Statistical Analyses
The statistical difference was assessed by Student t-test. Differentially expressed RNAs were identified by fold change (FC)≥2.0 and P<0.05.
Results
Altered lncRNA and mRNA expression identified in mouse OIR retinas
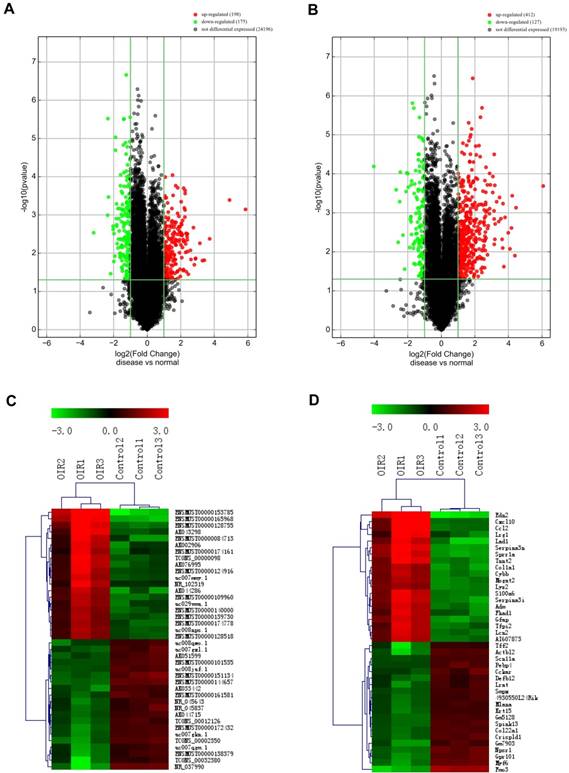
To investigate the potential difference in retinal lncRNAs and mRNAs expression profile between OIR mice and room air controls, the microarray was performed to detect 35,923 lncRNAs and 24,881 mRNAs transcripts. Our microarray data analysis revealed that 198 and 175 lncRNAs were significantly upregulated and downregulated, respectively in OIR retinas compared to room air controls (FC≥2.0, P<0.05) (Fig.1A, Supplementary Table 1). The top 20 most significantly altered (both upregulated and downregulated) lncRNAs are listed in Table 3-4. The hierarchical cluster of heat map (Fig. 1C) showed the top 20 significant upregulated and downregulated lncRNAs, and ENSMUST00000153785 and NR_037990 are up- and down-regulated lncRNA transcripts with the most significant changes. Moreover, the hierarchical cluster analysis in Fig. 1C suggested successfully classified lncRNAs expression profile among OIR mice and controls.
Both lncRNA and mRNA expression profiles were altered in the retinas of mice with oxygen-induced retinopathy (OIR) compared with control retinas. A and B, the volcano plots display the fold-changes and p-values of differential lncRNA (A) and mRNA (B) expression in OIR retinas. Based on the relationship between fold-change and statistical significance, subsets of lncRNAs and mRNAs were isolated. The vertical line corresponds to 2-fold change (up and down), respectively, and the horizontal line represents P=0.05. The red point represents the upregulated lncRNAs or mRNAs with statistical significance P < 0.05, while the green point represents the significantly decreased lncRNA or mRNA expressions. C and D, the heatmap of the top 20 differentially expressed lncRNAs (C) and mRNAs (D) in OIR groups. Each row represents the relative expression level of a lncRNA or a mRNA, and each column displays the expression level of a retina sample. Colors represent relative intensity of each sample. Red, high relative expression; green, low relative expression; black, no difference.
Top 20 upregulated lncRNAs identified by the microarray analysis.
| SeqName | P-value | FDR | Fold Change | Regulation | Strand | Relationship | OIR 1 | OIR 2 | OIR 3 | Control 1 | Control 2 | Control 3 |
|---|---|---|---|---|---|---|---|---|---|---|---|---|
| ENSMUST00000153785 | 0.000717 | 0.041078 | 58.296270 | up | - | intronic antisense | 12.748014 | 10.783653 | 11.958061 | 6.109738 | 5.469894 | 6.314101 |
| ENSMUST00000165968 | 0.000409 | 0.034852 | 30.109933 | up | - | intergenic | 8.449434 | 6.941674 | 7.838548 | 2.890805 | 2.992069 | 2.610279 |
| ENSMUST00000128755 | 0.004214 | 0.079423 | 13.221707 | up | - | exon sense-overlapping | 9.614595 | 7.468352 | 8.861307 | 4.748751 | 5.034332 | 4.986661 |
| AK043298 | 0.015278 | 0.137199 | 10.588272 | up | - | intronic antisense | 7.422740 | 4.626696 | 6.647810 | 2.720966 | 2.776193 | 2.986901 |
| ENSMUST00000084713 | 0.015632 | 0.138298 | 9.804105 | up | + | natural antisense | 8.423589 | 6.038433 | 7.642350 | 3.663067 | 4.905065 | 3.656082 |
| AK044286 | 0.005517 | 0.087954 | 8.824446 | up | - | intergenic | 6.588106 | 5.014738 | 5.853877 | 3.387348 | 2.322640 | 2.322215 |
| TCONS_00000098 | 0.013644 | 0.130032 | 7.373443 | up | + | intronic antisense | 6.376250 | 4.062401 | 5.523742 | 2.322231 | 2.322640 | 2.670507 |
| AK076995 | 0.014021 | 0.132143 | 7.371760 | up | + | intergenic | 13.404888 | 11.165535 | 12.681263 | 9.608284 | 9.148856 | 9.848519 |
| AK002906 | 0.020071 | 0.154626 | 7.029474 | up | - | intronic antisense | 7.653271 | 5.450538 | 6.973938 | 4.281011 | 3.129105 | 4.227380 |
| ENSMUST00000109960 | 0.002150 | 0.059662 | 6.769551 | up | + | exon sense-overlapping | 8.496722 | 7.243502 | 7.930245 | 4.976211 | 4.986118 | 5.430960 |
| ENSMUST00000124916 | 0.014606 | 0.134809 | 6.111074 | up | + | exon sense-overlapping | 7.861429 | 5.677544 | 6.847170 | 4.184352 | 4.080745 | 4.286768 |
| uc007mmy.1 | 0.008464 | 0.106702 | 5.992399 | up | - | intergenic | 7.930451 | 6.101834 | 7.092284 | 4.500277 | 4.299462 | 4.575429 |
| ENSMUST00000174161 | 0.035534 | 0.197475 | 5.468632 | up | - | exon sense-overlapping | 7.971536 | 5.525110 | 6.948038 | 4.791939 | 3.697002 | 4.602203 |
| uc029vmu.1 | 0.009057 | 0.109769 | 5.298308 | up | - | intergenic | 7.293197 | 5.804285 | 6.782840 | 4.464540 | 3.703680 | 4.495507 |
| uc008nps.1 | 0.003121 | 0.070411 | 5.271589 | up | - | exon sense-overlapping | 7.488088 | 6.237517 | 6.975574 | 4.357455 | 4.696039 | 4.452972 |
| ENSMUST00000174778 | 0.004496 | 0.080692 | 5.242659 | up | - | intergenic | 5.510269 | 4.239752 | 4.961743 | 2.322231 | 2.896421 | 2.322215 |
| ENSMUST00000140000 | 0.003751 | 0.074957 | 5.202250 | up | + | natural antisense | 11.112645 | 9.900810 | 10.629968 | 8.155371 | 7.874338 | 8.476307 |
| ENSMUST00000139730 | 0.003180 | 0.070468 | 5.121506 | up | - | exon sense-overlapping | 6.917978 | 5.666435 | 6.221930 | 4.070318 | 3.890004 | 3.776317 |
| NR_102319 | 0.030389 | 0.184947 | 5.035999 | up | + | intergenic | 8.337279 | 5.907723 | 7.444553 | 4.834966 | 4.924242 | 4.933513 |
| ENSMUST00000128518 | 0.003024 | 0.069549 | 4.980561 | up | + | intronic antisense | 11.217601 | 10.039138 | 10.746596 | 8.285136 | 8.572280 | 8.196994 |
Note: FDR: false discovery rate; Fold change: the absolute ratio (no log scale) of average normalized intensities between two groups (Control vs OIR); OIR 1-3 and Control 1-3: each sample's normalized intensity (log2 scale). Similarly hereinafter.
Top 20 downregulated lncRNAs identified by the microarray analysis.
| SeqName | P-value | FDR | Fold Change | Regulation | Strand | Relationship | OIR 1 | OIR 2 | OIR 3 | Control 1 | Control 2 | Control 3 |
|---|---|---|---|---|---|---|---|---|---|---|---|---|
| NR_037990 | 0.002930 | 0.068842 | 9.133963 | down | - | intergenic | 6.496983 | 8.179386 | 7.582079 | 10.578837 | 10.609151 | 10.644182 |
| TCONS_00002350 | 0.001018 | 0.044913 | 5.122573 | down | - | intergenic | 3.398719 | 3.932456 | 4.328286 | 6.167787 | 6.210308 | 6.351972 |
| ENSMUST00000144657 | 0.000003 | 0.005941 | 5.077183 | down | - | intergenic | 3.286124 | 3.147485 | 3.127405 | 5.459278 | 5.546184 | 5.587637 |
| ENSMUST00000151134 | 0.000340 | 0.033792 | 4.954950 | down | + | exon sense-overlapping | 5.979015 | 5.713499 | 5.694462 | 8.139835 | 7.774910 | 8.398843 |
| TCONS_00032380 | 0.034449 | 0.195020 | 4.527209 | down | + | intergenic | 2.325546 | 4.667767 | 3.856036 | 5.671859 | 5.771139 | 5.942216 |
| uc007gkn.1 | 0.001968 | 0.057266 | 4.089872 | down | - | intergenic | 4.373150 | 5.274554 | 5.118756 | 6.920329 | 6.895577 | 7.046721 |
| ENSMUST00000172432 | 0.002383 | 0.062812 | 4.076810 | down | + | exon sense-overlapping | 7.235149 | 8.230403 | 7.929420 | 9.829141 | 9.772890 | 9.875263 |
| ENSMUST00000138379 | 0.016487 | 0.142047 | 3.963568 | down | - | intergenic | 3.852936 | 5.523289 | 4.670400 | 6.755349 | 6.409639 | 6.842036 |
| AK033442 | 0.003089 | 0.070273 | 3.946389 | down | + | intergenic | 4.226163 | 4.571180 | 3.525945 | 6.125788 | 6.133114 | 6.005986 |
| uc007qgm.1 | 0.011972 | 0.123334 | 3.800768 | down | - | intergenic | 3.220853 | 4.704746 | 3.926131 | 5.841821 | 5.717811 | 6.070972 |
| uc008juf.1 | 0.000020 | 0.012523 | 3.701798 | down | + | natural antisense | 4.666801 | 4.596779 | 4.770185 | 6.444632 | 6.660882 | 6.592930 |
| ENSMUST00000101535 | 0.000009 | 0.009977 | 3.691835 | down | - | bidirectional | 2.325546 | 2.384761 | 2.322128 | 4.222979 | 4.121313 | 4.341157 |
| uc007gxl.1 | 0.001245 | 0.048164 | 3.582029 | down | + | intergenic | 2.774715 | 3.120723 | 2.579922 | 4.422965 | 4.601643 | 4.973084 |
| AK051599 | 0.000514 | 0.036142 | 3.544961 | down | - | intergenic | 5.247084 | 4.775668 | 4.983758 | 6.846470 | 6.620034 | 7.017314 |
| TCONS_00012126 | 0.001979 | 0.057322 | 3.538878 | down | + | intronic antisense | 2.325546 | 3.137978 | 2.842555 | 4.746606 | 4.590341 | 4.439007 |
| ENSMUST00000161581 | 0.001803 | 0.055911 | 3.535215 | down | + | intronic antisense | 4.429070 | 5.057126 | 4.958622 | 6.669437 | 6.881586 | 6.359189 |
| NR_045837 | 0.005624 | 0.089054 | 3.459985 | down | + | intergenic | 2.325546 | 3.143285 | 2.710571 | 4.403620 | 4.185882 | 4.962196 |
| AK044715 | 0.000682 | 0.040064 | 3.358611 | down | + | intronic antisense | 5.603129 | 6.181402 | 6.033230 | 7.678702 | 7.586453 | 7.796200 |
| NR_045643 | 0.007305 | 0.100085 | 3.344530 | down | - | intron sense-overlapping | 8.272287 | 9.375150 | 8.883848 | 10.638966 | 10.331851 | 10.785879 |
| uc008qwo.1 | 0.004288 | 0.079723 | 3.282559 | down | - | intronic antisense | 4.425972 | 3.572821 | 4.425015 | 5.793922 | 5.771023 | 6.003325 |
We also identified that 412 and 127 significantly increased and reduced mRNAs, respectively in OIRs compared to room air controls (fold change≥2.0, P<0.05) (Fig.1B, Supplementary Table 2). The top 20 significantly altered (both upregulated and downregulated) lncRNAs are listed in Table 5-6. Among them, edn2 and fmo3 are the up- and downregulated genes with the most significant changes in OIR retinas. Meanwhile, the hierarchical cluster of heat map (Fig. 1D) also showed the classification of mRNAs expression profile in the P17 OIR retinas as well.
Top 20 upregulated mRNAs identified by the microarray analysis.
| SeqName | Gene Symbol | P-value | Fold Change | Regulation | Chrom | OIR 1 | OIR 2 | OIR 3 | Control 1 | Control 2 | Control 3 |
|---|---|---|---|---|---|---|---|---|---|---|---|
| NM_007902 | Edn2 | 0.000205 | 67.381397 | up | chr4 | 11.852624 | 10.303807 | 11.289775 | 4.877096 | 5.045049 | 5.301226 |
| NM_009252 | Serpina3n | 0.000737 | 21.945872 | up | chr12 | 9.307844 | 7.668389 | 8.591409 | 4.155878 | 3.957815 | 4.086316 |
| NM_021274 | Cxcl10 | 0.012493 | 20.920455 | up | chr5 | 10.216826 | 6.826442 | 9.337704 | 4.328950 | 4.440061 | 4.451434 |
| NM_009264 | Sprr1a | 0.000364 | 18.752312 | up | chr3 | 10.062212 | 8.794292 | 9.433780 | 5.356192 | 5.026828 | 5.220274 |
| NM_133664 | Lad1 | 0.002447 | 18.169869 | up | chr1 | 7.659905 | 6.033975 | 7.007441 | 3.506036 | 2.322640 | 2.322215 |
| NM_011333 | Ccl2 | 0.008392 | 17.072770 | up | chr11 | 10.247771 | 7.412768 | 9.424877 | 4.785440 | 4.976798 | 5.042302 |
| NM_001130176 | Tnnt2 | 0.003248 | 15.923864 | up | chr1 | 10.822550 | 8.708082 | 10.084477 | 5.902835 | 6.098196 | 5.634722 |
| NM_001199940 | Serpina3i | 0.001304 | 13.928220 | up | chr12 | 8.721851 | 7.263056 | 8.195904 | 4.538610 | 4.381300 | 3.861084 |
| NM_029796 | Lrg1 | 0.023929 | 13.268675 | up | chr17 | 8.218846 | 4.754638 | 6.925944 | 3.403098 | 2.920299 | 2.386174 |
| NM_010277 | Gfap | 0.000579 | 12.789066 | up | chr11 | 15.814435 | 14.657697 | 15.289936 | 11.587811 | 11.295535 | 11.848205 |
| NM_011313 | S100a6 | 0.001415 | 11.725444 | up | chr3 | 12.736235 | 11.184588 | 12.090365 | 8.514794 | 8.378681 | 8.463001 |
| NM_007742 | Col1a1 | 0.000404 | 11.093194 | up | chr11 | 7.350857 | 6.503708 | 6.813182 | 3.296546 | 3.810072 | 3.146321 |
| NM_009627 | Adm | 0.001672 | 10.740590 | up | chr7 | 9.376728 | 7.938694 | 8.770966 | 5.289006 | 5.578209 | 4.944169 |
| NM_007807 | Cybb | 0.000520 | 9.827009 | up | chrX | 6.284053 | 5.254420 | 5.689879 | 2.322231 | 2.693649 | 2.322215 |
| NM_008491 | Lcn2 | 0.001927 | 9.274859 | up | chr2 | 10.781325 | 9.284550 | 10.217709 | 6.831314 | 7.035850 | 6.776445 |
| NM_009364 | Tfpi2 | 0.004769 | 9.134172 | up | chr6 | 9.771275 | 7.940594 | 9.080595 | 5.493661 | 5.638994 | 6.085987 |
| NM_177448 | Mogat2 | 0.000197 | 9.117081 | up | chr7 | 7.704113 | 6.972424 | 7.414555 | 3.980103 | 4.155026 | 4.390246 |
| NM_177868 | Fhad1 | 0.006403 | 8.921200 | up | chr4 | 9.166995 | 7.314457 | 8.454878 | 5.459930 | 5.392350 | 4.612338 |
| NM_017372 | Lyz2 | 0.000032 | 8.909107 | up | chr10 | 9.377222 | 8.941198 | 9.078166 | 5.838286 | 5.975234 | 6.117223 |
| NM_001204910 | AI607873 | 0.001438 | 8.888613 | up | chr1 | 8.415281 | 7.072290 | 7.920147 | 4.528947 | 4.592748 | 4.830148 |
Top 20 downregulated mRNAs identified by the microarray analysis.
| SeqName | Gene Symbol | P-value | Fold Change | Regulation | Chrom | OIR 1 | OIR 2 | OIR 3 | Control 1 | Control 2 | Control 3 |
|---|---|---|---|---|---|---|---|---|---|---|---|
| NM_008030 | Fmo3 | 0.000064 | 16.284224 | down | chr1 | 2.825890 | 2.364353 | 3.137431 | 6.911447 | 6.719705 | 6.772731 |
| NM_008657 | Myf6 | 0.000256 | 6.457197 | down | chr10 | 4.612338 | 5.304050 | 5.222832 | 7.700051 | 7.722884 | 7.789008 |
| NM_175497 | Actbl2 | 0.005672 | 5.932106 | down | chr13 | 2.325546 | 3.940411 | 3.371026 | 5.865282 | 5.703255 | 5.774079 |
| NM_001033360 | Gpr101 | 0.000516 | 5.585098 | down | chrX | 5.267588 | 6.034113 | 5.634033 | 8.066730 | 7.992215 | 8.321536 |
| NM_175678 | Npsr1 | 0.000091 | 5.447918 | down | chr9 | 4.373860 | 4.804202 | 4.524192 | 7.082227 | 6.838859 | 7.118283 |
| ENSMUST00000113172 | Gm7903 | 0.003727 | 4.876647 | down | chrX | 2.325546 | 3.421091 | 2.322128 | 4.864159 | 5.154450 | 4.907825 |
| NM_009363 | Tff2 | 0.027743 | 4.556195 | down | chr17 | 3.511692 | 5.727574 | 4.891790 | 6.904248 | 6.953879 | 6.836418 |
| NM_031402 | Crispld1 | 0.000284 | 4.285419 | down | chr1 | 5.009625 | 5.520657 | 5.393212 | 7.386189 | 7.269699 | 7.565915 |
| NM_001168423 | Spink13 | 0.000095 | 4.155850 | down | chr18 | 7.918376 | 8.298454 | 7.956590 | 10.150014 | 10.016010 | 10.172827 |
| NM_027174 | Col22a1 | 0.000099 | 3.989103 | down | chr15 | 6.579486 | 6.996267 | 6.898594 | 8.816916 | 8.862802 | 8.782823 |
| NM_183320 | Gm5128 | 0.000218 | 3.909112 | down | chrX | 2.325546 | 2.784199 | 2.322128 | 4.435049 | 4.475323 | 4.422023 |
| NM_023624 | Lrat | 0.007738 | 3.690353 | down | chr3 | 8.957304 | 10.177897 | 9.685661 | 11.532595 | 11.234553 | 11.704990 |
| NM_008469 | Krt15 | 0.001462 | 3.582905 | down | chr11 | 6.272760 | 7.090776 | 6.681673 | 8.530754 | 8.508751 | 8.529093 |
| NM_023774 | 4930550L24Rik | 0.001266 | 3.519266 | down | chrX | 3.887049 | 4.602469 | 4.240050 | 5.997637 | 5.947053 | 6.230702 |
| NM_029993 | Mlana | 0.001245 | 3.515738 | down | chr19 | 5.456453 | 6.205720 | 5.873087 | 7.599213 | 7.764418 | 7.613112 |
| NM_009827 | Cckar | 0.001693 | 3.481647 | down | chr5 | 4.075800 | 4.090868 | 3.695177 | 5.778705 | 5.391791 | 6.090659 |
| NM_025357 | Smpx | 0.000191 | 3.458745 | down | chrX | 2.325546 | 2.764756 | 2.542606 | 4.297434 | 4.275888 | 4.430330 |
| NM_152802 | Defb12 | 0.003577 | 3.430810 | down | chr8 | 3.179997 | 3.787608 | 2.912021 | 5.212757 | 4.811799 | 5.190719 |
| NM_028526 | Pebp4 | 0.000152 | 3.406140 | down | chr14 | 2.325546 | 2.322138 | 2.322128 | 3.930714 | 4.340979 | 4.002533 |
| NM_011887 | Scn11a | 0.000002 | 3.304723 | down | chr9 | 6.678956 | 6.791706 | 6.766182 | 8.453526 | 8.449595 | 8.507312 |
Validation of differential lncRNAs expression by qRT-PCR and nearby coding gene expression analyses
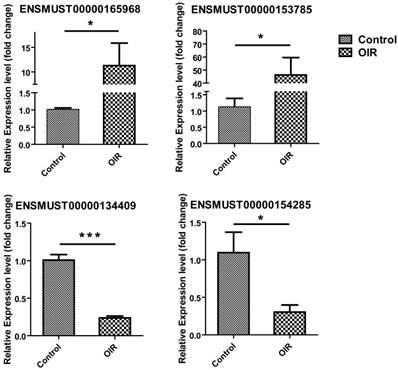
LncRNAs were selected for qRT-PCR validation from those which have their nearby associated coding genes, and the genomic position of the coding gene is within 300kb upstream or downstream of the altered lncRNA region. Four lncRNAs, ENSMUST00000165968, ENSMUST00000153785, ENSMUST00000134409, and ENSMUST00000154285 were selected to validate the altered lncRNAs in microarray analysis by qRT-PCR. The results showed that the expression of ENSMUST00000165968 and ENSMUST00000153785 was significantly increased to 11.60±3.25-fold and 46.16±13.39-fold in OIR mice (p=0.0173 and p=0.0151, respectively; Fig. 2). Likewise, ENSMUST00000134409 and ENSMUST00000154285 were significantly decreased to 0.24±0.024-fold and 0.30±0.093-fold in OIR mice (p<0.0001 and p=0.0336, respectively; Fig. 2). The qRT-PCR results were consistent with the microarray altered expression data in Table 2. These data suggested the reliability and reproducibility of the lncRNAs expression profile detected by microarray.
Validation of differential lncRNA expression by qRT-PCR. Relative expression of lncRNAs ENSMUST00000165968, ENSMUST00000153785, ENSMUST00000134409, and ENSMUST00000154285 in the retina from OIR and control mice was shown. As compared to control, n = 4 for each group. *, P < 0.05; ***, P < 0.001, Student t-test.
Validated lncRNAs with significantly altered expression in OIR retinas with their nearby coding mRNA expression.
| lncRNA Name | Nearby Gene | Relationship between lncRNA and nearby genea | lncRNA expression in microarray | mRNA expression in microarray | ||||||
|---|---|---|---|---|---|---|---|---|---|---|
| Expression level | Fold change | P-value | FDR | Expression level | Fold change | P-value | FDR | |||
| ENSMUST00000165968 | Serpina3j | upstream | up | 30.11 | 0.0004 | 0.0349 | up | 3.64 | 0.0002 | 0.0178 |
| Serpina3i | 13.93 | 0.0013 | 0.0382 | |||||||
| Serpina3g | 2.58 | 0.0020 | 0.0460 | |||||||
| Serpina3n | 21.95 | 0.0007 | 0.0300 | |||||||
| ENSMUST00000153785 | Fgf2 | intronic antisense | up | 58.30 | 0.0007 | 0.0411 | up | 2.25 | 0.0030 | 0.0526 |
| ENSMUST00000134409 | Col4a2 | upstream | down | 2.60 | 0.0123 | 0.1240 | up | 2.20 | 0.0019 | 0.0444 |
| ENSMUST00000154285 | C1qa | downstream | down | 2.46 | 0.0129 | 0.1267 | up | 3.23 | 0.00005 | 0.0112 |
a, upstream or downstream, the genomic position of the coding gene is within 300kb upstream or downstream of the differentially expressed lncRNA region. Intronic antisense, the genomic position of the coding gene is located in the antisense strand of lncRNA intron.
To explore the possible role of altered lncRNAs in local regulation of gene expression [23], we further analyze the nearby coding gene pairs (distance≤300 kb) based on the genomic information of the validated lncRNAs. We found that the expression level of the lncRNAs' nearby genes all increased significantly in OIR retina (Table 2). For example, serpina3 within upstream of ENSMUST00000165968 and FGF2 within the intronic antisense strand of ENSMUST00000153785 were up-regulated in OIR retina compared to control, respectively. Moreover, COL4A2 within upstream of ENSMUST00000134409 and C1QA within downstream of ENSMUST00000154285 showed increased expression levels.
GO enrichment and KEGG pathway analyses on differentially expressed coding genes
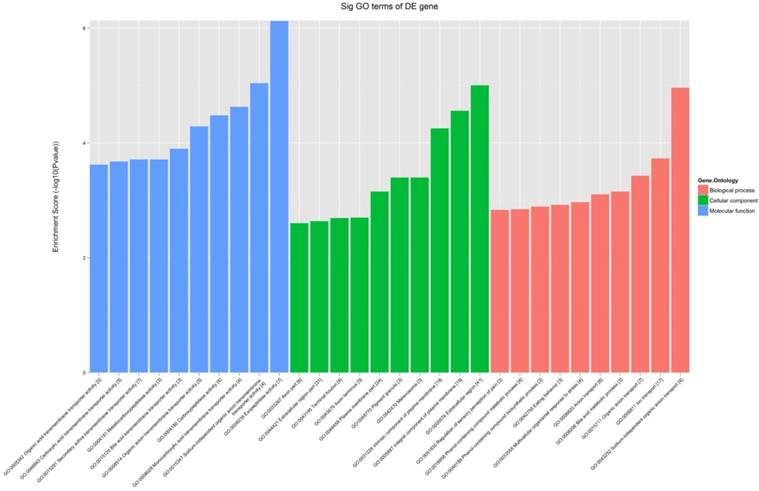
All the 539 altered mRNAs underwent GO enrichment analysis and KEGG pathway analysis. The top 10 enriched GO terms on upregulated genes were listed including immune system process (ontology: biological process, GO: 0002376), extracellular region (ontology: cellular component, GO: 0005576) and binding (ontology: molecular function, GO: 0005488) (Fig. 3). On the other hand, the top 10 enriched GO term on downregulated genes were listed including sodium-independent organic anion transport (ontology: biological process, GO: 0043252), extracellular region (ontology: cellular component, GO: 0005576) and exopeptidase activity (ontology: molecular function, GO: 0008238) (Fig. 4).
The GO analysis of significantly up-regulated mRNAs.
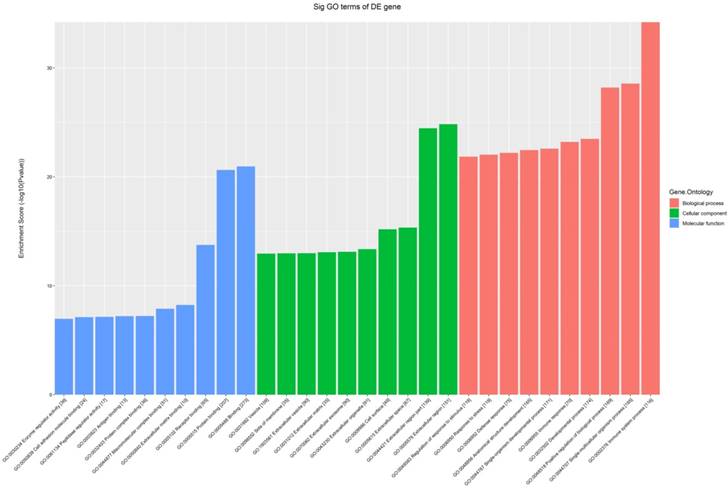
The GO analysis of significantly down-regulated mRNAs.
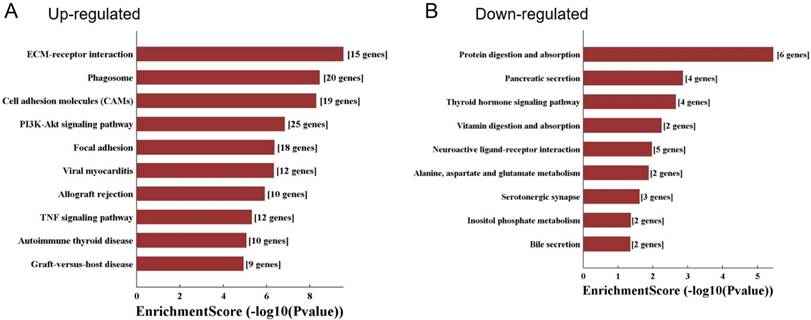
KEGG pathway analysis was conducted and demonstrated that the upregulated genes were involved in ECM-receptor interaction, phagosome, PI3K-Akt signaling pathway, and TNF signaling pathway (Fig. 5A). While downregulated genes were enriched in the pathways including protein digestion and absorption, vitamin digestion and absorption, and neuroactive ligand-receptor interaction (Fig. 5B).
KEGG pathway analysis of differentially expressed mRNAs. A. The top 10 significant pathways which were correlated with the up-regulated genes. B. The top 9 significant pathways which were correlated with the down-regulated genes.
The lncRNA-mRNA co-expression network with GO enrichment and KEGG pathway analyses
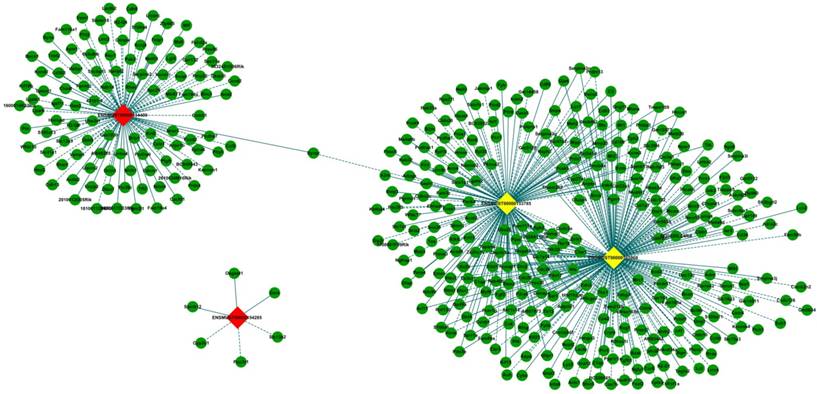
CNC network analysis was constructed according to 4 validated differentially expressed lncRNAs with 410 interacted mRNAs. It was composed of 414 nodes (lncRNAs and mRNAs) and 509 edges to connect these nodes, which include 280 positive (continuous lines) and 229 negative (dotted lines) interactions between lncRNAs and mRNAs (Fig. 6). Three of the selected 4 lncRNAs (ENSMUST00000165968, ENSMUST00000153785 and ENSMUST00000134409) were connected by mRNAs. In particular, two upregulated lncRNAs, ENSMUST00000165968 and ENSMUST00000153785 were connected by a large number of mRNAs, which demonstrated that these lncRNAs might have more common functional pathways in retinal neovascularization.
The lncRNA-mRNA co-expression network. LncRNAs and mRNAs with PCCs≥ 0.99 were selected to construct the network. The network shows the interaction among the lncRNAs and their potential regulated coding genes. Box nodes represent lncRNAs, and circle nodes (green) represent interacted mRNAs. Yellow represents up-regulated lncRNA, and red represents down-regulated lncRNA. Continuous edges show the positive relationship between lncRNAs and mRNAs, while dotted edges describe the inhibitive relationship.
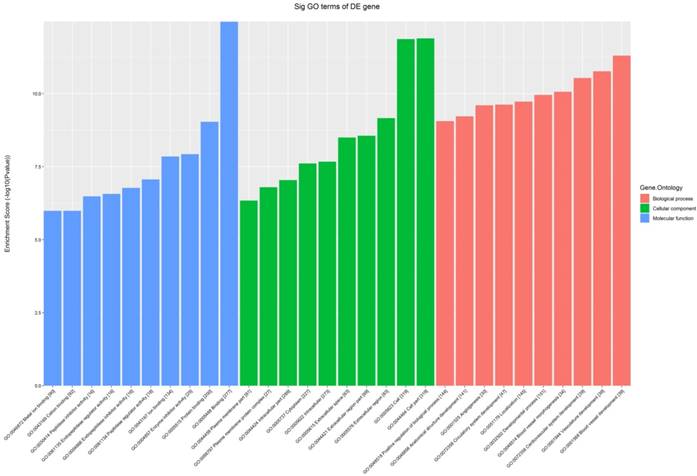
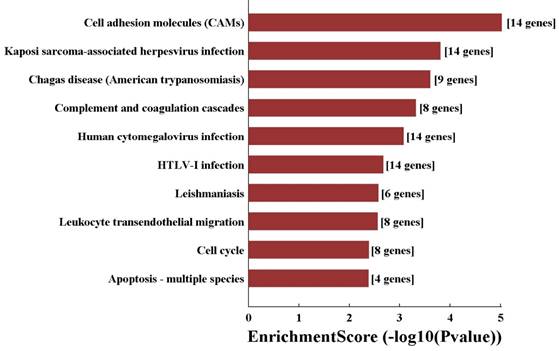
In order to predict the functions of the lncRNAs, we performed GO and KEGG pathway analyses of those interacted mRNAs according to the results of the CNC network. The top 10 enriched GO terms on these interacted genes were listed including blood vessel development (ontology: biological process, GO: 0001568), cell part (ontology: cellular component, GO: 0044464) and binding (ontology: molecular function, GO: 0005488) (Fig. 7). On the other hand, KEGG pathway analysis showed the top 10 pathways of those interacted mRNAs enriched, including cell adhesion molecules (Fig. 8).
The GO analysis of interacted mRNA by CNC network attributes in the target organism.
KEGG pathway analysis of significant pathways of interacted mRNA by CNC network.
Discussion
Previous studies investigated the role of several kinds of molecules and cells in retinal neovascularization by OIR mouse model [24-27]. By using microarray analysis, a study assessed the lncRNA expression profiles in the retina of OIR mice; however, the study only examined lncRNA expression in OIR retinas at P7, P12 and P17, and have not compared the OIR retinas to room air controls at the same time point [28]. In the present study, we analyzed the lncRNAs and mRNAs expressions in OIR retinas compared to room air controls at the same age of P17 (the peak of neovascularization [19]), which indicated the comparison between disease group and healthy control group.
In the present study, the altered mRNA-based GO enrichment analysis has shed light on the mechanism of retinal neovascularization in OIR. Immune system process [29, 30] and response to stress [31] are well-established factors contributing to the pathogenesis of retinal neovascularization. For example, IL-12 was reported to reduce both avascular areas and neovascular tufts in OIR mice retina through enhancing the expressions of IFN-γ and other downstream chemokines [25]. Furthermore, the over-production of reactive oxygen species (ROS) triggered by retinal hypoxia in OIR situation often activates NADPH oxidase, and in turn arouses intravitreal neovascularization by the activation JAK/STAT pathway [32, 33]. In addition, our results also implicate that some other unreported biological processes such as anion or ion transport were also involved in the retinal neovascularization of OIR mice.
Our pathway analysis on mRNAs suggested some crucial pathogenic mechanisms about retinal neovascularization. For example, a number of studies have shown that vitreous collagen and integrins [34, 35] provide essential substrates for the preretinal vasculature. This is in line with our findings that upregulated genes were also enriched in the ECM- receptor interaction pathway. Moreover, some other pathways, such as PI3K-Akt signaling pathway [36, 37], and TNF signaling pathway [38] have been widely reported to impact the retinal neovascularization, and were also been enriched in our present study (Fig. 5A). We also mentioned some pathways regarding cellular basic processes, including protein digestion and absorption, vitamin digestion and absorption, which indicated that OIR situation would harm the metabolism of the retina.
Our microarray data suggested that several angiogenesis-related genes other than VEGF regulated by lncRNAs, such as collagen type Ⅳ alpha (COL4A)1 and COL4A2, were significantly increased in OIR mice retinas (Supplementary Table 2). Moreover, COL4A2 is a nearby gene of ENSMUST00000134409 at upstream (Table 2). It is suggested that spontaneous retinal and subretinal neovascular lesions occurred in COL4A1 mutant mice, and they proposed that COL4A1 or COL4A2 mutations may lead to higher risk for development of vision- threatening retinopathy [39]. Another study reported that patients with COL4A1 mutation could develop peripheral corneal opacities with corneal neovascularization [40]. In addition, COL4A1 or COL4A2 mutations may cause ocular, cerebral, renal and muscular defects, as a result, ophthalmologic examination on retinal vascular tortuosity is recommended to evaluate COL4A1- and COL4A2- mutated cerebrovascular disease [41].
Fibroblast growth factor (FGF) 2 is a potent pro-angiogenic factor that has been regarded as a therapeutic target in retinal neovascularization [42], and may also be important in the maintenance of neuroretinal function in OIR model [43]. In the present study, the gene of FGF2 increased to 2.25-fold (P=0.003) in OIR retinas, and act as the intronic antisense of altered lncRNA ENSMUST00000153785 (Table 2), which indicated the possible functions of lncRNA in retinal neovascular diseases. Likewise, another gene transforming growth factor-beta (TGFB) 1, which is also involved with retinal neovascularization [44, 45] was also increased significantly in OIR retinas, which is positively related with upregulated lncRNA ENSMUST00000165968 (Fig. 6).
The GO analysis of the CNC network revealed that the interacted genes regulated by altered lncRNAs are mainly involved in blood vessel development, vasculature development and angiogenesis (Fig. 8), suggesting that the altered lncRNAs play critical roles in the pathogenesis of retinal neovascularization through regulation of its target genes. Leukocytes play a mediated role in retinal vascular remodeling where leukocytes adhere to the vasculature by CD18 and remodel it by Fas ligand-mediated endothelial cell apoptosis [46]. We had previously demonstrated that M2-polarized macrophages were recruited by hypoxia in the inner layer of retinas in the OIR model [27]. Our KEGG analysis showed that the interacted genes were enriched in cell adhesion molecules (CAMs) and leukocyte transendothelial migration, indicating that leukocyte including macrophage adhesion molecules might be involved in the mechanisms of pathological retinal neovascularization through lncRNA regulation.
In conclusion, we demonstrated that numerous lncRNAs and mRNAs are significantly altered in the retina of OIR mice compared to control mice. Further, in silico analysis indicate that altered lncRNAs were enriched in a variety of biological process that being related to angiogenesis and vasculature development as well as cell adhesion molecules pathway. Our results highlighted that altered lncRNAs and its target genes play important roles in the ischemia-induced retinal angiogenesis however functional assessment of individual lncRNA should be guaranteed in future studies to illustrate their roles in retinal neovascularization.
Abbreviations
PDR: proliferative diabetic retinopathy; ROP: retinopathy of prematurity; lncRNA: long non-coding RNA; mRNA: messenger RNA; OIR: oxygen-induced retinopathy; GO: Gene Ontology; KEGG: Kyoto Encyclopedia of Genes and Genomes; CNC: coding- non-coding gene co-expression; VEGF: vascular endothelial growth factor; qRT-PCR: quantitative real- time reverse transcription polymerase chain reaction; PCCs: Pearson correlation coefficients; COL4A: collagen type Ⅳ alpha; FGF: fibroblast growth factor; TGFB: transforming growth factor-beta; CAMs: cell adhesion molecules.
Supplementary Material
Supplementary tables.
Acknowledgements
This work was supported by National Natural Science Foundation of China (No. 81800855, 81800856, 81700837 and 81500746), Natural Science Foundation of Hunan Province (No. 2018JJ3765 and 2018JJ3737), and Department of Science and Technology, Hunan (No.2015TP2007).
Competing Interests
The authors have declared that no competing interest exists.
References
1. Yoshida A, Yoshida S, Ishibashi T, Inomata H. Intraocular neovascularization. Histol Histopathol. 1999;14:1287-94
2. Osaadon P, Fagan XJ, Lifshitz T, Levy J. A review of anti-VEGF agents for proliferative diabetic retinopathy. Eye. 2014;28:510-20
3. Stitt AW, Curtis TM, Chen M, Medina RJ, McKay GJ, Jenkins A. et al. The progress in understanding and treatment of diabetic retinopathy. Prog Retin Eye Res. 2016;51:156-86
4. Salam A, Mathew R, Sivaprasad S. Treatment of proliferative diabetic retinopathy with antiVEGF agents. Acta Ophthalmol (Copenh). 2011;89:405-11
5. Bohmdorfer G, Wierzbicki AT. Control of Chromatin Structure by Long Noncoding RNA. Trends Cell Biol. 2015;25:623-32
6. Yang G, Lu X, Yuan L. LncRNA: a link between RNA and cancer. Biochim Biophys Acta. 2014;1839:1097-109
7. Moran I, Akerman I, van de Bunt M, Xie R, Benazra M, Nammo T. et al. Human beta cell transcriptome analysis uncovers lncRNAs that are tissue-specific, dynamically regulated, and abnormally expressed in type 2 diabetes. Cell Metab. 2012;16:435-48
8. Rapicavoli NA, Qu K, Zhang J, Mikhail M, Laberge RM, Chang HY. A mammalian pseudogene lncRNA at the interface of inflammation and anti-inflammatory therapeutics. Elife. 2013;2:e00762
9. Yang L, Lin C, Jin C, Yang JC, Tanasa B, Li W. et al. lncRNA-dependent mechanisms of androgen-receptor-regulated gene activation programs. Nature. 2013;500:598-602
10. Sun X, Yuan Y, Xiao Y, Lu Q, Yang L, Chen C. et al. Long non-coding RNA, Bmcob, regulates osteoblastic differentiation of bone marrow mesenchymal stem cells. Biochem Biophys Res Commun. 2018
11. Liu K, Yao H, Wen Y, Zhao H, Zhou N, Lei S. et al. Functional role of a long non-coding RNA LIFR-AS1/miR-29a/TNFAIP3 axis in colorectal cancer resistance to pohotodynamic therapy. Biochim Biophys Acta Mol Basis Dis. 2018;1864:2871-80
12. Jia J, Zhang M, Li Q, Zhou Q, Jiang Y. Long noncoding ribonucleic acid NKILA induces the endoplasmic reticulum stress/autophagy pathway and inhibits the nuclear factor-k-gene binding pathway in rats after intracerebral hemorrhage. J Cell Physiol. 2018;233:8839-49
13. Yan B, Tao ZF, Li XM, Zhang H, Yao J, Jiang Q. Aberrant expression of long noncoding RNAs in early diabetic retinopathy. Invest Ophthalmol Vis Sci. 2014;55:941-51
14. Yan B, Yao J, Liu JY, Li XM, Wang XQ, Li YJ. et al. lncRNA-MIAT regulates microvascular dysfunction by functioning as a competing endogenous RNA. Circ Res. 2015;116:1143-56
15. Li HB, You QS, Xu LX, Sun LX, Abdul Majid AS, Xia XB. et al. Long Non-Coding RNA-MALAT1 Mediates Retinal Ganglion Cell Apoptosis Through the PI3K/Akt Signaling Pathway in Rats with Glaucoma. Cell Physiol Biochem. 2017;43:2117-32
16. Zhou RM, Wang XQ, Yao J, Shen Y, Chen SN, Yang H. et al. Identification and characterization of proliferative retinopathy-related long noncoding RNAs. Biochem Biophys Res Commun. 2015;465:324-30
17. Huang J, Yang Y, Fang F, Liu K. MALAT1 modulates the autophagy of retinoblastoma cell through miR-124-mediated stx17 regulation. J Cell Biochem. 2018;119:3853-63
18. Liu JY, Yao J, Li XM, Song YC, Wang XQ, Li YJ. et al. Pathogenic role of lncRNA-MALAT1 in endothelial cell dysfunction in diabetes mellitus. Cell Death Dis. 2014;5:e1506
19. Connor KM, Krah NM, Dennison RJ, Aderman CM, Chen J, Guerin KI. et al. Quantification of oxygen-induced retinopathy in the mouse: a model of vessel loss, vessel regrowth and pathological angiogenesis. Nat Protoc. 2009;4:1565-73
20. Yamaji Y, Yoshida S, Ishikawa K, Sengoku A, Sato K, Yoshida A. et al. TEM7 (PLXDC1) in neovascular endothelial cells of fibrovascular membranes from patients with proliferative diabetic retinopathy. Invest Ophthalmol Vis Sci. 2008;49:3151-7
21. Ishikawa K, Yoshida S, Nakao S, Sassa Y, Asato R, Kohno R. et al. Bone marrow-derived monocyte lineage cells recruited by MIP-1beta promote physiological revascularization in mouse model of oxygen-induced retinopathy. Lab Invest. 2012;92:91-101
22. Livak KJ, Schmittgen TD. Analysis of relative gene expression data using real-time quantitative PCR and the 2(-Delta Delta C(T)) Method. Methods. 2001;25:402-8
23. Engreitz JM, Haines JE, Perez EM, Munson G, Chen J, Kane M. et al. Local regulation of gene expression by lncRNA promoters, transcription and splicing. Nature. 2016;539:452-5
24. Yamaguchi M, Nakao S, Arita R, Kaizu Y, Arima M, Zhou Y. et al. Vascular Normalization by ROCK Inhibitor: Therapeutic Potential of Ripasudil (K-115) Eye Drop in Retinal Angiogenesis and Hypoxia. Invest Ophthalmol Vis Sci. 2016;57:2264-76
25. Zhou Y, Yoshida S, Kubo Y, Kobayashi Y, Nakama T, Yamaguchi M. et al. Interleukin-12 inhibits pathological neovascularization in mouse model of oxygen-induced retinopathy. Sci Rep. 2016;6:28140
26. Nakama T, Yoshida S, Ishikawa K, Kubo Y, Kobayashi Y, Zhou Y. et al. Therapeutic Effect of Novel Single-Stranded RNAi Agent Targeting Periostin in Eyes with Retinal Neovascularization. Molecular therapy Nucleic acids. 2017;6:279-89
27. Zhou Y, Yoshida S, Nakao S, Yoshimura T, Kobayashi Y, Nakama T. et al. M2 Macrophages Enhance Pathological Neovascularization in the Mouse Model of Oxygen-Induced Retinopathy. Invest Ophthalmol Vis Sci. 2015;56:4767-77
28. Xu XD, Li KR, Li XM, Yao J, Qin J, Yan B. Long non-coding RNAs: new players in ocular neovascularization. Mol Biol Rep. 2014;41:4493-505
29. Langer HF, Chung KJ, Orlova VV, Choi EY, Kaul S, Kruhlak MJ. et al. Complement-mediated inhibition of neovascularization reveals a point of convergence between innate immunity and angiogenesis. Blood. 2010;116:4395-403
30. Zhou YD, Yoshida S, Peng YQ, Kobayashi Y, Zhang LS, Tang LS. Diverse roles of macrophages in intraocular neovascular diseases: a review. Int J Ophthalmol-Chi. 2017;10:1902-8
31. Dong A, Shen J, Zeng M, Campochiaro PA. Vascular cell-adhesion molecule-1 plays a central role in the proangiogenic effects of oxidative stress. Proc Natl Acad Sci U S A. 2011;108:14614-9
32. Byfield G, Budd S, Hartnett ME. The role of supplemental oxygen and JAK/STAT signaling in intravitreous neovascularization in a ROP rat model. Invest Ophthalmol Vis Sci. 2009;50:3360-5
33. Hartnett ME. The effects of oxygen stresses on the development of features of severe retinopathy of prematurity: knowledge from the 50/10 OIR model. Doc Ophthalmol. 2010;120:25-39
34. Bishop PN. The role of extracellular matrix in retinal vascular development and preretinal neovascularization. Exp Eye Res. 2015;133:30-6
35. Campochiaro PA. Molecular targets for retinal vascular diseases. J Cell Physiol. 2007;210:575-81
36. Zhuang Z, Xiao q, Hu H, Tian SY, Lu ZJ, Zhang TZ. et al. Down-regulation of microRNA-155 attenuates retinal neovascularization via the PI3K/Akt pathway. Mol Vis. 2015;21:1173-84
37. You JJ, Yang CH, Yang CM, Chen MS. Cyr61 induces the expression of monocyte chemoattractant protein-1 via the integrin alphanubeta3, FAK, PI3K/Akt, and NF-kappaB pathways in retinal vascular endothelial cells. Cell Signal. 2014;26:133-40
38. Mirshahi A, Hoehn R, Lorenz K, Kramann C, Baatz H. Anti-tumor necrosis factor alpha for retinal diseases: current knowledge and future concepts. J Ophthalmic Vis Res. 2012;7:39-44
39. Alavi MV, Mao M, Pawlikowski BT, Kvezereli M, Duncan JL, Libby RT. et al. Col4a1 mutations cause progressive retinal neovascular defects and retinopathy. Sci Rep. 2016;6:18602
40. Coupry I, Sibon I, Mortemousque B, Rouanet F, Mine M, Goizet C. Ophthalmological features associated with COL4A1 mutations. Arch Ophthalmol. 2010;128:483-9
41. Kuo DS, Labelle-Dumais C, Gould DB. COL4A1 and COL4A2 mutations and disease: insights into pathogenic mechanisms and potential therapeutic targets. Hum Mol Genet. 2012;21:R97-110
42. Li D, Xie K, Zhang L, Yao X, Li H, Xu Q. et al. Dual blockade of vascular endothelial growth factor (VEGF) and basic fibroblast growth factor (FGF-2) exhibits potent anti-angiogenic effects. Cancer Lett. 2016;377:164-73
43. Fang L, Barber AJ, Shenberger JS. Regulation of fibroblast growth factor 2 expression in oxygen-induced retinopathy. Invest Ophthalmol Vis Sci. 2014;56:207-15
44. Shih SC, Ju M, Liu N, Mo JR, Ney JJ, Smith LE. Transforming growth factor beta1 induction of vascular endothelial growth factor receptor 1: mechanism of pericyte-induced vascular survival in vivo. Proc Natl Acad Sci U S A. 2003;100:15859-64
45. Yingchuan F, Chuntao L, Hui C, Jianbin H. Increased expression of TGF-beta1 and Smad 4 on oxygen-induced retinopathy in neonatal mice. Adv Exp Med Biol. 2010;664:71-7
46. Ishida S, Yamashiro K, Usui T, Kaji Y, Ogura Y, Hida T. et al. Leukocytes mediate retinal vascular remodeling during development and vaso-obliteration in disease. Nat Med. 2003;9:781-8
Author contact
![]() Corresponding author: Yedi Zhou, MD, PhD, Department of Ophthalmology, The Second Xiangya Hospital, Central South University, Changsha, Hunan 410011, China. Telephone: +86-731-85292175; E-mail: zhouyediedu.cn
Corresponding author: Yedi Zhou, MD, PhD, Department of Ophthalmology, The Second Xiangya Hospital, Central South University, Changsha, Hunan 410011, China. Telephone: +86-731-85292175; E-mail: zhouyediedu.cn