Impact Factor ISSN: 1449-1907

 Global reach, higher impact
Int J Med Sci 2019; 16(1):93-105. doi:10.7150/ijms.29560 This issue Cite
Research Paper
Deduction of Novel Genes Potentially Involved in Upper Tract Urothelial Carcinoma Using Next-Generation Sequencing and Bioinformatics Approaches
Hsiang-Ying Lee1,2,3*, Yi-Jen Chen1,4*, Ching-Chia Li2,3,5,6, Wei-Ming Li3,5,6,7, Ya-Ling Hsu6, Hsin-Chih Yeh2,3,5,6, Hung-Lung Ke3,5,6, Chun-Nung Huang2,3,5,6, Chien-Feng Li8, Wen-Jeng Wu2,3,5,6 ![]() , Po-Lin Kuo1,9,10
, Po-Lin Kuo1,9,10 ![]()
1. Graduate Institute of Clinical Medicine, College of Medicine, Kaohsiung Medical University, Kaohsiung, Taiwan
2. Department of Urology, Kaohsiung Municipal Ta-Tung Hospital, Kaohsiung, Taiwan
3. Department of Urology, Kaohsiung Medical University Hospital, Kaohsiung, Taiwan
4. Department of Physical Medicine and Rehabilitation, Kaohsiung Medical University Hospital, Kaohsiung, Taiwan
5. Department of Urology, School of Medicine, College of Medicine, Kaohsiung Medical University, Kaohsiung, Taiwan
6. Graduate Institute of Medicine, College of Medicine, Kaohsiung Medical University, Kaohsiung, Taiwan
7. Department of Urology, Ministry of Health and Welfare Pingtung Hospital, Pingtung, Taiwan
8. Department of Pathology, Chi Mei Medical Center, Tainan, Taiwan
9. Center for Infectious Disease and Cancer Research, Kaohsiung Medical University, Kaohsiung 807, Taiwan
10. Institute of Medical Science and Technology, National Sun Yat-Sen University, Kaohsiung, Taiwan
*Hsiang-Ying Lee and Yi-Jen Chen contributed equally to this work
Received 2018-8-28; Accepted 2018-10-31; Published 2019-1-1
Abstract
Upper tract urothelial carcinoma (UTUC) is a relatively uncommon cancer worldwide, however it accounts for approximately 30% of urothelial cancer in the Taiwanese population. The aim of the current study is to identify differential molecular signatures and novel miRNA regulations in UTUC, using next-generation sequencing and bioinformatics approaches. Two pairs of UTUC tumor and non-tumor tissues were collected during surgical resection, and RNAs extracted for deep sequencing. There were 317 differentially expressed genes identified in UTUC tissues, and the systematic bioinformatics analyses indicated dysregulated genes were enriched in biological processes related to aberration in cell cycle and matrisome-related genes. Additionally, 15 candidate genes with potential miRNA-mRNA interactions were identified. Using the clinical outcome prediction database, low expression of SLIT3 was found to be a prognostic predictor of poor survival in urothelial cancer, and a novel miRNA, miR-34a-5p, was a potential regulator of SLIT3, which may infer the potential role of miR-34a-5p-SLIT3 regulation in the altered tumor microenvironment in UTUC. Our findings suggested novel miRNA target with SLIT3 regulation exerts potential prognostic value in UTUC, and future investigation is necessary to explore the role of SLIT3 in the tumor development and progression of UTUC.
Keywords: upper tract urothelial carcinoma, cell cycle, matrisome, next-generation sequencing, bioinformatics
Introduction
Urothelial carcinoma (UC), arising from the urothelium of the urinary tract, including bladder, ureter and renal pelvis, is the most common cancer among genitourinary tract cancer types. Common risk factors of UC include cigarette smoking and exposure to aristolochic acid and arsenic [1,2]. Patients with chronic kidney disease and end-stage renal disease also have higher incidence of UC in the Taiwanese population [3-5]. According to the anatomical location of tumor, UC can be classified into lower tract UC and upper tract UC (UTUC). The differences in clinical, demographic and molecular features between bladder UC and UTUC have been reported. For instance, UTUC tends to have higher stage and grade than bladder UC due to thinner smooth muscle layer in the renal pelvis, and certain risk factors have larger impact on UTUC than on bladder UC [6,7]. Worldwide, bladder UC accounts for most of the UC, while UTUC is approximately 5%, and 2/3 of the UTUC occur in the renal pelvis [8]. In the Taiwanese population, however, UTUC accounts for approximately 30% of UC, and a slight female predominance was reported, differing from that reported in the Western countries [7-9]. The distinct epidemiology suggests potential endemic and molecular characteristics among our UTUC population.
Although studies suggest that UTUC shares many similarities with bladder UC, and similar genetic alterations regarding cell cycle and proliferative tissue markers have been reported [10,11], distinct genetic and epigenetic differences and mutation frequencies between UTUC and bladder UC exist [12-14]. Other than clinical and pathological characteristics, the prognostic value of tissue-based molecular biomarkers in UTUC has evolved rapidly [15]. In addition to alteration in tumor cell genetics, the critical roles of non-tumor cells, adjacent stroma, extracellular matrix (ECM) and altered tumor microenvironment (TME) have gained much attention [16-19]. The emerging biomarkers and novel therapeutic targets shed light on the advance in cancer treatment and importance of precision oncology [20].
Taking into account the distinct genetic and epigenetic differences in UTUC, recent progress in high-throughput next-generation sequencing (NGS) of the whole genome can achieve good resolution in characterization of genome-wide variations and facilitate the advance of precision oncology [21]. The rapidly progressing NGS technologies and development of powerful bioinformatics tools has made large genomic studies and the discovery of novel oncotargets more feasible [22]. In the current study, we aimed to investigate the distinct molecular signatures and novel miRNA regulations in UTUC, combining the NGS technique and bioinformatics approaches. We hope to identify novel targets of clinical significance and potential prognostic value in patients with UTUC.
Materials and Methods
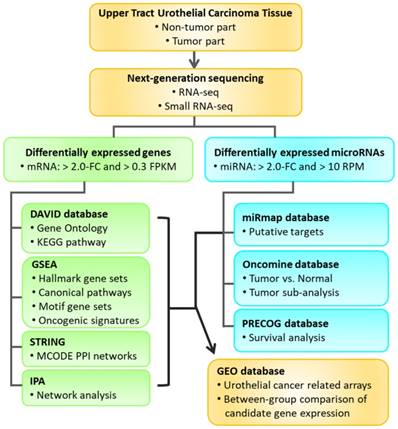
The aim of our current study was to identify differentially expressed genes between tumor part and non-tumor part of UTUC clinical specimen through deep sequencing and identify novel microRNAs potentially involved in UTUC through bioinformatics approaches. The study flowchart is illustrated in Figure 1.
Flowchart of study design. Clinical specimens were obtained from two patients of upper urinary tract urothelial carcinoma (UTUC) for RNA and small RNA deep sequencing. The differentially expressed genes between tumor and non-tumor tissues were selected for enrichment analyses using various bioinforatmics databases. Furthermore, putative targets of selected differentially expressed microRNAs were predicted by miRmap database. The expression pattern and outcome prediction of candidate genes were analyzed using Oncomine database and Prediction of Clinical Outcomes from Genomic Profiles (PRECOG) database. Candidate genes with significant prognostic prediction were then validated in related urothelial carcinoma arrays in the Gene Expression Omnibus (GEO) database.
Clinical specimen
The two pairs of tumor and non-tumor tissue specimens were obtained from two female patients with renal pelvis UC during surgical resection. The specimens were collected within 30 minutes after radical dissection, and immediately stored in liquid nitrogen container to ensure the quality of tissue preservation. The detailed clinical background of the two patients was listed in Table 1. The study was approved by the Institutional Review Board of our hospital (KMUHIRB-E(I)-20170018).
The clinical background of two patients with upper tract urothelial carcinoma
| Patient 1 | Patient 2 | ||
|---|---|---|---|
| Gender | Female | Female | |
| Age | 67 | 76 | |
| Tumor site | Renal pelvis | Renal pelvis | |
| Laterality | Left | Left | |
| Tumor grading | high | high | |
| Pathology T stage | T3 | T1 | |
| N stage | N0 | N0 | |
| M stage | M0 | M0 | |
| Lymphovascular invasion | No | No | |
| Perineural invasion | No | No | |
RNA sequencing and expression profiling
Total RNAs of UTUC tumor part and non-tumor part tissues were extracted using Trizol® Reagent (Invitrogen, Carlsbad, CA, USA), and checked for the quality of extracted RNAs by measuring OD260/OD280 absorbance ratio with the ND-1000 spectrophotometer (Nanodrop Technology, Wilmington, DE, USA) and quantifying RNA integrity number with Agilent Bioanalyzer (Agilent Technology, Santa Clara, CA, USA). The extracted RNA samples were prepared for RNA and small RNA sequencing by Welgene Biotechnology Company (Welgene, Taipei, Taiwan), using the Solexa platform, with single-end sequencing method of 75 nucleotides read length. The raw sequences were trimmed for qualified reads, and performed gene expression estimation using TopHat/ Cufflinks method. Differentially expressed mRNAs were indicated by > 2.0-fold change between tumor and non-tumor tissues, and fragments per kilobase of transcript per million (FPKM) > 0.3, whereas differentially expressed miRNAs were indicated by > 2.0-fold change and reads per million (RPM) > 10 for miRNA, representing functional miRNAs [23].
Database for Annotation, Visualization and Integrated Discovery (DAVID) Bioinformatics Resources
Database for Annotation, Visualization and Integrated Discovery (DAVID) is one of the bioinformatics enrichment tools that integrates large public bioinformatics resources and provides powerful tools for enrichment analysis of large gene lists from genomic experiments or sequencing results. Through multiple pathway-mining tools within the database, researchers gain a general concept of the biological themes and concentrated biological networks among the gene list of interest [24]. The DAVID Bioinformatics Resources 6.8 version was used for enrichment analysis in this study.
Gene Set Enrichment Analysis (GSEA)
The Gene Set Enrichment Analysis (GSEA) tool extracts relevant biological functions of a given gene list through a computational method that determines if a pre-defined gene set of genes shows statistically significant difference between two states, such as tumor and non-tumor phenotypes, instead of single-gene analysis. A gene set is a group of genes that share common biological function or regulation. The GSEA also provides leading-edge subset analysis, which extracts a subset of genes in a gene set as the core that contributes mainly to the enrichment signal [25]. The GSEA Desktop v3.0 was used for analysis in this study.
Ingenuity Pathway Analysis (IPA)
The Ingenuity Pathway Analysis (IPA) software (Ingenuity Systems Inc., Redwood City, CA, USA) provides search function and network building/ analysis of an uploaded data. In the “Core Analysis” result, IPA generates unique networks based on the highest-fold change in the uploaded data. A network of interest can be graphed and overlaid for canonical pathways or specific diseases and functions selected [26]. The upstream regulator analysis is also available, which identifies molecules upstream of the genes in a given data that potentially explain the altered gene expression [27].
MiRmap Database
The miRmap software library is an open-resource for the target prediction of a specific miRNA, and the repression strength of a miRNA target is indicated by the miRmap score, which was estimated through a comprehensive computational method. A higher miRmap score indicates higher repression strength [28]. In the current study, miRNA targets with miRmap scores ≥ 99.0 were selected for further analysis.
Oncomine Database
The Oncomine platform integrates more than 700 independent datasets, expert curated data, and standardized analysis. Users can select differential expression analysis for automatically computed differential expression profiles of a selected cancer type or subtype of interest. Raw data including clinical information of selected datasets can be extracted for further analysis [29]. Differential expression analysis results of the candidate genes in urothelial carcinoma and transitional cell carcinoma of bladder and renal pelvis origins were extracted in this study.
Prediction of Clinical Outcomes from Genomic Profiles (PRECOG)
PRECOG is a new resource integrating cancer gene expression profiles and clinical outcome data from public database. It contains approximately 30,000 expression profiles from various cancer expression datasets, and all data were curated according to related clinical parameters [30].
Gene Expression Omnibus (GEO)
The Gene Expression Omnibus (GEO) database is a publicly available resource created since 2000 that accumulates free-access high-throughput genomic datasets. A web-based tool with graphic gene expression and raw data extraction of the candidate gene for statistical analysis is also available [31,32]. Other than datasets available from the Oncomine database, urothelial carcinoma related arrays were searched in the GEO database, and a dataset (GSE32894) containing 308 bladder cancer samples of different stages and grades was selected for candidate gene analysis in this study.
Statistical Analysis
The between-group expression difference of candidate genes obtained from selected arrays of Oncomine and GEO databases were analyzed using student's t test or one-way ANOVA with Tukey test for post-hoc analysis. The IBM SPSS Statistics for Windows, version 19 (IBM Corp., Armonk, NY, USA) was used for statistical analysis. A p-value < 0.05 was determined as statistically significant between-group difference.
Results
Identification of differentially expressed genes in UTUC
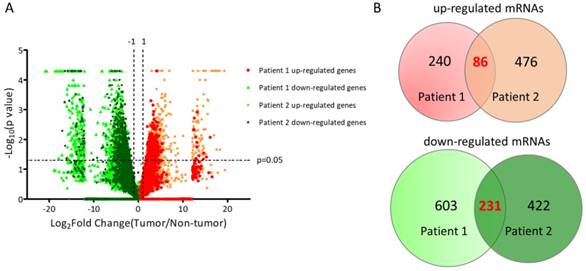
The sequencing results of differential expression pattern of the two UTUC specimen was plotted in Figure 2A. There were 326 significantly up-regulated genes and 834 significantly down-regulated genes in tumor part tissue of UTUC specimen from patient 1. In addition, 562 significantly up-regulated genes and 653 significantly down-regulated genes in tumor part tissue of UTUC specimen from patient 2 were identified. By overlapping these dysregulated genes from two pairs of clinical UTUC specimens, we identified 86 up-regulated genes and 231 down-regulated genes in tumor part tissues of UTUC patients (Figure 2B).
Plotting of differential expression patterns between UTUC tumor and non-tumor tissues from deep sequencing. (A) The differential gene expression between UTUC tumor and non-tumor tissues from two UTUC patients were plotted by volcano plot. The x-axis represented the expression fold-change (tumor/non-tumor) in log2 transformation and the y-axis represented the p-value in negative log10 transformation. Markers in green indicated down-regulated genes, whereas markers in red and orange indicated up-regulated genes in UTUC tumor tissues. (B) The Venn diagram analysis of dysregulated genes from two pairs of UTUC tissues identified 86 up-regulated genes and 231 down-regulated genes in UTUC tumor tissues.
The differentially expressed genes were involved in extracellular matrix organization and cell cycle related biological functions
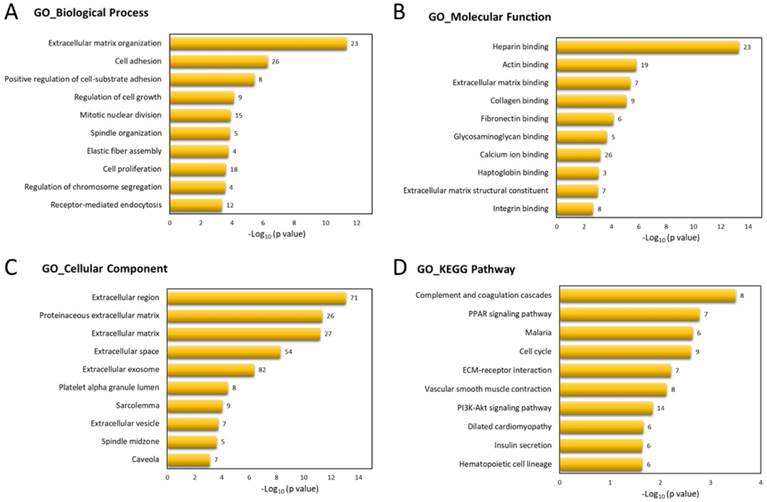
To determine the biological functions involved in these 317 differentially expressed genes of UTUC specimen, these genes were uploaded into DAVID database for Gene Ontology (GO) and Kyoto Encyclopedia of Genes and Genomes (KEGG) pathways analysis. The top 10 GO and KEGG terms were shown in Figure 3, indicating the involvement of dysregulated genes in ECM organization, cell adhesion, and cell cycle pathways.
Functional enrichment analysis of differentially expressed genes by DAVID database. The top 10 Gene Ontology (GO) in (A) biological process, (B) molecular function, and (C) cellular component, and (D) Kyoto Encyclopedia of Genes and Genomes (KEGG) pathways enriched in dysregulated genes of UTUC tumor tissues were displayed in bar chart. The bars indicated p-value in negative logarithm to the base 10 for each GO and KEGG term, and the numbers to the right side of each bar indicated the number of genes involved in each term.
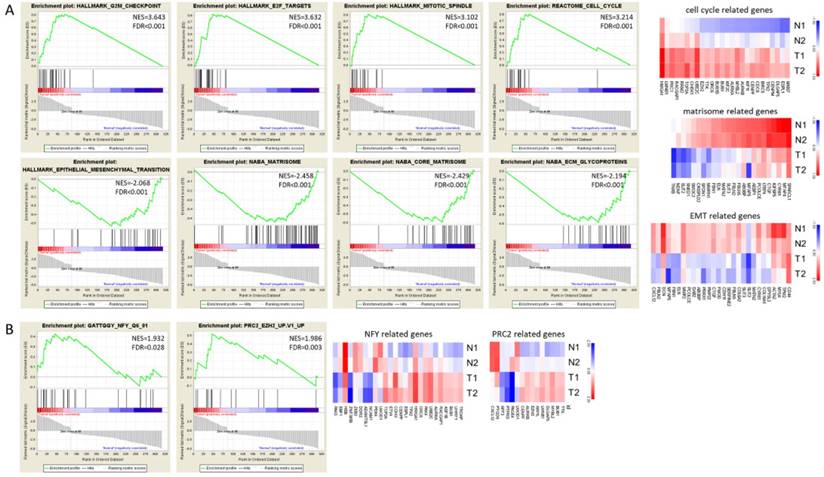
The GSEA enrichment analysis was also performed for gene sets of hallmarks, canonical pathways, motif and oncogenic signatures. The gene sets enriched in UTUC tumor tissues included G2M checkpoint, E2F targets, mitotic spindle and cell cycle canonical pathway (Figure 4A upper panel), whereas matrisome and ECM glycoprotein related canonical pathways and epithelial mesenchymal transition gene sets were enriched in UTUC non-tumor tissues (Figure 4A lower panel). The expressions of genes in related gene sets were displayed as heat maps in Figure 4A. Additionally, the motif gene set analysis indicated nuclear factor Y (NFY) as transcriptional factor targeting the dysregulated genes in UTUC tumor tissues, and the oncogenic signature gene set analysis indicated the representative gene signatures in polycomb repressive complex 2 (PRC2)/enhancer of zeste homolog 2 (EZH2) (Figure 4B).
The Gene Set Enrichment Analysis (GSEA) result of differentially expressed genes. The 317 differentially expressed genes of UTUC tissue underwent GSEA enrichment analysis. The gene sets used included h.all.v6.2.symbols.gmt [Hallmarks], c2.cp.v6.2.symbols.gmt [canonical pathways], c3.all.v6.2.symbols.gmt [motif], and c6.all.v6.2.symbols.gmt [oncogenic signatures] gene sets. GSEA performed 1000 permutations. The maximum and minimum sizes for gene sets were 500 and 15, respectively. Cutoff for significant gene sets was false discovery rate < 25%.
Identification of candidate genes with potential miRNA regulations in UTUC
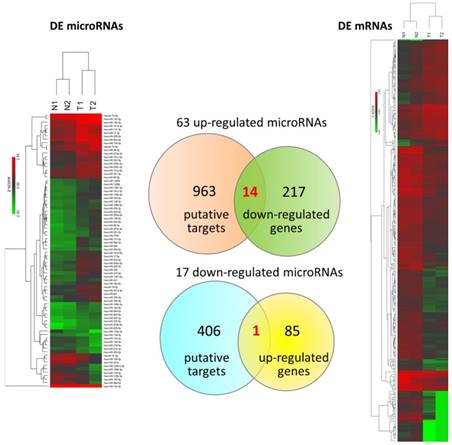
To explore differentially expressed miRNAs and candidate genes potentially involved in miRNA regulations, small RNA sequencing was simultaneously performed. There were total 80 dysregulated miRNAs identified. The putative targets of these 80 differentially expressed miRNAs with miRmap score ≥ 99.0 were obtained from miRmap database. The overlapping genes between miRNA putative targets and differentially expressed genes of our dataset were achieved by Venn diagram analysis. The heat maps with z-scores of the differentially expressed miRNAs and mRNAs along with Venn diagram were illustrated in Figure 5. A total of 14 down-regulated genes and 1 up-regulated gene were identified as potentially involved in miRNA regulations. The expression values and fold-changes of these 15 candidate genes in the two pairs of UTUC specimens were listed in Table 2.
Differentially expressed microRNAs and mRNAs with potential microRNA-mRNA interactions identified in UTUC. The heat maps with hierarchical clustering of differentially expressed microRNAs and mRNAs in UTUC are shown on the left and right panels, respectively. Putative targets of differentially expressed microRNAs were predicted using miRmap database, setting the repression score at ≥ 99.0. The candidate genes were those overlapping with differentially expressed mRNAs in UTUC, as shown in Venn diagram on the middle panel.
Target genes with potential microRNA regulations in upper tract urothelial carcinoma
| Patient 1 | Patient 2 | |||||||
|---|---|---|---|---|---|---|---|---|
| Gene symbol | Gene name | Non-tumor FPKM | Tumor FPKM | Fold Change | Non-tumor FPKM | Tumor FPKM | Fold Change | |
| PVRL1 | poliovirus receptor-related 1 | 10.84 | 51.20 | 4.72 | 23.40 | 150.45 | 6.43 | |
| ASXL3 | additional sex combs like 3, transcriptional regulator | 1.10 | 0.05 | -21.07 | 0.46 | 0.004 | -110.82 | |
| CYBRD1 | cytochrome b reductase 1 | 114.84 | 23.08 | -4.98 | 88.76 | 5.06 | -17.55 | |
| DIXDC1 | DIX domain containing 1 | 43.00 | 4.95 | -8.68 | 12.13 | 1.23 | -9.87 | |
| FAM107A | family with sequence similarity 107 member A | 24.12 | 1.18 | -20.37 | 18.29 | 0.53 | -34.50 | |
| IGFBP5 | insulin like growth factor binding protein 5 | 216.17 | 24.64 | -8.77 | 172.50 | 2.70 | -63.92 | |
| LMOD1 | leiomodin 1 (smooth muscle) | 128.66 | 5.44 | -23.66 | 17.59 | 0.73 | -24.09 | |
| MRO | maestro | 3.82 | 0.33 | -11.46 | 3.22 | 0.20 | -16.31 | |
| NCALD | neurocalcin delta | 17.63 | 1.59 | -11.11 | 4.56 | 0.65 | -6.97 | |
| PDE5A | phosphodiesterase 5A | 38.05 | 3.24 | -11.74 | 15.83 | 2.73 | -5.81 | |
| PLCXD3 | phosphatidylinositol-specific phospholipase C, X domain containing 3 | 4.46 | 0.55 | -8.12 | 4.98 | 0.14 | -36.44 | |
| RECK | reversion-inducing-cysteine-rich protein with kazal motifs | 7.03 | 0.72 | -9.80 | 5.04 | 0.22 | -23.02 | |
| SLIT3 | slit guidance ligand 3 | 62.92 | 3.34 | -18.83 | 35.78 | 2.77 | -12.92 | |
| TNS1 | tensin 1 | 146.92 | 15.50 | -9.48 | 36.20 | 6.16 | -5.87 | |
| ZEB2 | zinc finger E-box binding homeobox 2 | 74.86 | 9.63 | -7.77 | 56.72 | 4.47 | -12.70 | |
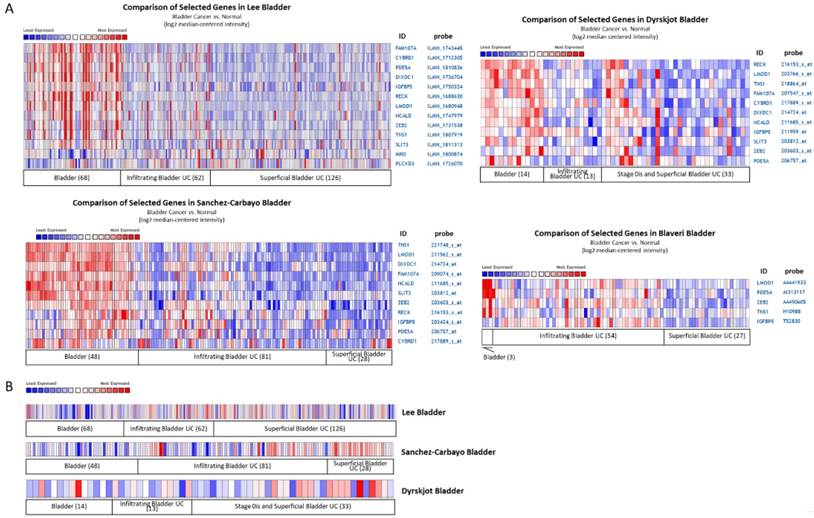
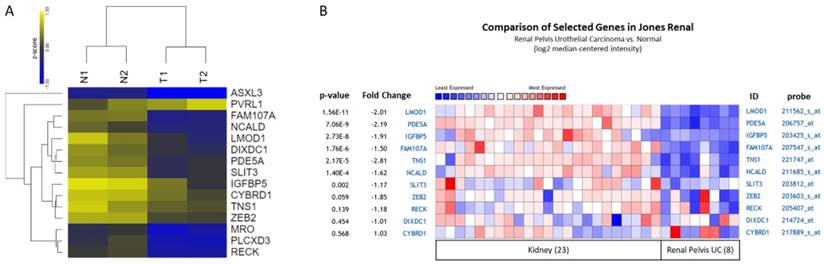
Four datasets from Oncomine database containing specimens of normal bladder tissue and bladder UC tissue were selected for comparison of candidate gene expression patterns, including Lee, Dyrskjøt, Sanchez-Carbayo, and Blaveri datasets. The heat maps of these genes in each dataset were illustrated in Figure 6, indicating the similar molecular changes among different bladder cancer datasets. Additionally, searching for the histological term of transitional cell carcinoma for UC, a dataset (Jones renal dataset) containing 23 normal kidney tissues and 8 renal pelvis UC tissues was achieved. We therefore also compared the expression pattern of the candidate genes in this dataset. The heat maps of the candidate genes of our UTUC data and Jones renal dataset were shown in Figure 7. The Oncomine database analysis identified significantly down-regulated genes, including LMOD1, PDE5A, IGFBP5, FAM107A, TNS1, NCALD, and SLIT3 (p value < 0.05) in the Jones renal dataset of renal pelvis UC, indicating the coinciding novel molecular signatures between bladder UC and UTUC.
Expression patterns of candidate genes with potential microRNA-mRNA interactions in bladder urothelial carcinoma datasets. The expression patterns of (A) 14 down-regulated and (B) 1 up-regulated candidate genes were assessed in the Oncomine database for related urothelial carcinoma datasets. Numbers of specimen in each group were indicated. The results of heatmap analysis were extracted from Oncomine database, with relative color scale indicating log2 median-centered relative expression intensity. Red color represented high expression, and blue color represented low expression. The gene symbols with corresponding probes were indicated on the right side of each row.
Expression patterns of candidate genes with potential microRNA-mRNA interactions in UTUC datasets. (A) The heatmap with log2 transformed z-score and hierarchical clustering of 15 candidate genes in two pairs of UTUC tissues. Yellow color indicated increased expression, and blue color indicated decreased expression. (B) The expression patterns of candidate genes were assessed in renal pelvis urothelial carcinoma dataset. The result of heatmap analysis was extracted from Oncomine database, with relative color scale indicating log2 median-centered relative expression intensity. Red color represented high expression, and blue color represented low expression. The gene symbols with corresponding probes were indicated on the right side of each row. The p-values and fold-changes of each gene were indicated on the left side of each row.
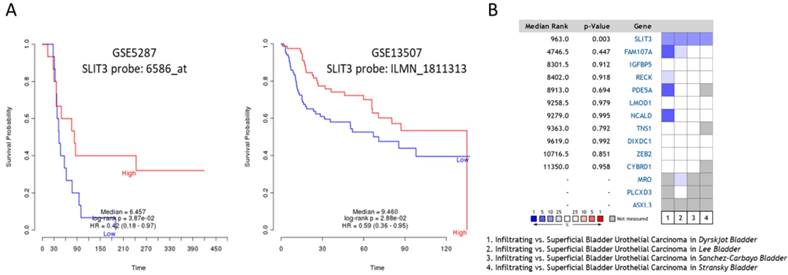
SLIT3 as a potential prognostic biomarker in UTUC
To predict the prognostic value of these candidate genes, the PRECOG database was used to determine the meta-Z score of each of the following genes: LMOD1, PDE5A, IGFBP5, FAM107A, TNS1, NCALD, and SLIT3. The higher meta-Z scores were observed in SLIT3 (meta-Z score = -2.47) and FAM107A (meta-Z score = -1.24) for bladder cancer, and no data available for UTUC in the database. The Kaplan-Meier plots for SLIT3 expression in two datasets (GSE5287 and GSE13507) were extracted from the PRECOG database, as displayed in Figure 8A, indicating lower survival probability in bladder UC patients with low SLIT3 expression. The expression pattern of SLIT3 between superficial and infiltrating bladder UC in Oncomine database was further investigated. There were four datasets comparing the expression pattern of SLIT3 between superficial and infiltrating bladder UC available, including Lee, Dyrskjøt, Sanchez-Carbayo, and Stransky (superficial bladder UC=25, infiltrating bladder UC=32). The results indicated higher ranking of SLIT3 under-expression in infiltrating bladder UC across each dataset (Figure 8B).
Outcome prediction and expression pattern of SLIT3 among urothelial carcinoma datasets. (A) The Prediction of Clinical Outcomes from Genomic Profiles (PRECOG) database was used for outcome prediction of candidate genes. Urothelial carcinoma patients with higher expression of SLIT3 had better survival rate. (B) Comparison between infiltrating and superficial urothelial carcinoma among four bladder cancer datasets from Oncomine database revealed higher ranking of SLIT3 under-expression in infiltrating type across each dataset. The heatmap analysis result was extracted from Oncomine database. The rank for a gene indicated the median rank for that gene across each analysis. The p-value for a specific gene indicated p-value for the median-ranked analysis. Red color represented ranking of over-expression genes, and blue color represented ranking of under-expression genes.
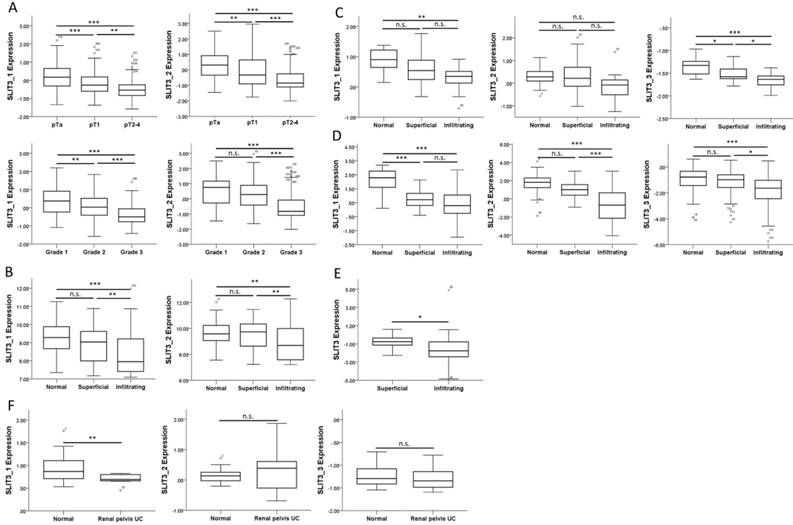
We also searched in the GEO database for related UC arrays, and a bladder cancer array (GSE32894) containing 308 samples was selected for analysis of SLIT3 expression among different tumor stages and tumor grades. The expressions of SLIT3 were significantly lower in higher stages (Figure 9A, upper panel) and grades (Figure 9A, lower panel). The expression pattern of SLIT3 in the four datasets from Oncomine database also revealed lower expression of SLIT3 in infiltrating UC than in superficial UC (Figure 9, B-E). The expression level of SLIT3 was also lower in renal pelvis UC than in normal kidney tissue (Figure 9F).
Expression pattern of SLIT3 among different stages of urothelial carcinoma. (A) The expression value of SLIT3 among different tumor stage and tumor grading in a bladder cancer dataset (GSE32894) was lower in advanced stage and grade. Similar expression pattern of SLIT3 was observed in (B) Lee, (C) Dyrskjot, (D) Sanchez-Carbayo, and (E) Stransky (SLIT3 probe: 35324_at) bladder cancer datasets, and (F) Jones renal pelvis urothelial carcinoma dataset. (probe information: SLIT3_1: ILMN_1864685; SLIT3_2: ILMN_1811313 for (A), (B); SLIT3_1: 203812_at; SLIT3_2: 203813_s_at; SLIT3_3: 216216_at for (C), (D), (F)).
SLIT3 participates in cancer, renal and urological disease
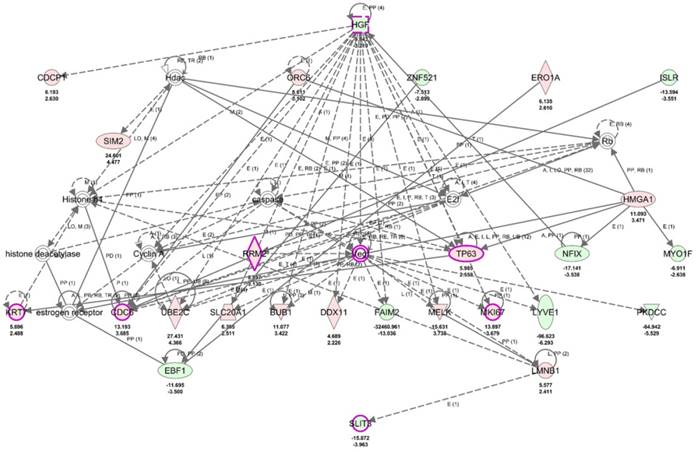
To clarify the role of SLIT3 in dysregulated genes of UTUC, the 317 differentially expressed genes in UTUC were uploaded into IPA software for core analysis. The top three networks associated with differentially expressed genes in UTUC were listed in Table 3, where SLIT3 was clustered in network 1 related to diseases and functions of “Cancer, Organismal Injury and Abnormalities, Renal and Urological Disease”. The hierarchical layout of network 1 was shown in Figure 10, with SLIT3 interconnecting to LMNB1. The overlay disease and function tool in IPA indicated the involvement of HGF, RRM2, TP63, KRT7, CDC6, MKI67, and SLIT3 in UC.
Top networks associated with differentially expressed genes and 15 candidate genes in upper tract urothelial carcinoma
| Top diseases and functions | Score | Focus molecules | Molecules in network | |
|---|---|---|---|---|
| 1 | Cancer, Organismal Injury and Abnormalities, Renal and Urological Disease | 44 | 26 | ↑BUB1, caspase, ↑CDC6, ↑CDCP1, Cyclin A, ↑DDX11, E2f, ↓EBF1, ↑ERO1A, estrogen receptor, ↓FAIM2, Hdac, ↓HGF, histone deacetylase, Histone h4, ↑HMGA1, ↓ISLR, ↑KRT7, ↑LMNB1, ↓LYVE1, ↑MELK, ↑MKI67, ↓MYO1F, ↓NFIX, ↑ORC6, ↓PKDCC, Rb, ↑RRM2, ↑SIM2, ↑SLC20A1, ↓SLIT3, ↑TP63, ↑UBE2C, Vegf, ↓ZNF521 |
| 2 | Cancer, Organismal Injury and Abnormalities, Reproductive System Disease | 40 | 24 | Atrial Natriuretic Peptide, ↓CCDC80, ↓CD248, ↓CFD, ↓CORIN, ↑CRYBG2, ENaC, ↓FHL1, ↓FMO1, ↓GPD1, ↓HLF, ↑IGF2BP3, ↓IGFBP5, LRP, ↑MYBL2, ↓MYOZ3, ↓NCAM1, Ngf, Pdgf Ab, ↓PDGF BB, ↓PDLIM3, PI3K (complex), PLC gamma, ↑PRSS8, ↑PRSS22, ↓PTN, Rap1, ↓RASGRP2, ↓RTN1, ↑SCNN1A, Serine Protease, ↓SERPINE2, ↓SLIT2, ↓TPSD1, VAV |
| 3 | Cell Morphology, Cell-To-Cell Signaling and Interaction, Cellular Assembly and Organization | 39 | 24 | ↓ACTA2, ↓ACTG2, Actin, ↓ADAM33, Alpha catenin, ↓CAVIN1, ↓CAVIN2, ↑CENPM, ↓CNN1, ↓CRYM, ↓DMD, ↓DTNA, Erm, ↑ESPN, F Actin, ↓FAM107A, Il8r, ↑KIF11, Ldh (complex), ↑LSR, ↓MAOB, ↓NCALD, ↓PDE5A, ↓PF4, ↓PGM5, Pkc(s), PP2A, ↓RNF150, Rock, ↑SLC1A6, Smad2/3, ↓SNTG2, ↓SORBS1, Spectrin, ↑SPTBN2 |
The role of SLIT3 among differentially expressed genes in UTUC. The top network of differentially expressed genes in UTUC tissues derived from IPA database indicated the involvement of SLIT3 in cancer, renal and urological disease, interconnected to LMNB1. Molecules indicated in purple frame (HGF, RRM2, TP63, KRT7, CDC6, MKI67, SLIT3) were associated with urothelial carcinoma. Red color indicated up-regulated genes, and green color indicated down-regulated genes. The average expression value in fold-change and log2 fold-change of each molecule was displayed in the network graphic.
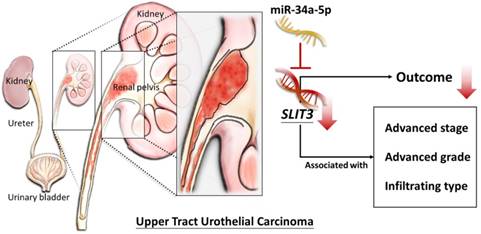
Potential miR-34a-5p regulation of SLIT3 in UTUC
The target gene SLIT3 was input into miRmap database for potential miRNA prediction. The miRmap score was set at ≥ 99.0 to obtain predicted miRNA regulation, and there were 72 potential miRNA regulations for SLIT3. Matching to the 63 up-regulated miRNAs in our UTUC dataset, the up-regulated miR-34a-5p potentially regulating SLIT3 expression was identified, with miRmap score of 99.09. Coinciding to the upstream regulator analysis for 15 candidate genes in the IPA, miR-34a-5p was one of the top upstream regulators potentially regulating downstream effectors including PVRL1, DIXDC1, SLIT3, CYBRD1, RECK, FAM107A, and PLCXD3 (z-score = 1.890, overlap p-value = 6.53 x 10⁻⁵).
Discussion
The current study identified the differentially expressed genes in UTUC tissues were associated with aberration in cell cycle and ECM-related genes, analyzed by systematic bioinformatics approach. In addition, low tissue expression of SLIT3 in invasive UC was potentially a prognostic predictor of poor survival rate. Among the 15 candidate genes with potential miRNA-mRNA interactions, novel miR-34a-5p was a potential regulator of SLIT3, which may infer the potential role of miR-34a-5p-SLIT3 regulation in the altered TME in UC. A schematic figure summarizing the proposed molecular signatures of UTUC is displayed in Figure 11.
Schematic summary of the proposed molecular signatures in UTUC.
Alteration in cell cycle checkpoint pathways increases the risk of carcinogenesis [33]. The characteristic feature of mature urothelium is quiescent with low mitotic index and turnover rate, and the homeostasis of urothelial cell regeneration upon injury relies on epithelial-mesenchymal crosstalk, local secreted growth factors, and epigenetic regulation [34]. Similar molecular signatures of cell cycle and proliferative tissue markers between UC of bladder and upper urinary tract origin has been reported, and Ki-67, pRb, p53, and CDCA5 are of prognostic values [10,15,35-38]. Using DAVID and GSEA for pathway enrichment analysis, MKI67, a gene encoding nuclear protein Ki-67, was identified as one of the top dysregulated genes related to cell proliferation and cell cycle checkpoint pathways in our UTUC dataset. In addition, enrichment in transcription factor NFY related genes was also identified in our UTUC dataset. NFY is a key regulator of cell proliferation, transcribing cell cycle regulatory genes, and the NFY targets are up-regulated in various cancer types [39].
A closer look into the dysregulated genes related to cell cycle checkpoint pathways, LMNB1 molecule was consistently involved, and identified in IPA database to be interconnected to SLIT3 (Figure 10). Amodeo et al. reported promyelocytic leukemia protein controls cell migration via PRC2-mediated SLIT repression in neoplastic brain cells [40]. Interestingly, the bioinformatics analysis also identified the dysregulated genes in our UTUC dataset were enriched in representative PRC2/EZH2 oncogenic gene signatures (Figure 4B), with an average 7.1-fold increased expression of EZH2 in UTUC tumor tissue. PRC2 exerts epigenetic regulatory role during transcription and leads to target gene silencing [41], and ensures proliferative and regenerative potential of urothelial progenitor cells in response to injury [34]. EZH2 is one of the polycomb group genes, and the overexpression of EZH2 occur in prostate cancer and bladder cancer, and is associated with poor outcome in high grade UTUC cohort [42-45]. Taken together, epigenetic regulation of PRC2/ EZH2 on cell cycle checkpoint related genes and downstream SLIT3 suppression may have potential contribution to cancer development. However, the role of this regulatory axis in UTUC pathogenesis remains to be elucidated.
SLIT3 (Slit guidance ligand 3) is one of the SLIT gene family members encoding secreted glycoprotein, Slits, that is highly expressed in mammalian tissues, and serves as ligands for roundabout (Robo) receptor, propagating many downstream signaling responses related to kinases and microtubule cytoskeleton [46,47]. SLIT3 is a tumor suppressor gene, where decreased expression of SLIT3 was observed in many human cancers through hypermethylation of SLIT3 promoter region or synergistic inhibitory effect with intronic miR-218, which also revealed an average 8.6-fold decreased expression in our dataset, leading to tumor invasion and progression [47-51]. The Expression Atlas, a database including gene and transcript expression from microarray- and sequencing-based functional genomics experiments [52], for RNA-seq mRNA differential expression of SLIT3 also revealed low SLIT3 expression in breast cancer, skin cancer, small cell lung cancer, and glioblastoma tissues, while higher SLIT3 expression was observed in esophageal adenocarcinoma and Barrett's esophagus tissues. The role of SLIT3 in UC has not been reported in the literature. Using bioinformatics approach, we identified low expression level of SLIT3 in high grade, invasive bladder UC and renal pelvis UC, and poorer survival rate in bladder UC patients with lower SLIT3 expression. This implicated the potential role of SLIT3 in UC tumor progression.
The crosstalk between tumor and adjacent non-tumor cells can be mediated by exosomes containing miRNAs, and change the tumor microenvironment to an invasion-promoting environment [53]. The role of secreted miRNA exosome in muscle-invasive bladder cancer has recently been reported, indicating the potential role of liquid biopsy for urinary exosomes as molecular marker in UC [54,55]. We identified up-regulated miR-34a-5p was the potential miRNA regulating SLIT3. Literature supported miR-34a as a tumor suppressor miRNA targeting key regulators of cell cycle and apoptosis through p53-dependent and p53-independent pathways [56-60], being silenced due to CpG methylation of its promoter in many cancer cell lines, including UC [61]. High expression of miR-34a was also reported to have reduced risk of bladder cancer recurrence [62]. Several studies also proposed the promoting effect of miR-34a in chemoresistance [63,64]. In bladder cancer cell lines, miR-34a activation can reduce cancer stem cell properties and sensitize these cells to gemcitabine and cisplatin [65,66]. These results suggested miR-34a may exert both oncogenic and oncosuppressive properties in different tumors and tumor environments. The role of miR-34a in UTUC has not been reported. Our current findings identified an average of 2.8-fold increased expression of miR-34a-5p in UTUC tumor tissue compared to adjacent normal urothelial tissue. Whether miR-34a-5p-SLIT3 regulation exerts regulatory role in UTUC development or progression merits further investigation.
The ECM is a major component of TME that regulates cell behavior [67]. The study of ECM proteome, namely matrisome, in cancer is evolving, emphasizing the important roles of tumor surroundding microenvironment and other non-tumor cells in cancer [17,19]. The gene ontology enrichment analysis of our UTUC dataset identified the dysregulated genes in UTUC were most differentially enriched in cellular component of ECM region (135 of the 317 dysregulated genes), as shown in Figure 3C. Among the 135 genes, 57 molecules were ECM-associated, as identified from MatrisomeDB 2.0 introduced by Naba et al. [68,69], where SLIT3 was grouped as one of the core matrisome genes. Excessive ECM deposition is one of the characteristic features of cancer, and several core matrisome genes predicted cancer outcome in various cancer types [70]. However, our GSEA enrichment analysis results indicated gene sets related to matrisome were enriched in UTUC adjacent non-tumor tissue instead (Figure 4A, lower panel). The concept of TME holds true that tumor cells react to altered TME and affect gene expression of normal tissue adjacent to the tumor (NAT), and unique characteristics of NAT from healthy tissue has recently been reported [71]. The mechanisms underlying altered gene expression in NAT remain to be validated, and changed microenvironment in the adjacent stroma may possibly be regulated by the tumor [72]. Our result may implicate the dysregulated genes in UTUC are potentially involved in altered ECM tumor microenvironment, while the mechanistic link between matrisome-associated genes and tumor related biological processes necessitate further investigation.
There are several potential weaknesses to be addressed. Firstly, the current findings of potential SLIT3 regulation and prognostic prediction for UTUC were based on two patients of UTUC and validated by systematic bioinformatics analyses. Further investigation and longitudinal follow-up in a larger UTUC cohort is necessary to confirm its prognostic value. Additionally, the UTUC specimens were collected from Taiwanese population, where epidemiology of UTUC was different from reported worldwide, suggesting the potential influence of environmental and/or genetic factors, thus may limit the generalizability of the current findings in different populations.
Conclusions
The current study identified novel miRNA target with potential SLIT3 regulation may have potential prognostic value in UTUC, possibly related to aberrant cell cycle progression and altered tumor microenvironment. Further investigation to confirm the role of SLIT3 and its miRNA regulation in UTUC tumor initiation and progression is of potential clinical significance.
Acknowledgements
This study was supported by grants from the Ministry of Science and Technology (MOST 107-2320-B-037-011-MY3; MOST 107-2314-B-037-092; MOST 106-2314-B-037-029), the Kaohsiung Medical University Hospital (KMUHS10701; KMUHS10712; KMUH 106-6R53), and the Kaohsiung Medical University (KMU-DK108003; 105KMUOR05). The authors thank the Center for Research Resources and Development of Kaohsiung Medical University.
Competing Interests
The authors have declared that no competing interest exists.
References
1. Lai MN, Wang SM, Chen PC. et al. Population-based case-control study of Chinese herbal products containing aristolochic acid and urinary tract cancer risk. J Natl Cancer Inst. 2010;102:179-186
2. Zeegers MP, Tan FE, Dorant E. et al. The impact of characteristics of cigarette smoking on urinary tract cancer risk: a meta-analysis of epidemiologic studies. Cancer. 2000;89:630-639
3. Lin MY, Li WM, Huang CN. et al. Dialysis Increases the Risk of Bladder Recurrence in Patients with Upper Tract Urothelial Cancer: A Population-Based Study. Ann Surg Oncol. 2018;25:1086-1093
4. Chen JS, Lu CL, Huang LC. et al. Chronic Kidney Disease is Associated With Upper Tract Urothelial Carcinoma: A Nationwide Population-Based Cohort Study in Taiwan. Medicine. 2016;95:e3255
5. Wang SM, Lai MN, Chen PC. et al. Increased upper and lower tract urothelial carcinoma in patients with end-stage renal disease: a nationwide cohort study in Taiwan during 1997-2008. Biomed Res Int. 2014;2014:149750
6. Catto JW, Yates DR, Rehman I. et al. Behavior of urothelial carcinoma with respect to anatomical location. J Urol. 2007;177:1715-1720
7. Shen CH, Chiou HY, Tung MC. et al. Clinical and demographic characteristics among patients with urothelial carcinomas of the upper urinary tract and bladder in Taiwan. J Chin Med Assoc. 2017;80:563-568
8. Roupret M, Babjuk M, Comperat E. et al. European guidelines on upper tract urothelial carcinomas: 2013 update. Eur Urol. 2013;63:1059-1071
9. Lughezzani G, Sun M, Perrotte P. et al. Gender-related differences in patients with stage I to III upper tract urothelial carcinoma: results from the Surveillance, Epidemiology, and End Results database. Urology. 2010;75:321-327
10. Krabbe LM, Lotan Y, Bagrodia A. et al. Prospective comparison of molecular signatures in urothelial cancer of the bladder and the upper urinary tract-is there evidence for discordant biology? J Urol. 2014;191:926-931
11. Lee JY, Kim K, Sung HH. et al. Molecular Characterization of Urothelial Carcinoma of the Bladder and Upper Urinary Tract. Transl Oncol. 2018;11:37-42
12. Sfakianos JP, Cha EK, Iyer G. et al. Genomic Characterization of Upper Tract Urothelial Carcinoma. Eur Urol. 2015;68:970-977
13. Patel N, Arya M, Muneer A. et al. Molecular aspects of upper tract urothelial carcinoma. Urol Oncol. 2014;32:28.e11-20
14. Yates DR, Catto JW. Distinct patterns and behaviour of urothelial carcinoma with respect to anatomical location: how molecular biomarkers can augment clinico-pathological predictors in upper urinary tract tumours. World J Urol. 2013;31:21-29
15. Mbeutcha A, Roupret M, Kamat AM. et al. Prognostic factors and predictive tools for upper tract urothelial carcinoma: a systematic review. World J Urol. 2017;35:337-353
16. Gilkes DM, Semenza GL, Wirtz D. Hypoxia and the extracellular matrix: drivers of tumour metastasis. Nat Rev Cancer. 2014;14:430-439
17. Socovich AM, Naba A. The cancer matrisome: From comprehensive characterization to biomarker discovery. Semin Cell Dev Biol. 2018 doi: 10.1016/j.semcdb.2018.06.005
18. Hoye AM, Erler JT. Structural ECM components in the premetastatic and metastatic niche. Am J Physiol Cell Physiol. 2016;310:C955-C967
19. Oliver AJ, Lau PKH, Unsworth AS. et al. Tissue-Dependent Tumor Microenvironments and Their Impact on Immunotherapy Responses. Front Immunol. 2018;9:70
20. Mendiratta P, Grivas P. Emerging biomarkers and targeted therapies in urothelial carcinoma. Ann Transl Med. 2018;6:250
21. Friedman AA, Letai A, Fisher DE. et al. Precision medicine for cancer with next-generation functional diagnostics. Nat Rev Cancer. 2015;15:747-756
22. Ziogas DE, Kyrochristos ID, Roukos DH. Next-generation sequencing: from conventional applications to breakthrough genomic analyses and precision oncology. Expert Rev Med Devices. 2018;15:1-3
23. Baras AS, Mitchell CJ, Myers JR. et al. miRge - A Multiplexed Method of Processing Small RNA-Seq Data to Determine MicroRNA Entropy. PLoS One. 2015;10:e0143066
24. Huang da W, Sherman BT, Lempicki RA. Systematic and integrative analysis of large gene lists using DAVID bioinformatics resources. Nat Protoc. 2009;4:44-57
25. Subramanian A, Tamayo P, Mootha VK. et al. Gene set enrichment analysis: a knowledge-based approach for interpreting genome-wide expression profiles. Proc Natl Acad Sci. 2005;102:15545-15550
26. Thomas S, Bonchev D. A survey of current software for network analysis in molecular biology. Hum Genomics. 2010;4:353-360
27. Kramer A, Green J, Pollard J Jr. et al. Causal analysis approaches in Ingenuity Pathway Analysis. Bioinformatics. 2014;30:523-530
28. Vejnar CE, Blum M, Zdobnov EM. miRmap web: Comprehensive microRNA target prediction online. Nucleic Acids Res. 2013;41:W165-W168
29. Rhodes DR, Kalyana-Sundaram S, Mahavisno V. et al. Oncomine 3.0: genes, pathways, and networks in a collection of 18,000 cancer gene expression profiles. Neoplasia. 2007;9:166-180
30. Gentles AJ, Newman AM, Liu CL. et al. The prognostic landscape of genes and infiltrating immune cells across human cancers. Nat Med. 2015;21:938-945
31. Barrett T, Wilhite SE, Ledoux P. et al. NCBI GEO: archive for functional genomics data sets-update. Nucleic Acids Res. 2013;41:D991-D995
32. Clough E, Barrett T. The Gene Expression Omnibus Database. Methods Mol Biol. 2016;1418:93-110
33. Kastan MB, Bartek J. Cell-cycle checkpoints and cancer. Nature. 2004;432:316-323
34. Balsara ZR, Li X. Sleeping beauty: awakening urothelium from its slumber. Am J Physiol Renal Physiol. 2017;312:F732-F743
35. da Silva JNL, Ranzi AD, Carvalho CT. et al. Cell Cycle Markers in the Evaluation of Bladder Cancer. Pathol Oncol Res. 2018 doi: 10.1007/s12253-018-0389-5
36. Chang IW, Lin VC, He HL. et al. CDCA5 overexpression is an indicator of poor prognosis in patients with urothelial carcinomas of the upper urinary tract and urinary bladder. Am J Transl Res. 2015;7:710-722
37. Lee YC, Wu WJ, Li WM. et al. Prognostic value of p53 protein overexpression in upper tract urothelial carcinomas in Taiwan. Anticancer Res. 2013;33:1091-1098
38. Ahn C, Jeong CW, Kwak C. et al. Ki-67 as a Prognostic Marker in Upper Urinary Tract Urothelial Carcinoma: A Systematic Review and Meta-Analysis. Clin Genitourin Cancer. 2018;16:e831-e841
39. Gurtner A, Manni I, Piaggio G. NF-Y in cancer: Impact on cell transformation of a gene essential for proliferation. Biochim Biophys Acta. 2017;1860:604-616
40. Amodeo V, A D, Betts J. et al. A PML/Slit Axis Controls Physiological Cell Migration and Cancer Invasion in the CNS. Cell Rep. 2017;20:411-426
41. Di Croce L, Helin K. Transcriptional regulation by Polycomb group proteins. Nat Struct Mol Biol. 2013;20:1147-1155
42. Wang H, Albadine R, Magheli A. et al. Increased EZH2 protein expression is associated with invasive urothelial carcinoma of the bladder. Urol Oncol. 2012;30:428-433
43. Raman JD, Mongan NP, Tickoo SK. et al. Increased expression of the polycomb group gene, EZH2, in transitional cell carcinoma of the bladder. Clin Cancer Res. 2005;11:8570-8576
44. Yang YA, Yu J. EZH2, an epigenetic driver of prostate cancer. Protein Cell. 2013;4:331-341
45. Singla N, Krabbe LM, Aydin AM. et al. Multi-institutional evaluation of the prognostic significance of EZH2 expression in high-grade upper tract urothelial carcinoma. Urol Oncol. 2018;36:343.e1-e8
46. Blockus H, Chedotal A. Slit-Robo signaling. Development. 2016;143:3037-3044
47. Dickinson RE, Dallol A, Bieche I. et al. Epigenetic inactivation of SLIT3 and SLIT1 genes in human cancers. Br J Cancer. 2004;91:2071-2078
48. Zhang C, Guo H, Li B. et al. Effects of Slit3 silencing on the invasive ability of lung carcinoma A549 cells. Oncol Rep. 2015;34:952-960
49. Yu H, Gao G, Jiang L. et al. Decreased expression of miR-218 is associated with poor prognosis in patients with colorectal cancer. Int J Clin Exp Pathol. 2013;6:2904-2911
50. Guan H, Wei G, Wu J. et al. Down-regulation of miR-218-2 and its host gene SLIT3 cooperate to promote invasion and progression of thyroid cancer. J Clin Endocrinol Metab. 2013;98:E1334-E1344
51. Marlow R, Strickland P, Lee JS. et al. SLITs suppress tumor growth in vivo by silencing Sdf1/Cxcr4 within breast epithelium. Cancer Res. 2008;68:7819-7827
52. Petryszak R, Burdett T, Fiorelli B. et al. Expression Atlas update-a database of gene and transcript expression from microarray- and sequencing-based functional genomics experiments. Nucleic Acids Res. 2014;42:D926-D932
53. Bang C, Thum T. Exosomes: new players in cell-cell communication. Int J Biochem Cell Biol. 2012;44:2060-2064
54. Franzen CA, Blackwell RH, Todorovic V. et al. Urothelial cells undergo epithelial-to-mesenchymal transition after exposure to muscle invasive bladder cancer exosomes. Oncogenesis. 2015;4:e163
55. Baumgart S, Holters S, Ohlmann CH. et al. Exosomes of invasive urothelial carcinoma cells are characterized by a specific miRNA expression signature. Oncotarget. 2017;8:58278-58291
56. Wang X, Xie Y, Wang J. Overexpression of MicroRNA-34a-5p Inhibits Proliferation and Promotes Apoptosis of Human Cervical Cancer Cells by Downregulation of Bcl-2. Oncol Res. 2017 doi: 10.3727/096504017x15037506066252
57. Yin D, Ogawa S, Kawamata N. et al. miR-34a functions as a tumor suppressor modulating EGFR in glioblastoma multiforme. Oncogene. 2013;32:1155-1163
58. Chen F, Hu SJ. Effect of microRNA-34a in cell cycle, differentiation, and apoptosis: a review. J Biochem Mol Toxicol. 2012;26:79-86
59. Zhang DG, Zheng JN, Pei DS. P53/microRNA-34-induced metabolic regulation: new opportunities in anticancer therapy. Mol Cancer. 2014;13:115
60. Di Bari M, Bevilacqua V, De Jaco A. et al. Mir-34a-5p Mediates Cross-Talk between M2 Muscarinic Receptors and Notch-1/EGFR Pathways in U87MG Glioblastoma Cells: Implication in Cell Proliferation. Int J Mol Sci. 2018:19 doi: 10.3390/ijms19061631
61. Lodygin D, Tarasov V, Epanchintsev A. et al. Inactivation of miR-34a by aberrant CpG methylation in multiple types of cancer. Cell Cycle. 2008;7:2591-2600
62. Andrew AS, Marsit CJ, Schned AR. et al. Expression of tumor suppressive microRNA-34a is associated with a reduced risk of bladder cancer recurrence. Int J Cancer. 2015;137:1158-1166
63. Pu Y, Zhao F, Wang H. et al. MiR-34a-5p promotes multi-chemoresistance of osteosarcoma through down-regulation of the DLL1 gene. Sci Rep. 2017;7:44218
64. Kastl L, Brown I, Schofield AC. miRNA-34a is associated with docetaxel resistance in human breast cancer cells. Breast Cancer Res Treat. 2012;131:445-454
65. Li H, Yu G, Shi R. et al. Cisplatin-induced epigenetic activation of miR-34a sensitizes bladder cancer cells to chemotherapy. Mol Cancer. 2014;13:8
66. Zhang Q, Zhuang J, Deng Y. et al. miR34a/GOLPH3 Axis abrogates Urothelial Bladder Cancer Chemoresistance via Reduced Cancer Stemness. Theranostics. 2017;7:4777-4790
67. Nelson CM, Bissell MJ. Of extracellular matrix, scaffolds, and signaling: tissue architecture regulates development, homeostasis, and cancer. Annu Rev Cell Dev Biol. 2006;22:287-309
68. Naba A, Clauser KR, Ding H. et al. The extracellular matrix: Tools and insights for the "omics" era. Matrix Biol. 2016;49:10-24
69. Naba A, Pearce OMT, Del Rosario A. et al. Characterization of the Extracellular Matrix of Normal and Diseased Tissues Using Proteomics. J Proteome Res. 2017;16:3083-3091
70. Yuzhalin AE, Urbonas T, Silva MA. et al. A core matrisome gene signature predicts cancer outcome. Br J Cancer. 2018;118:435-440
71. Aran D, Camarda R, Odegaard J. et al. Comprehensive analysis of normal adjacent to tumor transcriptomes. Nat Commun. 2017;8:1077
72. Pietras K, Ostman A. Hallmarks of cancer: interactions with the tumor stroma. Exp Cell Res. 2010;316:1324-1331
Author contact
![]() Corresponding authors: Wen-Jeng Wu; wejewuedu.tw and Po-Lin Kuo; kuopolinnet.tw
Corresponding authors: Wen-Jeng Wu; wejewuedu.tw and Po-Lin Kuo; kuopolinnet.tw