Impact Factor ISSN: 1449-1907
- Issue 7; 2026
- Issue 6; 2026
- Issue 5; 2026
- Issue 4; 2026
- Issue 3; 2026
- Volume 23; 2026
- Past Issues
- Editorial Board
- Cover Images
- Index & Coverage
- Cover Suggestion
- Special Issues
Introduction
Participants and Methods
Results
Discussion
Conclusion
Abbreviations
Acknowledgements
References

 Global reach, higher impact
Int J Med Sci 2019; 16(1):75-83. doi:10.7150/ijms.28044 This issue Cite
Research Paper
Ultrasound/Elastography techniques, lipidomic and blood markers compared to Magnetic Resonance Imaging in non-alcoholic fatty liver disease adults
Irene Cantero1, Mariana Elorz2, Itziar Abete1,3, Bertha Araceli Marin1, Jose Ignacio Herrero4,5,8, Jose Ignacio Monreal4,6, Alberto Benito2, Jorge Quiroga4,7,8, Ana Martínez4,9, Mª Pilar Huarte4,9, Juan Isidro Uriz-Otano4,9, Josep Antoni Tur3,10, John Kearney11, J. Alfredo Martinez1,3,4,12 ![]() , M. Angeles Zulet1,3,4
, M. Angeles Zulet1,3,4
1. Department of Nutrition, Food Science and Physiology. Centre for Nutrition Research. School of Pharmacy and Nutrition, University of Navarra, Pamplona, Spain.
2. Department of Radiology, Clínica Universidad de Navarra, Pamplona, Spain.
3. CIBERobn, Physiopathology of Obesity and Nutrition. Instituto de Salud Carlos III. Madrid, Spain.
4. Navarra Institute for Health Research (IdiSNA), Pamplona, Spain.
5. Liver Unit, Clinica Universidad de Navarra, Pamplona, Spain.
6. Clinical Chemistry Department, Clínica Universidad de Navarra, Pamplona, Spain.
7. Department of Internal Medicine, Clínica Universidad de Navarra, Pamplona, Navarra, Spain.
8. Centro de Investigación Biomédica en Red de Enfermedades Hepáticas y Digestivas (CIBEREHD), Madrid, Spain.
9. Department of Gastroenterology, Complejo Hospitalario de Navarra, Pamplona, Spain.
10. Research Group on Community Nutrition and Oxidative Stress. University of Balearic Islands. Palma de Mallorca. Spain.
11. School of Biological Sciences, Dublin Institute of Technology, Dublin, Republic of Ireland.
12. IMDEA FOOD. Madrid.
Received 2018-6-21; Accepted 2018-10-18; Published 2019-1-1
Abstract
Introduction: Non-alcoholic fatty liver disease (NAFLD) may progress to steatohepatitis, cirrhosis and complicated hepatocellular carcinoma with defined differential symptoms and manifestations.
Objective: To evaluate the fatty liver status by several validated approaches and to compare imaging techniques, lipidomic and routine blood markers with magnetic resonance imaging in adults subjects with non-alcoholic fatty liver disease.
Materials and methods: A total of 127 overweight/obese with NAFLD, were parallelly assessed by Magnetic Resonance Imaging (MRI), ultrasonography, transient elastography and a validated metabolomic designed test to diagnose NAFLD in this cross-sectional study. Body composition (DXA), hepatic related biochemical measurements as well as the Fatty Liver Index (FLI) were evaluated. This study was registered as FLiO: Fatty Liver in Obesity study; NCT03183193.
Results: The subjects with more severe liver disease were found to have worse metabolic parameters. Positive associations between MRI with inflammatory and insulin biomarkers were found. A linear regression model including ALT, RBP4 and HOMA-IR was able to explain 40.9% of the variability in fat content by MRI. In ROC analyses a combination panel formed of ALT, HOMA-IR and RBP4 followed by ultrasonography, ALT and metabolomic test showed the major predictive ability (77.3%, 74.6%, 74.3% and 71.1%, respectively) for liver fat content.
Conclusions: A panel combination including routine blood markers linked to insulin resistance showed highest associations with MRI considered as a gold standard for determining liver fat content. This combination of tests can facilitate the diagnosis of early stages of non-alcoholic liver disease thereby avoiding other invasive and expensive methods.
Keywords: MRI, liver fat content, ultrasound, ROC, FibroScan, NAFLD.
Introduction
Non-alcoholic fatty liver disease (NAFLD) encompasses a spectrum of clinical conditions with hepatic fat accumulation, which can start from a simple steatosis to non-alcoholic steatohepatitis (NASH) and finally advanced fibrosis leading to cirrhosis or to hepatocellular carcinoma (1). Steatosis without inflammation represents about 80-90% of cases (2). Around 15-20% of people with NASH will have liver cirrhosis in 10-20 years (3). The inconsistencies between the great prevalence of NAFLD in the general adult population and the low awareness of determinative clinical symptoms and the lack of appropriate diagnosis tools needs to be investigated for improved and more precise clinical practice (4). In any case, NAFLD cannot be considered as a benign disease, because the progression of NAFLD could drive to a fatal stages and conditions in the liver, including hepatocellular carcinoma (5). Currently, there is no a simple generally accepted medical treatment for NAFLD, weight loss induced by hypocaloric diets, bariatric surgery or drug inducing fat mal-absorption, could ameliorate the NAFLD manifestations in some cases (6). Accordingly, NAFLD is associated with key metabolic syndrome components such as obesity, insulin resistance, hypertension and hypertriglyceridemia, but the mechanisms concerning this disease pathogenesis and progression remain unclear (7). The gold standard test for the diagnosis of NAFLD is liver biopsy, but it is rarely performed because is an invasive and expensive procedure and which is not devoid of some degree of error (8). Non-invasive liver biomarkers and routine laboratory tests such as alanine aminotransferase (ALT), aspartate aminotransferase (AST) and gamma-glutamyl-transpeptidase (GGT) are included in the general examination in subjects with suspected NAFLD (9), but they are often imprecise or unspecific. Therefore, newer investigations are focusing on more efficient predictive factors, including imaging techniques, algorithms, metabolomics measurements and plasma biomarkers to non-invasively identifications of NAFLD features at early stages (10). Therefore, it is important to seek alternatives to detect NAFLD. Thus, the objective of this research was to evaluate the fatty liver status by several validated approaches and to compare imaging techniques, lipidomic and routine plasma markers with magnetic resonance imaging in adults' subjects with non-alcoholic fatty liver disease.
Participants and Methods
Study protocol
The current study included 127 overweight/obese subjects with ultrasound-confirmed liver steatosis. The analyses were conducted within the FLiO project (Fatty Liver in Obesity), a randomized controlled trial (www.clinicaltrials.gov; NCT03183193), which was conducted following the Consort 2010 guidelines. The study was approved by the Ethics Committee of the University of Navarra (54/2015). All participants gave written informed consent for their participation in accordance with the Declaration of Helsinki. The study considered 127 men and women, between 40-80 years of age, with overweight or obesity (calculated as a BMI ≥ 27.5 and < 40 kg / m2) as described elsewhere (11) and with NAFLD (diagnosed by Radiology or Hepatology professionals using conventional ultrasonography / elastography for the assessment). The exclusion criteria were endocrine disorders, hyper or uncontrolled hypothyroidism, known liver disease (other than NAFLD), alcohol abuse (> 21 and> 14 units of alcohol per week in men and women respectively (ex 1 unit = 125 mL of wine), pharmacological treatments (immunosuppressants, cytotoxic agents, systemic corticosteroids or other drugs potentially causing steatosis hepatic or alteration of liver tests), presence of active autoimmune diseases or requiring pharmacological treatment, acute infections, a weight loss ≥3 kg in the last 3 months, serious psychiatric disorders as well lack of autonomy, or inability to follow the diet.
Anthropometric, body composition and biochemical measurements
Anthropometric measurements such us body weight and waist circumference (WC), were determined in fasting conditions following previously described standardized procedures (12). Body composition was assessed by dual-energy x-ray absorptiometry (Lunar Prodigy, software version 6.0, Madison, WI) at baseline in accordance with validated protocols (13). Body mass Index (BMI) was calculated as body weight divided by height squared (kg/m2) following accepted cut-off criteria (11). Glucose, total cholesterol (TC), triglycerides (TG), ALT, AST, C-reactive protein (CRP) and GGT were measured with routine validated procedures in the laboratory of biochemistry in the Clinic Universidad de Navarra. Plasma concentrations of Fibroblast growth factor 21 (FGF-21) and Retinol binding protein 4 (RBP-4) were assessed by an ELISA assay with the same autoanalyzer system (Triturus, Grifols SA, Barcelona, Spain) in accordance with the manufacturer's instructions. The Fatty Liver Index (FLI) is an algorithm derived from serum TG, BMI, WC and GGT levels (14-17), which has been validated in a large group of subjects with or without liver disease and has an accuracy of 0.84 (95% CI) in detecting fatty liver. An index of <30 points indicates the absence of fatty liver and an index ≥60 rules is a marker of in fatty liver. Finally, Triglycerides/glucose index (TyG) was computed for each participant as the natural logarithm (Ln) of [fasting triglycerides (mg/dl) * Fasting plasma glucose (mg/dl)/2] (18).
Metabolomics
The metabolomic used test, OWLiver (One Way Liver S. L. Bilbao, Spain) is a fasting blood probe that measures a panel of biomarkers that belong to the family of triacylglycerols (TGs), which are a reflection of the amount of fat and inflammation of the liver (19) and, therefore a measure of the degree of development of the NAFLD. All TGs are measured by high performance liquid chromatography and mass spectrometry (UHPLC-MS) as described elsewhere (19). The relative metabolite concentrations are analyzed together in an algorithm that generates the final OWLiver score, this being the probability of approximation of the state of the individual's liver to a normal liver, steatotic or with NASH. The test is based on the results expressed on a scale of values / probabilities from 0 to 1, which discriminates between non-fatty and fatty liver. The outcomes have a value of 0.5 as the cut-off point or separation to discriminate between their respective two stages. The test score was developed to estimate the NAFLD stage and is based on a prospective study, where subjects had previously been diagnosed by liver biopsy (19).
Imaging assessments
The ultrasonography methodology consisted in the evaluation of the steatosis status by visual quality of the liver echogenicity, measurements of the difference between the kidneys and the liver in the amplitude of the echo, determination of the clarity of the structures of the blood vessels in the liver (20). The clinical classification was done using a 4-point scale: less than 5% (grade 0), 5-33% (grade 1), 33-66% (grade 2), and greater than 66% (grade 3) as described elsewhere (20, 21). Transient elastography, with the subject in the supine position and the right arm in maximum abduction was also assessed (22). At this point, depending on the obesity status, M and XL probes were selected under the professional criteria. After finding and adequate window for exploring, repeated shots were performed until obtaining 10 valid values. The study was considered unsuccessful if no valid measurement was obtained in any of the 20 shots, while it was considered reliable if: a) 10 valid measurements were obtained; b) the proportion of valid measurements was at least 60%, and c) the interquartile range (IQR [interquartile range], which reflects the variability of the measurements) was less than 30% of the median value of liver stiffness obtained (LSM) [liver stiffness measurement]) (IQR / LSM <0.3) (23). If the study was considered valid, it was agreed that there was significant hepatic fibrosis if the measured median stiffness was greater than 7 kPa and cirrhosis 12 kPa (24). Magnetic Resonance Imaging (MRI) was used to detect and quantify lipids following the accepted criteria (22). The methodological concept is based on the inherent frequency difference between water and the dominant methylene resonance in lipid, leading in an observable chemical change echo-times (TE) in eco-gradient (GRE) images. Ignoring other underlying magnetic resonance and other biological effects, the degree of signal loss in phase images opposite to the proportion of a degree of particle accumulation, resulting in a method to detect fat liver (25). Those subjects with <5% were considered with NAFLD through this MRI technique (26). The echograph used was Siemens ACUSON S2000 y S3000. Transition elastography were performed through FibroScan® (Echosens, Paris, France) and finally, MRI was Siemens Aera 1,5 T. All the imaging tests were performed and evaluated by the same hepatologist within the medical team. Finally, cut off points of the different imaging techniques and transaminases levels were: Ultrasonography (grade 1/grade 2 and 3) (20); FibroScan (7 Kpa) (16), MRI (5%) (27) and OWLiver metabolic test (0.5) (28). Cur-off points for transaminases levels were 41 U/L for men and 33 U/L for women, and AST were 37 U/L for men and 31 U/L for women according with the normalized values of the laboratory procedures of Clínica Universidad de Navarra.
Statistical analyses
Normality distributions of the measured variables were determined according to the Shapiro-Wilk test. The relationships between MRI and anthropometric, biochemical and liver factors were assessed by ANOVA test. All comparisons were corrected by Bonferroni´s method. Spearman and Pearson were evaluated in the association between MRI with inflammatory and metabolic status as appropriate. Linear regression analyses were carried out taking the percentage of liver fat (MRI) as the dependent variable. Receiver Operating Characteristic (ROC) curves were applied to calculate the power of prediction of some variables for liver fat content (NAFLD) and the combination panel was created to calculate the power of prediction including homeostatic model assessment of insulin resistance (HOMA-IR), ALT and RBP-4 variables. Analyses were performed using STATA version 12.0 (Stata Corp). All p values presented are two-tailed, and differences were considered statistically significant at p<0.05.
Results
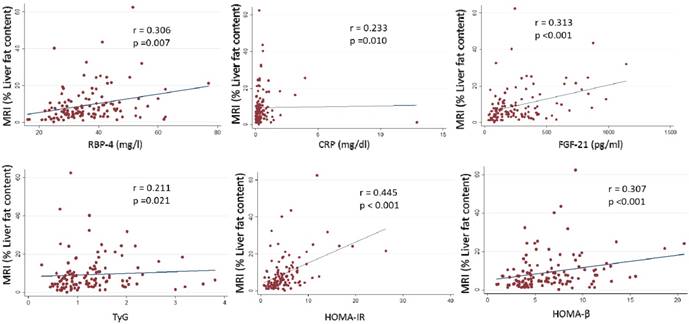
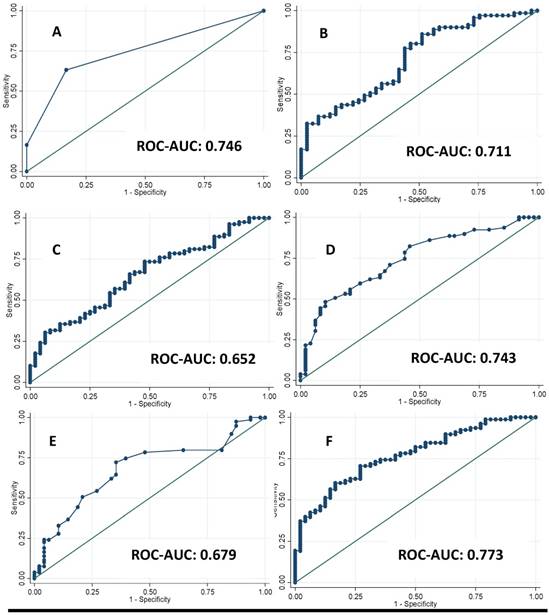
A total of 127 Spanish adults participated in this cross-sectional analysis. The main clinical characteristics of the participants are reported in Table 1. Imaging techniques, metabolomic analysis study (OWLiver Care) and routine liver markers were categorized according to standard validated values. Subjects distributed by grades of steatosis 2 or 3, with more than 7 Kpa of liver stiffness and more than 5% of hepatic fat content showed higher adiposity, general biochemical status and liver markers (Table 2). Likewise, in Table 3 the same occurs accordingly with the metabolomic study (OWLiver) and transaminases, being subjects with worse liver markers and general metabolic status, those subjects with higher liver damage (Table 3). Liver fat content and metabolic/inflammatory markers were correlated: RBP-4 (r= 0.306, p= 0.007), CRP (r= 0.233, p= 0.010), FGF-21 (r= 0.313, p< 0.010), TyG (r= 0.211, p= 0.021), HOMA-IR (r= 0.445, p<0.010), and homeostatic model assessment of β-cell function HOMA-β (r= 0.307, p<0.001) (Figure 1). Thus, a linear regression model was built (Table 4) with MRI and HOMA-IR, RBP-4 and ALT. When these variables were jointly considered, the predictors of the model explained up to 40.9% of the variation of liver fat content (%) assessed by MRI. Finally, the Receiver Operating Curves (ROC) analyses, using MRI as the “gold standard” non-invasive method evidenced the following Receiver Operating Curves-area under de curve (ROC-AUC) (Figure 2): ultrasonography (ROC-AUC:0.746), OWLiver metabolomics (ROC-AUC: 0.711), FLI (ROC-AUC: 0.652) ALT (ROC-AUC: 0.743), AST (ROC-AUC: 0.679) and the combination of HOMA-IR, ALT and RBP-4 showed the highest predictive ability for liver fat content (ROC-AUC: 0.773).
Main characteristics of the participants.
| Participants (n=127) | |
|---|---|
| Sociodemographic, anthropometric and biochemical variables | |
| Sex (n) (male/female) | 73/54 |
| Age (y.) | 50.8 (9.2) |
| Body mass Index (kg/m2) | 33.8 (3.9) |
| Waist Circumference (cm) | 109.8 (9.7) |
| Total fat mass (%) | 42.9 (6.4) |
| Glucose (mg/dL) | 108.0 (29.9) |
| HOMA-IR | 5.3 (4.8) |
| Triglycerides (mg/dL) | 137.0 (76.8) |
| Total Cholesterol (mg/dL) | 195.2 (38.0) |
| Liver status | |
| ALT (U/L) | 33.8 (18.1) |
| AST (U/L) | 25.0 (9.8) |
| GGT (U/L) | 37.42 (25.8) |
| Liver fat mass (%) (MRI) | 9.3 (9.2) |
| Liver stiffness (Kpa) (Elastography) | 5.1 (2.5) |
| Ultrasonography (n) (grades) | |
| 1 | 69 |
| 2 | 45 |
| 3 | 13 |
| Dietary and lifestyle habits | |
| Energy intake (kcal) (n=112) | 2689 (1014) |
| Mediterranean Diet adhesion (17 puntos) | 6.2 (2.8) |
| Physical activity (METs) | 3309 (2639) |
HOMA-IR, homeostatic model assessment of insulin resistance. ALT, alanine-amino transferase. AST, aspartate-amino transferase. GGT. Gamma-glutamyl transferase. MRI, magnetic resonance imaging.
Description of the main clinical characteristics of participants according to different imaging techniques.
| Liver fat (MRI) | Grades of steatosis (Ultrasonography) | Liver stiffness (Elastography) | ||||
|---|---|---|---|---|---|---|
| n= 127 | <5% (n48) | ≥5% (n79) | 1 (n69) | 2 and 3 (n58) | <7 Kpa (n97) | ≥7 Kpa (n30) |
| Anthropometric and body composition | ||||||
| Weight (kg) | 95.3 (13.3) | 96.2 (14.9) | 92.5 (12.5) | 99.9 (15.3) | 93.8 (12.5) | 104.1 (21.5) |
| BMI (kg/m2) | 33.3 (3.5) | 34.1 (4.1) | 32.8 (3.3) | 35.1 (4.3) | 33.2 (3.6) | 36.4 (5.3) |
| Waist circumference (cm) | 107.5 (8.9) | 111.1 (9.9) | 106.4 (8.4) | 113.8 (9.6) | 108.1 (8.6) | 115.7 (14.2) |
| Android total fat mass (%) | 52.9 (5.6) | 53.1 (6.2) | 52.7 (6.2) | 53.4 (5.6) | 52.5 (6.4) | 54.5 (4.2) |
| Total fat mass (%) | 43.4 (6.5) | 42.5 (6.4) | 43.0 (6.7) | 42.6 (6.1) | 42.1 (6.6) | 45.1 (5.2) |
| General biochemical variables | ||||||
| Total Cholesterol (mg/dL) | 196.3 (39.7) | 194.6 (37.7) | 196.2 (38.5) | 194.1 (37.6) | 199.7 (36.0) | 187.5 (43.2) |
| TG (mg/dL) | 118.8 (69.6) | 148.1 (79.2) | 122.3 (62.8) | 154.4 (82.6) | 135.3 (76.8) | 151.0 (61.7) |
| Glucose (mg/dL) | 100.9 (14.2) | 112.3 (35.7) | 99.7 (12.7) | 117.8 (40.1) | 103.9 (9.2) | 122.7 (25.3) |
| Insulin (mU/L) | 14.5 (7.6) | 21.7 (12.7) | 15.4 (8.7) | 23.0 (13.1) | 18.3 (11.2) | 22.8 (13.4) |
| HOMA-IR | 3.6 (2.0) | 6.4 (5.6) | 3.8 (2.1) | 7.1 (6.2) | 4.8 (3.7) | 6.9 (7.1) |
| HOMA-β | 5.5 (2.8) | 7.5 (4.0) | 6.0 (3.5) | 7.6 (3.8) | 6.7 (3.7) | 6.8 (3.8) |
| Liver markers | ||||||
| ALT (U/L) | 25.5 (12.7) | 38.9 (19.1) | 27.2 (12.6) | 41.1 (20.9) | 33.5 (17.2) | 40.2 (25.2) |
| AST (U/L) | 21.4 (6.9) | 27.1 (10.7) | 22.7 (6.4) | 27.7 (12.3) | 24.7 (9.7) | 27.3 (11.2) |
| GGT (U/L) | 30.7 (23.8) | 41.4 (26.2) | 34.5 (24.7) | 40.8 (26.8) | 37.3 (26.7) | 41.2 (25.0) |
| FLI (arbitrary units) | 74.2 (20.8) | 83.4 (15.2) | 74.2 (19.8) | 86.8 (12.8) | 78.0 (18.7) | 87.8 (16.1) |
| RBP-4 (mg/L) | 33.93 (10.0) | 37.9 (9.9) | 34.5 (9.9) | 38.5 (10.0) | 35.7 (8.9) | 38.6 (13.2) |
| CRP (mg/dL) | 0.5 (1.8) | 0.5 (0.6) | 0.5 (1.5) | 0.5 (0.6) | 0.4 (0.5) | 0.8 (2.2) |
| FGF-21 (pg/mL) | 212.2 (148.1) | 313.6 (259.2) | 211.4 (172.0) | 349.5 (262.7) | 258.4 (199.5) | 327.9 (300.4) |
| TyG ratio | 1.1 (0.6) | 1.3 (0.6) | 1.2 (0.7) | 1.3 (0.6) | 1.3 (0.6) | 1.2 (0.6) |
(mean ± SD). Statistically different data are in bold type. BMI: Body mass Index; TG: triglycerides; HOMA-IR: homeostatic model assessment of insulin resistance; ALT: Alanine-amino transferase; AST: Aspartate-amino transferase; GGT: Gamma-glutamyl transferase; FLI: Fatty liver index; RBP-4, retinol binding protein 4; CRP, c-reactive protein; FGF-21, Fibroblast growth factor 21; TyG, triglycerides/ glucose ratio. Cut-off points: Liver fat (MRI) = 5%; Grades of steatosis (ultrasonography) = 1 and 2-3; Liver stiffness (Fibro Scan) = 7 Kpa.
Description of the main clinical characteristics of participants according to metabolomic test and transaminases to diagnose different liver status.
| Metabolomic test (OWLiver Care) | ALT (U/L) | AST (U/L) | ||||
|---|---|---|---|---|---|---|
| n= 127 | <0.5 (n28) | ≥0.5 (n84) | Men ≤ 41 (U/L) Women ≤ 33 (U/L) n (85) | Men >41 (U/L) Women > 33 (U/L) n (42) | Men ≤ 37 (U/L) Women ≤ 31 (U/L) n (113) | Men > 37 (U/L) Women > 31 (U/L) n (14) |
| Anthropometric and body composition | ||||||
| Weight (kg) | 92.3 (11.7) | 96.9 (14.4) | 95.6 (13.7) | 96.3 (15.6) | 96.7 (14.4) | 89.5 (12.1) |
| BMI (kg/m2) | 33.1 (3.3) | 34.2 (4.9) | 33.7 (3.6) | 34.1 (4.5) | 33.9 (9.0) | 33.4 (3.4) |
| Waist circumference (cm) | 106.4 (7.6) | 111.0 (9.7) | 109.3 (9.7) | 110.8 (9.7) | 110.0 (9.8) | 107.7 (8.9) |
| Android total fat mass (%) | 52.5 (11.8) | 53.0 (5.8) | 53.1 (6.4) | 52.8 (5.0) | 53.1 (6.1) | 52.5 (4.4) |
| Total fat mass (%) | 42.0 (10.4) | 42.9 (6.3) | 40.2 (8.7) | 39.0 (10.0) | 40.2 (9.3) | 36.4 (5.9) |
| General biochemical variables | ||||||
| Total Cholesterol (mg/dL) | 183.0 (37.1) | 200.8 (37.9) | 193.7 (38.6) | 198.4 (36.9) | 194.8 (38.5) | 198.7 (34.6) |
| TG (mg/dL) | 86.8 (33.0) | 151.3 (73.9) | 130.7 (67.6) | 149.8 (92.2) | 138.0 (78.7) | 128.7 (60.7) |
| Glucose (mg/dL) | 98.6 (13.0) | 109.5 (32.6) | 105.1 (17.1) | 113.8 (45.3) | 107.3 (29.8) | 113.7 (31.3) |
| Insulin (mU/L) | 14.3 (8.7) | 20.3 (11.5) | 17.6 (10.7) | 21.6 (12.7) | 18.6 (11.8) | 21.5 (9.1) |
| HOMA-IR | 2.0 (0.9) | 5.5 (4.8) | 4.7 (3.6) | 6.6 (6.4) | 5.2 (4.9) | 6.2 (3.2) |
| HOMA-β | 3.3 (1.5) | 6.9 (3.7) | 6.4 (3.4) | 7.5 (4.2) | 6.7 (3.8) | 7.4 (3.1) |
| Liver markers | ||||||
| ALT (U/L) | 26.8 (16.7) | 35.5 (17.3) | 23.8 (7.1) | 54.1 (16.8) | 29.7 (12.4) | 67.5 (22.3) |
| AST (U/L) | 21.6 (6.2) | 25.6 (10.0) | 20.7 (5.1) | 33.6 (11.4) | 22.4 (5.7) | 45.5 (12.4) |
| GGT (U/L) | 23.1 (11.3) | 41.8 (25.0) | 31.4 (23.1) | 49.6 (26.9) | 35.4 (23.9) | 53.3 (35.0) |
| FLI (arbitrary units) | 68.4 (18.2) | 84.4 (14.5) | 78.1 (18.0) | 83.5 (17.7) | 79.9 (18.0) | 80.3 (18.8) |
| RBP-4 (mg/L) | 35.8 (12.5) | 36.4 (10.0) | 35.7 (9.7) | 37.7 (10.8) | 36.0 (9.6) | 39.5 (13.2) |
| CRP (mg/dL) | 0.6 (0.7) | 0.5 (1.2) | 0.5 (1.4) | 0.4 (0.6) | 0.5 (1.2) | 0.5 (0.1) |
| FGF-21 (pg/mL) | 187.0 (148.5) | 280.2 (231.4) | 253.3 (223.1) | 318.5 (234.8) | 254.6 (215.5) | 438.1 (268.5) |
| TyG ratio | 0.8 (0.5) | 1.3 (0.6) | 1.2 (0.6) | 1.3 (0.7) | 1.3 (0.7) | 1.1 (0.4) |
(mean ± SD). Statistically different data are in bold type. BMI: Body mass Index; TG: triglycerides; HOMA-IR: homeostatic model assessment of insulin resistance; ALT: Alanine-amino transferase; AST: Aspartate-amino transferase; GGT: Gamma-glutamyl transferase; FLI: Fatty liver index;
RBP-4, retinol binding protein 4; CRP, c-reactive protein; FGF-21, Fibroblast growth factor 21; TyG, triglycerides/ glucose ratio. Cut-off points: Metabolomic test (OWLiver Care) = 0.5; ALT= 41 (U/L) men and 33 (U/L) for women; AST = 37 (U/L) for men and 31 (U/L) for women.
Associations between MRI (% liver fat content) with inflammatory and insulin biomarkers. P <0.05 was considered statistically significant. RBP-4: Retinol binding protein 4. CRP: C-reactive protein. FGF-21: Fibroblast growth factor 21. TyG: triglycerides/glucose ratio. HOMA-IR: homeostatic model assessment insulin resistance. HOMA-β: homeostatic model assessment β.
Linear regression analyses among MRI technique.
| % Liver fat content n (127) | β-coefficient | p-value |
|---|---|---|
| Sex | 1.836 | 0.217 |
| Age (years) | -0.013 | 0.853 |
| ALT (U/L) | 0.233 | <0.001 |
| HOMA-IR | 0.836 | <0.001 |
| RBP-4 (mg/l) | 0.157 | 0.026 |
| Pmodel | <0.001 | |
| R2-adjusted | 0.409 |
Statistically significant different data are in bold type. p<0.05 was considered statistically significance. ALT, Alanine-amino transferase; HOMA-IR, homeostatic model assessment of insulin resistance. RBP-4, Retinol binding protein 4.
Receivers Operating Curves between Magnetic Resonance Imaging (MRI) technique with A: Grades of steatosis (Ultrasonography); B: Metabolomics (OWLiver Care) C: Fatty Liver Index (FLI) and D: Alanine-amino transferase, E: Aspartate-amino transferase; F: homeostatic model assessment of insulin resistance and retinol binding protein and Alanine-transaminase.
Discussion
Non-alcoholic fatty liver disease encompasses a spectrum of clinical manifestations from simple steatosis to steatohepatitis which may progress to cirrhosis or hepatocellular carcinoma (29). Overweight and obesity situations have been related with NAFLD (30). Approximately, more than 1.4 billion adults were overweight, of which 500 million were obese in 2008. It is estimated that in 2030, 3.3 billion adults will suffer overweight or obese since the trend is rising (31). Thus, it is important to identify the relationships of excessive adiposity in different liver disease stages such as simple steatosis or NASH (32). In fact, a recent meta-analysis evidenced that NAFLD and NASH increased considerably the risk of suffering hepatocellular carcinoma (32). Liver biopsy is the gold standard to diagnose NAFLD with certainty. However, this process is an invasive method with significant risks and high costs (33). For this reason, other non-invasive methods are being investigated, whether serological or radiological, that could allow making the diagnosis of NAFLD simple and more informative (34). In addition, the association between NAFLD and inflammation is evidenced in our results and in others investigations, since these markers could have an important role through NAFLD (35, 36). Hepatic fat detected by MRI, US was noted to positively correlate with general anthropometric and body composition measurements. All these analyses suggest a differential impact of body weight and liver status assessed by different diagnostic strategies as reported by others (37). The metabolomic approach was more sensitive concerning lipid determinations. Again, it can be concluded that the assessed techniques showed some differences in the information they provided, which can be partly explained because the cut-off points were arbitrary (38). Indeed, diverse investigations have reported differences concerning liver fat content and stiffness with functional knowledge provided by the fatty liver index and the metabolomic profile. It is well known that magnetic resonance imaging can be used for accurate quantification of hepatic steatosis (39). This technique has been found to be highly accurate, reliable, and sensitive to changes in NAFLD degrees, which is able to quantify lipid fat content, while other non-invasive (ultrasonography and liver stiffness) assessment techniques (34) are less precise. Interestingly, in our study both MRI and all the rest of techniques used coincide in significantly discriminating in WC, FLI and glucose except for transaminases. However, MRI showed some differences with the other methods of diagnosis. Actually, ultrasonography is widely used to diagnosis the hepatic steatosis based on the idea that the fat accumulation increases the echogenicity of the liver (20). This technique is used when NAFLD is already suspected. The principal problem is if this effect also occurs with fibrosis and therefore, the diagnosis is often confused (40), being imprecise for mild steatosis diagnosis. Furthermore, our results suggest that most of the anthropometric and body composition determinants, biochemical measurements and liver markers discriminate relatively well between 1 or 2 and 3 grades of steatosis. On the other hand, liver stiffness measured by Fibro Scan, where low frequency waves are sent to the liver and then transmitted to an ultrasonography receiver. This approach presents some disadvantage. First, there is no consensus and validation about the cut-off to distinguish between high or low stiffness (41) and it is not able to detect liver fat unlike the ultrasonography and MRI (42). The speed of propagation measured in the liver gives the resulting liver stiffness (Kpa) value (43). In addition, the BMI of the participant, the fatty liver index, the insulin resistance and the weight are determinants for this technique suggesting that obesity and their co-morbidities status could play an important role in fibrosis (44, 45). In fact, insulin resistance is one of the key factors implicated in the development and progression of NAFLD, where the hepatic lipogenesis de novo is elevated, and the inhibition of adipose tissue lipolysis is reduced, consequently the flow of fatty acids increased (46). In addition, it produces dysfunction in adipose tissue, generating an increase of different adypokines and cytokines (47, 48). Indeed, the prevalence of NAFLD in subjects with type II diabetes has been demonstrated in more than 70% of individuals (49). Regarding the metabolomic approach, OWLiver Care is a novel metabolomic test based on a panel of 11 triglycerides, which has been validated with 467 biopsis adults (28). However the same authors concluded that this model can be affected in individuals with diabetes type II (28) or insulin resistance, which is very frequent in subjects with NAFLD (50). Nevertheless, this technique was able to discriminate specifically as expected TG and total cholesterol, insulin resistance variables and some of the liver markers. The FLI index, based on an easy calculation evidenced a good area under the curve of 0.84, for NAFLD determination, whom accuracy has been validated in comparison with liver ultrasonography (16), although is a technique without capacity for quantifying the hepatic fat content or stiffness (37). Transaminases values (ALT and AST) present very controversial results. Several authors have found that ALT or AST can be predictors of NAFLD, but in many other cases no associations have been found (51, 52). Finally, in the absence of liver biopsy, MRI may be considered the best method to assess hepatic steatosis (53), which is in agreement with our data when fitting the model that included gender, age, ALT, RBP-4 and HOMA-IR. Actually, when all these variables were jointly considered, the prediction value of the model explained up to 40.9%. Our results indicate that the assessment of liver status through different approaches provided complementary information contributing to the management of NAFLD. Since some of them are related with body composition (WC and FLI), while other are related with hepatic enzymes. Concerning ROC curves comparing ultrasonography, metabolomic OWLiver, ALT, AST and FLI as well as the combination panel were compared with magnetic resonance imaging as the reference. All results were statistically significant but, again the metabolomics, ultrasonography and combination panel showed the best predictions (ROC-AUC: 0.711; ROC-AUC: 0.746 and ROC-AUC: 0.773 respectively). The techniques that have major power of prediction were ultrasonography and OWLiver coinciding with those techniques that were more discriminative of metabolic factors as described previously (20, 54). Likewise, the combination of ALT, HOMA-IR and RBP-4 showed the best prediction with and accuracy of 77.3%. The design of different predictive models for non-alcoholic fatty liver disease through blood biomarkers or non-invasive imaging tests have many advantages, but some disadvantages and limited utility in comparison with liver biopsy. In other words, the utility of non-invasive liver markers to avoid the liver biopsy needs further investigation and consensus (43, 55). Our study is a transversal design, which can identify associations but not causality. A large cross-sectional study such as this one contributes to the establishment of new hypotheses for large prospective studies and clinical trials. The main limitation of this study is that we do not have liver biopsy results. However, the design of the current trial is based on validated non-invasive markers and imaging techniques, which makes them a suitable form of diagnosis and comparisons in clinical practice.
Conclusion
The steatosis gradation (ultrasonography) and a metabolomic test as well as the panel combination including routine plasma markers linked to insulin resistance showed the highest associations with magnetic resonance imaging considered as a gold standard for liver fat content. These results can help to facilitate the diagnosis thereby avoiding other invasive and expensive methods and provide guidance in the management of non-alcoholic liver disease in the early stages.
Abbreviations
NAFLD: Non-alcoholic fatty liver disease; NASH: Non-alcoholic steatohepatitis; ALT: Alanine-amino transferase; AST: Aspartate-amino transferase; GGT: Gamma-Glutamyl transpeptidase; WC: Waist circumference; BMI: Body mass index; TC: Total cholesterol; TG: Triglycerides; CRP: C-reactive protein; FGF-21: Fibroblast growth factor 21; RBP-4: Retinol Binding protein; FLI: Fatty Liver Index; TyG: Triglycerides/glucose ratio; TGs: Triacylglycerols; UHPLC-MS: High performance liquid chromatography and mass spectrometry; IQR: Interquartile range; LSM: Liver stiffness; MRI: Magnetic resonance imaging; Echo-times: TE; Echo-gradient: GRE; ROC: Receiver operating characteristics; HOMA-IR: Homeostatic model assessment of insulin resistance; HOMA-β: Homeostatic model assessment of β-cell function; ROC-AUC: Receiver operating characteristics-Area under the curve.
Acknowledgements
The authors are very grateful to all the participants of the study; the FLiO personnel for their assistance. We want to thank to the Health Department of the Government of Navarra (61/2015), CIBERobn (Physiopathology of Obesity and Nutrition) and to Fundació La Marató de TV3 (201630.10) for their financial support.
Funding
Health Department of the Government of Navarra (61/2015), CIBERobn (Physiopathology of Obesity and Nutrition) and to Fundació La Marató de TV3 (201630.10).
Author Contributions
MAZ, JAM and JAT were responsible for the global design and coordination of the project, and financial management. IC, IA, ME, BAM, JIH, JIM, AB, JQ, AM, MPH, JIU, JAT, JK, JAM and MAZ conceived, designed, and wrote the article. All the authors actively participated in the manuscript preparation, as well as read and approved the final manuscript.
Competing Interests
The authors have declared that no competing interest exists.
References
1. Burt AD, Lackner C, Tiniakos DG. Diagnosis and Assessment of NAFLD: Definitions and Histopathological Classification. Semin Liver Dis. 2015;35(3):207-20
2. Younossi ZM, Koenig AB, Abdelatif D, Fazel Y, Henry L, Wymer M. Global epidemiology of nonalcoholic fatty liver disease-Meta-analytic assessment of prevalence, incidence, and outcomes. Hepatology. 2016;64(1):73-84
3. Yang M, Xu D, Liu Y, Guo X, Li W, Guo C. et al. Combined Serum Biomarkers in Non-Invasive Diagnosis of Non-Alcoholic Steatohepatitis. PLoS One. 2015:10 (6)
4. Serfaty L, Lemoine M. Definition and natural history of metabolic steatosis: clinical aspects of NAFLD, NASH and cirrhosis. Diabetes Metab. 2008;34(6 Pt 2):634-7
5. Milic S, Stimac D. Nonalcoholic fatty liver disease/steatohepatitis: epidemiology, pathogenesis, clinical presentation and treatment. Dig Dis. 2012;30(2):158-62
6. Chalasani N, Younossi Z, Lavine JE, Diehl AM, Brunt EM, Cusi K. et al. The diagnosis and management of non-alcoholic fatty liver disease: practice Guideline by the American Association for the Study of Liver Diseases, American College of Gastroenterology, and the American Gastroenterological Association. Hepatology. 2012;55(6):2005-23
7. Machado MV, Cortez-Pinto H. Management of fatty liver disease with the metabolic syndrome. Expert Rev Gastroenterol Hepatol. 2014;8(5):487-500
8. Otgonsuren M, Estep MJ, Hossain N, Younossi E, Frost S, Henry L. et al. Single non-invasive model to diagnose non-alcoholic fatty liver disease (NAFLD) and non-alcoholic steatohepatitis (NASH). J Gastroenterol Hepatol. 2014;29(12):2006-13
9. Sala M, Kroft LJ, Roell B, van der Grond J, Slagboom PE, Mooijaart SP. et al. Association of liver enzymes and computed tomography markers of liver steatosis with familial longevity. PLoS One. 2014:9 (3)
10. Hagan M, Asrani SK, Talwalkar J. Non-invasive assessment of liver fibrosis and prognosis. Expert Rev Gastroenterol Hepatol. 2015;9(10):1251-60
11. Salas-Salvado J, Rubio MA, Barbany M, Moreno B. [SEEDO 2007 Consensus for the evaluation of overweight and obesity and the establishment of therapeutic intervention criteria]. Med Clin. 2007;128(5):184-96
12. de la Iglesia R, Lopez-Legarrea P, Abete I, Bondia-Pons I, Navas-Carretero S, Forga L. et al. A new dietary strategy for long-term treatment of the metabolic syndrome is compared with the American Heart Association (AHA) guidelines: the MEtabolic Syndrome REduction in NAvarra (RESMENA) project. Br J Nutr. 2014;111(4):643-52
13. Zulet MA, Bondia-Pons I, Abete I, de la Iglesia R, Lopez-Legarrea P, Forga L. et al. The reduction of the metabolyc syndrome in Navarra-Spain (RESMENA-S) study: a multidisciplinary strategy based on chrononutrition and nutritional education, together with dietetic and psychological control. Nutr Hosp. 2011;26(1):16-26
14. Yang BL, Wu WC, Fang KC, Wang YC, Huo TI, Huang YH. et al. External validation of fatty liver index for identifying ultrasonographic fatty liver in a large-scale cross-sectional study in Taiwan. PLoS One. 2015:10 (3)
15. Jiang ZY, Xu CY, Chang XX, Li WW, Sun LY, Yang XB. et al. Fatty liver index correlates with non-alcoholic fatty liver disease, but not with newly diagnosed coronary artery atherosclerotic disease in Chinese patients. BMC Gastroenterol. 2013;13(110):13-110
16. Bedogni G, Bellentani S, Miglioli L, Masutti F, Passalacqua M, Castiglione A. et al. The Fatty Liver Index: a simple and accurate predictor of hepatic steatosis in the general population. BMC Gastroenterol. 2006;6(33):6-33
17. Koehler EM, Schouten JN, Hansen BE, Hofman A, Stricker BH, Janssen HL. External validation of the fatty liver index for identifying nonalcoholic fatty liver disease in a population-based study. Clin Gastroenterol Hepatol. 2013;11(9):1201-4
18. Janghorbani M, Almasi SZ, Amini M. The product of triglycerides and glucose in comparison with fasting plasma glucose did not improve diabetes prediction. Acta Diabetol. 2015;52(4):781-8
19. Alonso C, Fernandez-Ramos D, Varela-Rey M, Martinez-Arranz I, Navasa N, Van Liempd SM. et al. Metabolomic Identification of Subtypes of Nonalcoholic Steatohepatitis. Gastroenterology. 2017;152(6):1449-61
20. Lee SS, Park SH. Radiologic evaluation of nonalcoholic fatty liver disease. World J Gastroenterol. 2014;20(23):7392-402
21. Qayyum A, Nystrom M, Noworolski SM, Chu P, Mohanty A, Merriman R. MRI steatosis grading: development and initial validation of a color mapping system. AJR Am J Roentgenol. 2012;198(3):582-8
22. Dixon WT. Simple proton spectroscopic imaging. Radiology. 1984;153(1):189-94
23. Castera L, Foucher J, Bernard PH, Carvalho F, Allaix D, Merrouche W. et al. Pitfalls of liver stiffness measurement: a 5-year prospective study of 13,369 examinations. Hepatology. 2010;51(3):828-35
24. Tsochatzis EA, Gurusamy KS, Ntaoula S, Cholongitas E, Davidson BR, Burroughs AK. Elastography for the diagnosis of severity of fibrosis in chronic liver disease: a meta-analysis of diagnostic accuracy. J Hepatol. 2011;54(4):650-9
25. Sharma P, Altbach M, Galons JP, Kalb B, Martin DR. Measurement of liver fat fraction and iron with MRI and MR spectroscopy techniques. Diagn Interv Radiol. 2014;20(1):17-26
26. Kukuk GM, Hittatiya K, Sprinkart AM, Eggers H, Gieseke J, Block W. et al. Comparison between modified Dixon MRI techniques, MR spectroscopic relaxometry, and different histologic quantification methods in the assessment of hepatic steatosis. Eur Radiol. 2015;25(10):2869-79
27. Stern C, Castera L. Non-invasive diagnosis of hepatic steatosis. Hepatology International. 2017;11(1):70-8
28. Bril F, Millan L, Kalavalapalli S, McPhaul MJ, Caulfield MP, Martinez-Arranz I. et al. Use of a metabolomic approach to non-invasively diagnose non-alcoholic fatty liver disease in patients with type 2 diabetes mellitus. Diabetes Obes Metab. 2018;12(10):13285
29. Thoma C, Day CP, Trenell MI. Lifestyle interventions for the treatment of non-alcoholic fatty liver disease in adults: a systematic review. J Hepatol. 2012;56(1):255-66
30. Dietrich P, Hellerbrand C. Non-alcoholic fatty liver disease, obesity and the metabolic syndrome. Best Pract Res Clin Gastroenterol. 2014;28(4):637-53
31. Kelly T, Yang W, Chen CS, Reynolds K, He J. Global burden of obesity in 2005 and projections to 2030. Int J Obes. 2008;32(9):1431-7
32. White DL, Kanwal F, El-Serag HB. Association between nonalcoholic fatty liver disease and risk for hepatocellular cancer, based on systematic review. Clin Gastroenterol Hepatol. 2012;10(12):1342-59
33. Martinez SM, Crespo G, Navasa M, Forns X. Noninvasive assessment of liver fibrosis. Hepatology. 2011;53(1):325-35
34. Nguyen D, Talwalkar JA. Noninvasive assessment of liver fibrosis. Hepatology. 2011;53(6):2107-10
35. Hamirani YS, Katz R, Nasir K, Zeb I, Blaha MJ, Blumenthal RS. et al. Association between inflammatory markers and liver fat: The Multi-Ethnic Study of Atherosclerosis. J Clin Exp Cardiolog. 2014;5(10):2155-9880
36. Chen X, Shen T, Li Q, Li Y, Li D, Chen G. et al. Retinol Binding Protein-4 Levels and Non-alcoholic Fatty Liver Disease: A community-based cross-sectional study. Sci Rep. 2017:7 (45100)
37. Cuthbertson DJ, Weickert MO, Lythgoe D, Sprung VS, Dobson R, Shoajee-Moradie F. et al. External validation of the fatty liver index and lipid accumulation product indices, using 1H-magnetic resonance spectroscopy, to identify hepatic steatosis in healthy controls and obese, insulin-resistant individuals. Eur J Endocrinol. 2014;171(5):561-9
38. Hannah WN Jr, Harrison SA. Noninvasive imaging methods to determine severity of nonalcoholic fatty liver disease and nonalcoholic steatohepatitis. Hepatology. 2016;64(6):2234-43
39. Idilman IS, Keskin O, Celik A, Savas B, Elhan AH, Idilman R. et al. A comparison of liver fat content as determined by magnetic resonance imaging-proton density fat fraction and MRS versus liver histology in non-alcoholic fatty liver disease. Acta Radiol. 2016;57(3):271-8
40. Webb M, Yeshua H, Zelber-Sagi S, Santo E, Brazowski E, Halpern Z. et al. Diagnostic value of a computerized hepatorenal index for sonographic quantification of liver steatosis. AJR Am J Roentgenol. 2009;192(4):909-14
41. Colli A, Fraquelli M, Prati D, Riva A, Berzuini A, Conte D. et al. Deciding on Interferon-Free Treatment for Chronic Hepatitis C: Updating Liver Stiffness Cut-Off Values to Maximize Benefit. PLoS One. 2016:11 (10)
42. Orlacchio A, Bolacchi F, Antonicoli M, Coco I, Costanzo E, Tosti D. et al. Liver elasticity in NASH patients evaluated with real-time elastography (RTE). Ultrasound Med Biol. 2012;38(4):537-44
43. Hashemi SA, Alavian SM, Gholami-Fesharaki M. Assessment of transient elastography (FibroScan) for diagnosis of fibrosis in non-alcoholic fatty liver disease: A systematic review and meta-analysis. Caspian J Intern Med. 2016;7(4):242-52
44. Herrero JI, Inarrairaegui M, D'Avola D, Sangro B, Prieto J, Quiroga J. [Comparison of the M and XL FibroScan((R)) probes to estimate liver stiffness by transient elastography]. Gastroenterol Hepatol. 2014;37(4):233-9
45. Huh JH, Kim KJ, Kim SU, Han SH, Han KH, Cha BS. et al. Obesity is more closely related with hepatic steatosis and fibrosis measured by transient elastography than metabolic health status. Metabolism. 2017;66:23-31
46. Tilg H, Moschen AR, Roden M. NAFLD and diabetes mellitus. Nat Rev Gastroenterol Hepatol. 2017;14(1):32-42
47. Meex RCR, Watt MJ. Hepatokines: linking nonalcoholic fatty liver disease and insulin resistance. Nat Rev Endocrinol. 2017;13(9):509-20
48. Byrne CD, Targher G. NAFLD: a multisystem disease. J Hepatol. 2015;62(1 Suppl):012
49. Loomba R, Abraham M, Unalp A, Wilson L, Lavine J, Doo E. et al. Association between diabetes, family history of diabetes, and risk of nonalcoholic steatohepatitis and fibrosis. Hepatology. 2012;56(3):943-51
50. Asrih M, Jornayvaz FR. Metabolic syndrome and nonalcoholic fatty liver disease: Is insulin resistance the link? Mol Cell Endocrinol. 2015;1:55-65
51. Verma S, Jensen D, Hart J, Mohanty SR. Predictive value of ALT levels for non-alcoholic steatohepatitis (NASH) and advanced fibrosis in non-alcoholic fatty liver disease (NAFLD). Liver Int. 2013;33(9):1398-405
52. Purcell M, Flores YN, Zhang ZF, Denova-Gutierrez E, Salmeron J. Prevalence and predictors of alanine aminotransferase elevation among normal weight, overweight and obese youth in Mexico. J Dig Dis. 2013;14(9):491-9
53. Karlas T, Petroff D, Garnov N, Bohm S, Tenckhoff H, Wittekind C. et al. Non-invasive assessment of hepatic steatosis in patients with NAFLD using controlled attenuation parameter and 1H-MR spectroscopy. PLoS One. 2014:9 (3)
54. Erkan G, Sayin I, Polat FB, Corakci A, Atac GK, Degertekin H. The relationship between insulin resistance, metabolic syndrome and nonalcoholic fatty liver disease in non-obese non-diabetic Turkish individuals: A pilot study. Turk J Gastroenterol. 2014;1:63-8
55. Coban M, Sertoglu E, Kayadibi H. Can indirect non-invasive markers or models replace liver biopsy?: Liver Int. 2015 Feb;35(2):681-2. doi: 10.1111/liv.12686. Epub. 2014 Oct 8
Author contact
![]() Corresponding author: jalfmtzes Centre for Nutrition Research. Department of Nutrition, Food Science and Physiology. University of Navarra, Irunlarrea 1, Pamplona 31008. Phone: [+34]948-42-56-00 [ext-806317]
Corresponding author: jalfmtzes Centre for Nutrition Research. Department of Nutrition, Food Science and Physiology. University of Navarra, Irunlarrea 1, Pamplona 31008. Phone: [+34]948-42-56-00 [ext-806317]