International Journal of Medical Sciences
ISSN: 1449-1907
3.2
Impact Factor
ISSN: 1449-1907
- Current Issue
- Volume 22; 2025
- Volume 21; 2024
- Volume 20; 2023
- Volume 19; 2022
- Volume 18; 2021
- Archive
- Editorial Board
- Cover Images
- Index & Coverage
- Cover Suggestion
- Special Issues
Top
Introduction
Materials and methods
Results
Discussion
Abbreviations
Supplementary Material
Acknowledgements
References
Introduction
Materials and methods
Results
Discussion
Abbreviations
Supplementary Material
Acknowledgements
References

 Global reach, higher impact
Int J Med Sci 2018; 15(14):1667-1675. doi:10.7150/ijms.28503 This issue Cite
Research Paper
Infrequent Feeding of Restricted Amounts of Food Induces Stress and Adipose Tissue Inflammation, Contributing to Impaired Glucose Metabolism
Young-Sun Lee1 ![]() , Changmi Lee1, Hee-Sook Jun1,2,3
, Changmi Lee1, Hee-Sook Jun1,2,3
1. Lee Gil Ya Cancer and Diabetes Institute, Gachon University, 7-45 Songdo-dong, Yeonsu-ku, Incheon 406-840 Korea
2. College of Pharmacy and Gachon Institute of Pharmaceutical Science, Gachon University, 7-45 Songdo-dong, Yeonsu-ku, Incheon 406-840 Korea
3. Gachon Medical Research Institute, Gil Hospital, Incheon, 405-760 Korea
Received 2018-7-13; Accepted 2018-10-13; Published 2018-11-5
Citation:
Lee YS, Lee C, Jun HS. Infrequent Feeding of Restricted Amounts of Food Induces Stress and Adipose Tissue Inflammation, Contributing to Impaired Glucose Metabolism. Int J Med Sci 2018; 15(14):1667-1675. doi:10.7150/ijms.28503. https://www.medsci.org/v15p1667.htm
Other stylesAbstract
Food restriction has been recommended as an effective strategy for body weight loss. However, food restriction can alter biological rhythms and leads to physiological stress. However, relatively little is known about the physiological impact of different methods of food restriction. Therefore, we investigated whether different schedules of restricted food intake induce physiological stress and then contribute to glucose metabolism disorder. C57BL/6 mice were fed a high fat diet (60% fat) for 8 weeks and then randomly divided into three groups: the control group was continuously fed the high fat diet; the two food restriction groups were fed 50% of food consumed by the control mice with one group (FR1) being fed the full amount once a day and the other group (FR2) being fed the same total amount as FR1 twice a day for 3 days. We found increased body weight loss, the serum triglyceride levels, the expression of lipolysis-related genes, and serum corticosterone levels in the FR1 group compared with the FR2 group. The immune cell population infiltrating the adipose tissue and the expression of monocyte chemoattractant protein (MCP-1) and toll-like receptor (TLR-4) mRNA were increased in the FR1 group compared with the control. To determine whether long-term dietary manipulation is associated with metabolic disorders, mice were fed a restricted diet for 3 days alternating with an unrestricted diet for the following 4 days and this was repeated for 8 weeks. The alternating FR1 group showed impaired glucose tolerance compared with the alternating FR2 group. These results indicate that infrequent feeding of restricted amounts of food could induce stress hormones, lipolysis, adipose tissue immune cell infiltration and inflammation, which in turn may promote glucose metabolism disorder.
Keywords: Food restriction, stress, body weight, glucose metabolism, infrequent feeding
Introduction
Obesity prevalence has increased over the world. Obesity has been identified as a risk factor for diabetes, cardiovascular disease, and many other diseases. Weight loss is the first-line recommendation to reduce obesity. Food restriction has been suggested as an effective therapeutic strategy for weight loss. Many studies have shown that food restriction can alter biological rhythms [1-3] and leads to physiological stress [4]. Thus, proper food quantity and frequency are crucial for maintaining a healthy condition [5].
Stressful events are known to activate the hypothalamo-pituitary-adrenocortical axis, which results in increased plasma concentration of glucocorticoids, the “stress hormones” [6]. The effects of glucocorticoids on body weight and lipid metabolism are controversial: some studies show that glucocorticoids reduce body weight and stimulate lipolysis [7, 8], while others show an increase of body weight and lipogenesis [9, 10]. This difference may depend on the glucocorticoid concentrations and duration of exposure [11]. In addition, glucocorticoid treatments can induce insulin resistance in healthy individuals [12, 13].
Obesity is associated with the accumulation of immune cells in adipose tissue, which contributes to the development of metabolic disorders [14, 15]. Interestingly, weight loss is also associated with recruitment of immune cells in adipose tissue. Fasting or pharmacologically induced lipolysis increases adipose tissue macrophage (ATM) accumulation in adipose tissue [16, 17]. Inflammation and metabolic disease have been shown to be linked, and pro-inflammatory factors are involved in the pathogenesis of type 2 diabetes [18].
Although food restriction is strongly recommended to reduce body weight, relatively little is known about the physiological impact of different methods of food restriction. Thus, we investigated whether different schedules of restricted food intake induce stress hormones and infiltration of immune cells in adipose tissue, contributing to glucose metabolic disorder. Our data showed that infrequent feeding of restricted food amounts, as compared with more frequent feedings of the same amount of restricted food, induced stress, lipolysis, and accumulation of adipose tissue immune cells in mice, which may contribute to disorders of glucose metabolism.
Materials and methods
Animals
C57BL/6 mice were obtained from the Orient Bio INC. (Gyeonggi, Korea) and maintained in specific pathogen-free conditions at the animal facility at Gachon University under a 12 h light:12 h dark photoperiod. Animals were freely fed with a high fat diet containing 60% lipid (Research Diets Inc, New Brunswick, NJ) for 8 weeks (diet-induced obesity (DIO) mice) and then randomly divided into three groups: the control group was continuously fed the 60% high fat diet; the two food restriction groups were fed 50% of the mean amount of food consumed by the control mice with one group being fed that amount (50%) once a day (FR1; fed at 9:00 AM) and the other group being fed the same amount divided into two portions (2 × 25%) given twice a day (FR2; fed at 9:00 AM and 9:00 PM) for 3 days. To examine the effects of long-term, dietary restriction, DIO mice were given restricted food as for the FR1 and FR2 protocols for 3 days, and then food was unrestricted for the following 4 days. The alternating restricted/unrestricted diet was given for a total of 8 weeks. All animal experiments were carried out under a protocol approved by the Institutional Animal Care and Use Committee at the Gachon University.
Measurement of body weight
Body weight was measured before food restriction and 1, 2, and 3 days thereafter.
Histological staining of adipose tissue
Mice were sacrificed at 3 days after food restriction, and visceral adipose tissue was removed, fixed in 10% formalin, and embedded in paraffin. To detect histological changes in the adipose tissue, paraffin-embedded sections were stained with hematoxylin and eosin.
Isolation of stromal vascular cells and adipocyte infiltrated immune cells
Visceral adipose tissue was removed, cut with scissors into small pieces, and digested with 1 mg/ml collagenase type 2 (Sigma, NY, USA) for 30 min at 37°C. Stromal vascular cells were collected as a pellet after centrifugation at 1500 rpm for 5 min. Immune cells infiltrating the adipose tissue were isolated by Ficoll density gradient centrifugation [19, 20].
Real-time quantitative PCR (RT-qPCR)
Total RNA was isolated from the adipose tissue or hypothalamus of food-restricted mice or adipose tissue from corticosterone-treated DIO mice, and cDNA was synthesized using the PrimeScript first-strand cDNA synthesis kit (TaKaRa Bio, Inc., Otsu, Japan). PCR was carried out in a 7900HT fast real-time PCR system (Applied Biosystems, Carlsbad, CA) at 95°C for 10 min, followed by 40 cycles at 95°C for 15 s, 60°C for 1 min. As an internal control, cyclophilin mRNA was amplified. The sequences of the primer pairs are shown in Supplementary Table 1.
The relative copy number was calculated using the threshold crossing point (Ct) as calculated by the 7900HT fast real-time PCR software combined with the delta delta Ct calculations.
Triglyceride and corticosterone analysis
After 3 days of food restriction, mice were sacrificed between 8-10 AM., and blood samples were collected. Serum triglyceride and corticosterone levels were measured by a triglyceride assay kit (Asan Pharmaceutical Co. Ltd., Seoul, Korea) and corticosterone ELISA assay kit (Enzo Life Sciences, Plymoth meeting, PA, USA).
3T3-L1 cell differentiation and treatment
3T3-L1 pre-adipocytes were cultured for 2 days in 6-well plates (1.0 × 10⁵ cells per well) at 37°C in Dulbecco's modified Eagle's medium containing 1% penicillin-streptomycin solution (Gibco, Gaithersburg, MD) and 10% FBS. The cells were then induced to differentiate in medium containing 1 μM dexamethasone, 5 μg/ml insulin and 0.5 mM 3-isobutyl-1-methylxantine as described previously [21, 22]. Differentiated 3T3-L1 adipocytes were treated with various doses of corticosterone for 24 h.
Corticosterone treatment via an osmotic minipump
Male C57BL/6 mice were fed a high-fat diet (60% energy by fat) for 8 weeks. Animals were treated either with corticosterone (15 μg h-1; Sigma) via an osmotic minipump (Alzet Model 1003D) or PBS for 3 days.
Glucose and insulin tolerance tests
After 3 days of food restriction or 8 weeks of the alternating restricted/non-restricted diet, mice were not fed for 6 h, and then a glucose solution (2 g kg-1 body weight) was injected intraperitoneally. Blood glucose levels were measured using a glucometer at 0, 30, 60, and 90 min after glucose injection. For insulin tolerance tests, mice were not fed for 4 h and were injected with insulin (2 units kg-1 body weight, i.p.), and blood glucose levels were measured using a glucometer at 0, 30, 60, and 90 min after insulin injection.
Statistical analysis
Data are presented as means ±SEM. Statistical significance was analyzed by unpaired Student's t-test for comparison of two groups or ANOVA followed by Fisher's protected least significant difference test for multiple groups. P<0.05 was accepted as significant.
Figure 1
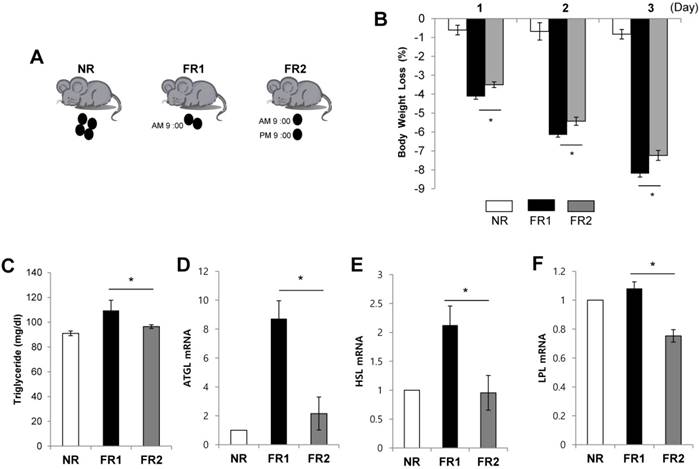
Increased body weight loss and lipolysis in the infrequently fed, food-restricted (FR1) group. (A) C57BL/6 mice were fed a high fat diet (60% fat) for 8 weeks and randomly divided into three groups: the control group (non-restriction : NR) continued to be fed the high fat diet, and the food restriction groups were fed 50% of the mean amount of food consumed by the control mice with one group being fed 50% once a day (FR1; fed at 9:00 AM) and the other group being fed the same amount divided into two portions (2 × 25%) twice a day (FR2; fed at 9:00 AM and 9:00 PM) for 3 days. (B) Body weight was monitored. (C-F) At 3 days after food restriction, (C) serum triglyceride level was measured and visceral adipose tissue was removed from food-restricted mice and the expression of (D) ATGL, (E) HSL, and (F) LPL mRNA was measured by RT-qPCR and normalized by cyclophilin expression. * P<0.05 compared with FR2 group (n=5 per group). Data are means ±SEM.
Results
Increased body weight loss and lipolysis in the infrequently fed, food-restricted (FR1) group
To investigate the effects of frequency of restricted food intake on body weight loss, we first induced obesity in mice by feeding a high fat diet for 8 weeks and then randomly divided them into three groups. The control group continued to receive the high fat diet, the second group (FR1) received 50% of the mean amount of food consumed by the control mice once a day, and the third group (FR2) received 50% of the mean amount of food consumed by the control mice divided into two portions fed twice a day (Fig. 1A). For 3 days following the change to the new diets, we monitored body weight in the morning (9:00 AM). Both food restricted groups showed significantly decreased body weight compared with control group. Interestingly, in spite of same amount food restriction (50%), the FR1 group showed more body weight loss compared with the FR2 group (Fig. 1B). To determine whether the increased weight loss in the FR1 group relative to the FR2 group was due to increased lipolysis, we measured the serum triglyceride level and the expression of lipolysis genes in the visceral adipose tissue. The serum triglyceride level and the expression of adipose triglyceride lipase (ATGL), hormone-sensitive lipase (HSL), and lipoprotein lipase (LPL) mRNA were significantly increased in FR1 group compared to FR2 group (Fig. 1C-F).
Increased infiltrated adipose tissue immune cells and inflammatory cytokine gene expression in the infrequently fed, food-restricted (FR1) group
Because weight loss is associated with recruitment of ATMs [17], we determined whether restricted food feeding frequency affects infiltration of immune cells in adipose tissue. We prepared sections of visceral adipose tissue after 3 days of food-restriction, and stained them with hematoxylin and eosin (Fig. 2A). We found that the size of adipocyte was reduced and infiltrated immune cells increased in food-restricted group. When we isolated and counted the number of cells infiltrating the adipose tissue, we found that the number of infiltrated immune cells was significantly increased in FR1 group compared with control mice. However, in the FR2 group, the number of infiltrated immune cells was not significantly different from the control group (Fig. 2B). Next, we examined whether the gene expression of pro-inflammatory adipokines or chemokines was induced in the adipose tissue of the food-restriction groups. We found that mRNA expression of monocyte chemoattractant protein-1 (MCP-1) and toll-like receptor-4 (TLR-4) were significantly increased in FR1 mice compared with control mice, and the mRNA expression of interleukin-6 (IL-6) and tumor necrosis factor-α (TNF-α) showed a near-significant increase compared with the control. However, in the FR2 group, the transcripts of MCP-1 and TLR-4 were similar to the control, and the mRNA expression of IL-6 and TNF-α was significantly decreased compared with the FR1 (Fig. 2C-F).
Figure 2
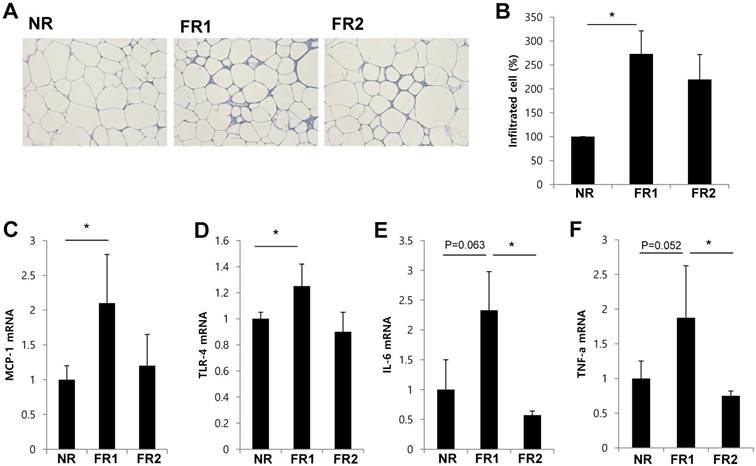
Increased infiltrated adipose tissue immune cells and inflammatory cytokine gene expression in the infrequently fed, food-restricted (FR1) group. Visceral adipose tissue was removed from food-restricted mice after 3 days of food restriction. (A) Visceral adipose tissue sections were prepared and stained by hematoxylin and eosin. (B) Immune cells were isolated from visceral adipose tissue and counted. The fold change was calculated as ratio of the NR group. * P<0.05 compared with NR group. Data are means ±SEM. (C-F) The expression of MCP-1, TLR-4, IL-6, and TNF-α mRNA in visceral adipose tissue was measured by RT-qPCR and normalized by cyclophilin expression (n=3-5 per group). Data are means ±SD. * P < 0.05 compared with NR or FR2 group.
Figure 3
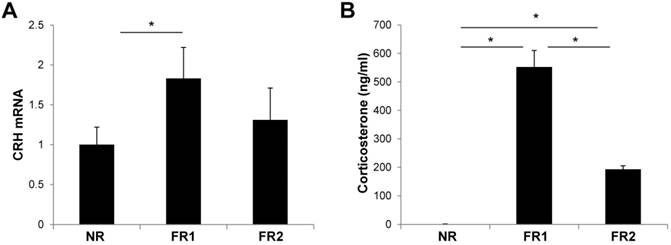
Increase of CRH gene expression and serum corticosterone levels in the infrequently fed, food-restricted (FR1) group. Hypothalami and serum were harvested from food-restricted and control mice after 3 days of food restriction. (A) The expression of CRH mRNA was measured by RT-qPCR in the hypothalamus and normalized by cyclophilin expression. (B) Serum corticosterone levels were measured by ELISA. N=5 per group. Data are means ±SEM. * P < 0.05 compared with NR or FR2 group.
Increased corticotrophin-releasing hormone (CRH) gene expression and serum corticosterone levels in the infrequently fed, food-restricted (FR1) group
To determine whether food restriction induces stress in the body, we examined the hypothalamic expression of CRH mRNA, which is a peptide hormone and neurotransmitter involved in the stress response. The expression of CRH mRNA was significantly increased in the hypothalamus of the FR1 group compared with control mice at 3 days (Fig. 3A). However, in the FR2 group, the expression of CRH mRNA was not significantly different from the control group. In addition, we measured serum corticosterone levels at 3 days after food-restriction, which is the main glucocorticoid involved in the regulation of stress responses. The corticosterone level was increased in both FR1 and FR2 groups compared with control mice, but the corticosterone level in the FR1 group was significantly higher compared with the FR2 group (Fig. 3B).
Corticosterone increases the expression of ATGL in 3T3-L1 adipocytes and DIO mice
As food restriction increased serum corticosterone levels and the expression of lipolysis related genes, we examined the expression of lipolysis genes in corticosterone-treated 3T3-L1 adipocytes. The expression of ATGL mRNA was significantly increased dose dependently in 3T3-L1 adipocytes (Fig. 4A). However, the expression of HSL mRNA was decreased and the LPL mRNA expression was not changed by corticosterone treatment in 3T3-L1 adipocytes (Fig. 4B,C). To determine the effect of corticosterone in vivo, DIO mice were treated with PBS or corticosterone (15 ug h-1 via an osmotic minipump, subcutaneously) for 3 days. Visceral adipose tissue was isolated, and the expression of lipolysis-related genes was analyzed by qRT-PCR. The expression of ATGL mRNA was significantly increased in corticosterone-infused DIO mice compared with PBS-infused mice (Fig. 4D). The expression of HSL or LPL mRNA was not significantly changed by corticosterone treatment (Fig. 4E,F).
Corticosterone impairs blood glucose levels and insulin tolerance in DIO mice
To determine whether stress hormone impairs glucose metabolism, we measured the blood glucose levels (at 9:00 AM) in corticosterone-infused DIO mice for 3 days. The blood glucose levels in corticosterone-treated mice gradually increased over the 3 days, reaching significance on the third day compared with PBS-infused DIO mice (Fig. 5A).
To address whether stress hormone impairs insulin sensitivity, we performed insulin tolerance tests after 3 days of corticosterone infusion. Corticosterone-infused DIO mice showed an impaired reduction in glucose levels in response to exogenous insulin at 30, 60, and 90 min following insulin injection as compared with PBS-infused DIO mice (Fig. 5B).
Increased glucose intolerance in the infrequently fed, food-restricted (FR1) group
To determine how blood glucose levels are controlled in the FR1 and FR2 groups, we performed intraperitoneal glucose and insulin tolerance tests after 3 days of food restriction. Blood glucose levels were not significantly different between FR1 and FR2 mice for both the glucose tolerance test (Fig. 6A,B) and the insulin tolerance test (Fig. 6C,D). To determine whether long-term dietary manipulation is associated with metabolic disorders in DIO mice, we restricted food as for the FR1 and FR2 protocols for 3 days, and then food was unrestricted for the following 4 days. The alternating restricted/non-restricted diet was given for a total of 8 weeks. After 8 weeks, we performed intraperitoneal glucose and insulin tolerance tests in the FR1 and FR2 groups. We found that the alternating FR1 group showed an impaired reduction in glucose levels following glucose injection compared with the FR2 group (Fig. 6E,F); and showed a tendency of an impaired reduction in glucose levels following the insulin tolerance test compared with the FR2 group (Fig. 6G,H). These results suggest that long-term dietary manipulation such as the alternating restricted/non-restricted diet may contribute to the impaired glucose metabolism.
Figure 4
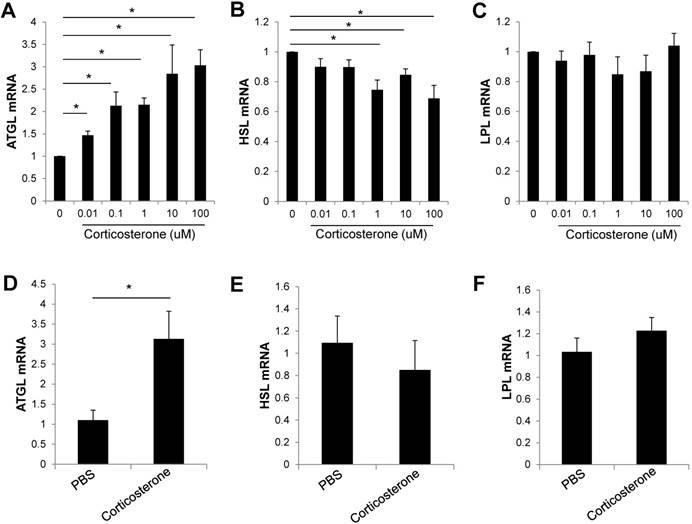
Corticosterone increased ATGL gene expression in 3T3-L1 adipocytes and DIO mice. (A-C) 3T3-L1 adipocytes were incubated with the indicated doses of corticosterone for 24 h. The expression of (A) ATGL, (B) HSL, and (C) LPL mRNA was analyzed by RT-qPCR. Data are mean ±SEM. * P < 0.05 compared with untreated cells. Results are representative of three independent experiments. (D-F) DIO mice were treated with vehicle or corticosterone (15 μg h-1 via an osmotic minipump, subcutaneously) for 3 days, and the expression of lipolysis-related genes was analyzed by RT-qPCR. N=5 per group. Data are mean ±SEM. * P < 0.05 compared with PBS-treated mice.
Figure 5
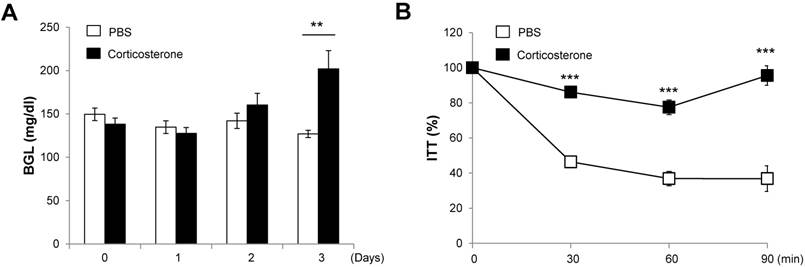
Corticosterone impairs blood glucose levels and insulin tolerance in DIO mice. DIO mice were treated with vehicle or corticosterone (15 μg h-1 via an osmotic minipump, subcutaneously) for 3 days, and (A) blood glucose levels were measured. (B) Three days later, mice were not fed for 4 h and injected with insulin, and blood glucose levels were measured. Data are expressed as a percentage of the initial blood glucose level before insulin injection. N=5 per group. Data are mean ±SEM. ** P < 0.01 and *** P < 0.001 compared with PBS-treated mice.
Figure 6
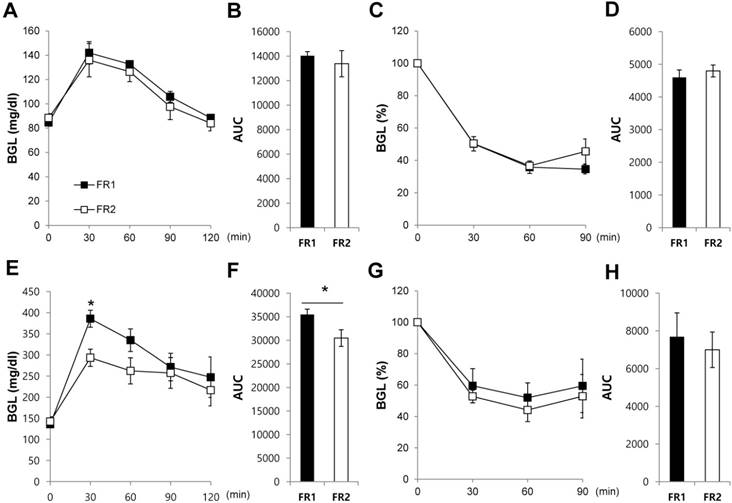
Increased impaired glucose tolerance in the infrequently fed, food-restricted (FR1) group. (A-D) After 3 days of food restriction, we performed (A, B) intraperitoneal glucose tolerance tests and (C,D) insulin tolerance tests. Data are expressed as a percentage of the initial blood glucose level before insulin injection. (E-H) DIO mice were given restricted amounts of food for 3 days following either the FR1 or FR2 protocol, and then food was unrestricted for the following 4 days, repeated for 8 weeks. (E, F) Intraperitoneal glucose tolerance tests and (G, H) insulin tolerance tests were performed. Data are expressed as a percentage of the initial blood glucose level before insulin injection. N=3-4 per group. Data are mean ±SEM. * P < 0.05 compared with the FR2 group.
Discussion
Obesity is characterized by excess accumulation of body fat and associated with increases risk of many health problems such as insulin resistance, type 2 diabetes, and heart disease. Thus, weight loss has been a concern for people, and the prevalence of food restriction as a method to combat obesity continues to rise worldwide.
The pattern of meal frequency is associated with body weight [23, 24]. Several studies have shown that frequent feeding increases the exposure of food in the gut and delays gastric emptying of a subsequent meal, thus inducing satiety [25, 26]. Although food restriction has been recommended to reduce obesity, relatively little is known about the effect of eating frequency when food is restricted. Thus, the aim of this study was to investigate the effect of feeding frequencies of a reduced isocaloric diet on body weight loss, stress hormones, inflammation, glucose metabolism, and insulin sensitivity.
In this study, food (high fat diet) was restricted to 50% of that consumed by the control group, and feeding frequency was either once (FR1) or twice (FR2) per day. During 3 days of restricted feeding, the FR1 group showed significantly reduced body weight and significantly increased the serum triglyceride level and expression of lipolysis-related genes such as ATGL, HSL, and LPL mRNA compared with the FR2 group. This suggests that infrequent feeding reduced body weight by induction of lipolysis in the visceral adipose tissue, compared with more frequent feeding.
Obesity is known to be associated with chronic, low-grade inflammation [27, 28]. ATMs infiltrating adipose tissue produce proinflammatory molecules, including TNF-α, IL-6, and MCP-1 [29] and induce local and systemic inflammation and metabolic syndrome including insulin resistance, which is associated with type 2 diabetes [30]. Interestingly, weight loss also induces ATM accumulation, which is associated with increased circulating free fatty acid (FFA) concentrations and adipose tissue lipolysis [17]. Thus, we examined whether the infiltration of immune cells was increased in the food-restricted groups. We found that the proportion of infiltrated cells and the expression of pro-inflammatory cytokines were significantly increased in the adipose tissue of the FR1 group, but not the FR2 group, compared with the control group. It suggests that a low feeding frequency of restricted food amounts caused increased lipolysis, accumulation of immune cells, and pro-inflammation in adipose tissue compared with a higher feeding frequency of the same amount of food.
CRH plays an important role in the stress response by regulating the synthesis and release of adrenocorticotropic hormone from the pituitary, which subsequently stimulates the release of glucocorticoids from the adrenal cortex [31, 32]. Thus, we measured CRH expression and corticosterone levels in each experimental group. The CRH mRNA expression and the serum corticosterone level were increased in the FR1 group compared with FR2 group, suggesting that infrequent feeding constitutes a higher stress condition.
The effect of stress hormones in lipid metabolism has been controversial. The stress hormones have been shown to have a dual role in lipolytic and lipogenic action, depending on the exposure time, concentration, type of stress hormones, and experimental model system [7, 33, 34]. In this study, the FR1 group showed increased corticosterone levels in the serum, reduced body weight and increased the expression of lipolysis genes. Thus, to examine whether stress hormones directly induce lipolysis in adipocytes, we examined the expression of lipolysis-related genes in response to corticosterone treatment in vitro and in vivo. The expression of ATGL mRNA was dose dependently increased in corticosterone-treated, fully differentiated 3T3-L1 adipocytes and also increased in the visceral adipose tissue of DIO mice infused with corticosterone via an osmotic mini-pump. Stress hormones can alter glucose levels and insulin sensitivity [35]. Since the FR1 group showed an increase in the expression of CRH mRNA and secretion of corticosterone, we investigated whether glucose metabolism or insulin sensitivity was affected by the feeding frequency. We found no difference in the glucose or insulin tolerance between the FR1 and FR2 groups at 3 days after food restriction. To determine whether a longer period of dietary manipulation would affect glycemic control, mice were given a restricted diet for 3 days (either FR1 or FR2) alternating with an unrestricted diet for 4 days, repeated for 8 weeks. In this case, the FR1 group did show impaired glucose tolerance compared with the FR2 group and a weak tendency of impaired insulin tolerance compared with the FR2 group. It suggests that glycemic control may be affected by long period of infrequent eating pattern.
In conclusion, our results show that infrequent feeding coupled with food restriction increases body weight loss, lipolysis related gene expression, the number of infiltrated adipose tissue immune cells, and inflammatory cytokine gene expression in the adipose tissues compared with more frequent feeding of the same restricted amount of food. The severe food restriction induced an increase of stress hormone levels, and this was exacerbated by infrequent feeding. In addition, when food restriction coupled with infrequent feeding was repeated in 3-day bouts over many weeks, impairments of glucose metabolism were seen compared with more frequent feeding. Therefore, proper food frequency is important for a healthy condition, especially to reduce body weight, more frequent eating pattern of the same amount of restricted food may be helpful eating pattern for health than infrequent eating.
Abbreviations
ATGL: adipose triglyceride lipase; ATM: adipose tissue macrophage; CRH: corticotrophin-releasing hormone; DIO: diet-induced obesity; FR: food-restricted; HSL: hormone-sensitive lipase; IL-6: interleukin-6; LPL: lipoprotein lipases; MCP-1: monocyte chemoattractant protein-1; TLR-4: toll-like receptor-4; TNF-α: tumor necrosis factor-α.
Supplementary Material
Supplementary table S1.
Acknowledgements
We thank Dr. Ann Kyle for editorial assistance.
Funding
This study was supported by the grant from the Ministry of Science, ICT and Future Planning (2012R1A1A3014451) and Basic Science Research Program through the National Research Foundation of Korea (NRF) funded by the Ministry of Education (NRF-2015R1D1A1A01060232 and NRF-2018R1D1A1B07048223).
Author Contributions
Y-S Lee contributed to conception, design of the study, researched data and wrote the manuscript. C Lee researched data. H-S Jun contributed to conception and design of the study.
Competing Interests
The authors have declared that no competing interest exists.
References
1. Ma Y, Bertone ER, Stanek EJ 3rd, Reed GW, Hebert JR, Cohen NL. et al. Association between eating patterns and obesity in a free-living US adult population. American journal of epidemiology. 2003;158:85-92
2. Mekary RA, Giovannucci E, Willett WC, van Dam RM, Hu FB. Eating patterns and type 2 diabetes risk in men: breakfast omission, eating frequency, and snacking. The American journal of clinical nutrition. 2012;95:1182-9
3. Thomas EA, Higgins J, Bessesen DH, McNair B, Cornier MA. Usual breakfast eating habits affect response to breakfast skipping in overweight women. Obesity (Silver Spring). 2015
4. Heiderstadt KM, McLaughiin RM, Wright DC, Walker SE, Gomez-Sanchez CE. The effect of chronic food and water restriction on open-field behaviour and serum corticosterone levels in rats. Lab Anim. 2000;34:20-8
5. Han JM, Kim HG, Lee JS, Choi MK, Kim YA, Son CG. Repeated sense of hunger leads to the development of visceral obesity and metabolic syndrome in a mouse model. PloS one. 2014;9:e98276
6. Axelrod J, Reisine TD. Stress hormones: their interaction and regulation. Science. 1984;224:452-9
7. Xu C, He JH, Jiang HF, Zu LX, Zhai WJ, Pu SS. et al. Direct Effect of Glucocorticoids on Lipolysis in Adipocytes. Mol Endocrinol. 2009;23:1161-70
8. Liu XY, Shi JH, Du WH, Fan YP, Hu XL, Zhang CC. et al. Glucocorticoids decrease body weight and food intake and inhibit appetite regulatory peptide expression in the hypothalamus of rats. Exp Ther Med. 2011;2:977-84
9. Zakrzewska KE, Cusin I, Stricker-Krongrad A, Boss O, Ricquier D, Jeanrenaud B. et al. Induction of obesity and hyperleptinemia by central glucocorticoid infusion in the rat. Diabetes. 1999;48:365-70
10. Chen HL, Romsos DR. A Single Intracerebroventricular Injection of Dexamethasone Elevates Food-Intake and Plasma-Insulin and Depresses Metabolic Rates in Adrenalectomized Obese (Ob/Ob) Mice. J Nutr. 1995;125:540-5
11. Campbell JE, Ceddia R, Hawke T, Riddell M. Glucocorticoids: Lipolytic or Lipogenic?. Faseb J. 2008:22
12. Zhou PZ, Zhu YM, Zou GH, Sun YX, Xiu XL, Huang X. et al. Relationship Between Glucocorticoids and Insulin Resistance in Healthy Individuals. Medical science monitor: international medical journal of experimental and clinical research. 2016;22:1887-94
13. Clore JN, Thurby-Hay L. Glucocorticoid-induced hyperglycemia. Endocrine practice: official journal of the American College of Endocrinology and the American Association of Clinical Endocrinologists. 2009;15:469-74
14. Huh JY, Park YJ, Ham M, Kim JB. Crosstalk between Adipocytes and Immune Cells in Adipose Tissue Inflammation and Metabolic Dysregulation in Obesity. Mol Cells. 2014;37:365-71
15. Boutens L, Stienstra R. Adipose tissue macrophages: going off track during obesity. Diabetologia. 2016;59:879-94
16. Red Eagle A, Chawla A. In obesity and weight loss, all roads lead to the mighty macrophage. The Journal of clinical investigation. 2010;120:3437-40
17. Kosteli A, Sugaru E, Haemmerle G, Martin JF, Lei J, Zechner R. et al. Weight loss and lipolysis promote a dynamic immune response in murine adipose tissue. The Journal of clinical investigation. 2010;120:3466-79
18. Ouchi N, Parker JL, Lugus JJ, Walsh K. Adipokines in inflammation and metabolic disease. Nat Rev Immunol. 2011;11:85-97
19. Bories G, Caiazzo R, Derudas B, Copin C, Raverdy V, Pigeyre M. et al. Impaired alternative macrophage differentiation of peripheral blood mononuclear cells from obese subjects. Diabetes & vascular disease research. 2012;9:189-95
20. Watkins SK, Zhu Z, Watkins KE, Hurwitz AA. Isolation of immune cells from primary tumors. Journal of visualized experiments: JoVE. 2012 e3952
21. Rotter V, Nagaev I, Smith U. Interleukin-6 (IL-6) induces insulin resistance in 3T3-L1 adipocytes and is, like IL-8 and tumor necrosis factor-alpha, overexpressed in human fat cells from insulin-resistant subjects. J Biol Chem. 2003;278:45777-84
22. Ajuwon KM, Spurlock ME. Palmitate activates the NF-kappaB transcription factor and induces IL-6 and TNFalpha expression in 3T3-L1 adipocytes. J Nutr. 2005;135:1841-6
23. Toschke AM, Kuchenhoff H, Koletzko B, von Kries R. Meal frequency and childhood obesity. Obes Res. 2005;13:1932-8
24. Nicklas TA, Yang SJ, Baranowski T, Zakeri I, Berenson G. Eating patterns and obesity in children - The Bogalusa Heart Study. Am J Prev Med. 2003;25:9-16
25. Jackson SJ, Leahy FE, Jebb SA, Prentice AM, Coward WA, Bluck LJC. Frequent feeding delays the gastric emptying of a subsequent meal. Appetite. 2007;48:199-205
26. Smeets AJ, Westerterp-Plantenga MS. Acute effects on metabolism and appetite profile of one meal difference in the lower range of meal frequency. Brit J Nutr. 2008;99:1316-21
27. Shoelson SE, Lee J, Goldfine AB. Inflammation and insulin resistance (vol 116, pg 1793, 2006). J Clin Invest. 2006;116:1793-1801
28. Xu HY, Barnes GT, Yang Q, Tan Q, Yang DS, Chou CJ. et al. Chronic inflammation in fat plays a crucial role in the development of obesity-related insulin resistance. J Clin Invest. 2003;112:1821-30
29. Weisberg SP, McCann D, Desai M, Rosenbaum M, Leibel RL, Ferrante AW. Obesity is associated with macrophage accumulation in adipose tissue. J Clin Invest. 2003;112:1796-808
30. Alexandraki KI, Piperi C, Ziakas PD, Apostolopoulos NV, Makrilakis K, Syriou V. et al. Cytokine secretion in long-standing diabetes mellitus type 1 and 2: Associations with low-grade systemic inflammation. J Clin Immunol. 2008;28:314-21
31. Stephens MAC, Wand G. Stress and the HPA Axis Role of Glucocorticoids in Alcohol Dependence. Alcohol Res-Curr Rev. 2012;34:468-83
32. Mastorakos G, Zapanti E. Thy hypothalamic-pituitary-adrenal axis in the neuroendocrine regulation of food intake and obesity: The role of corticotropin releasing hormone. Nutr Neurosci. 2004;7:271-80
33. Masuzaki H, Paterson J, Shinyama H, Morton NM, Mullins JJ, Seckl JR. et al. A transgenic model of visceral obesity and the metabolic syndrome. Science. 2001;294:2166-70
34. Chimin P, Farias TDM, Torres-Leal FL, Bolsoni-Lopes A, Campana AB, Andreotti S. et al. Chronic glucocorticoid treatment enhances lipogenic activity in visceral adipocytes of male Wistar rats. Acta Physiol. 2014;211:409-20
35. van Donkelaar EL, Vaessen KRD, Pawluski JL, Sierksma AS, Blokland A, Canete R. et al. Long-Term Corticosterone Exposure Decreases Insulin Sensitivity and Induces Depressive-Like Behaviour in the C57BL/6NCrl Mouse. Plos One. 2014:9
Author contact
![]() Corresponding author: Young-Sun Lee, Lee Gil Ya Cancer and Diabetes Institute, Gachon University, 7-45 Songdo-dong, Yeonsu-ku, Incheon 406-840 Korea. Tel: 11-82-32-899-6217, Fax: 11-82-32-899-6232, E-mail: leeysac.kr
Corresponding author: Young-Sun Lee, Lee Gil Ya Cancer and Diabetes Institute, Gachon University, 7-45 Songdo-dong, Yeonsu-ku, Incheon 406-840 Korea. Tel: 11-82-32-899-6217, Fax: 11-82-32-899-6232, E-mail: leeysac.kr
Citation styles
APA
Lee, Y.S., Lee, C., Jun, H.S. (2018). Infrequent Feeding of Restricted Amounts of Food Induces Stress and Adipose Tissue Inflammation, Contributing to Impaired Glucose Metabolism. International Journal of Medical Sciences, 15(14), 1667-1675. https://doi.org/10.7150/ijms.28503.
ACS
Lee, Y.S.; Lee, C.; Jun, H.S. Infrequent Feeding of Restricted Amounts of Food Induces Stress and Adipose Tissue Inflammation, Contributing to Impaired Glucose Metabolism. Int. J. Med. Sci. 2018, 15 (14), 1667-1675. DOI: 10.7150/ijms.28503.
NLM
Lee YS, Lee C, Jun HS. Infrequent Feeding of Restricted Amounts of Food Induces Stress and Adipose Tissue Inflammation, Contributing to Impaired Glucose Metabolism. Int J Med Sci 2018; 15(14):1667-1675. doi:10.7150/ijms.28503. https://www.medsci.org/v15p1667.htm
CSE
Lee YS, Lee C, Jun HS. 2018. Infrequent Feeding of Restricted Amounts of Food Induces Stress and Adipose Tissue Inflammation, Contributing to Impaired Glucose Metabolism. Int J Med Sci. 15(14):1667-1675.
This is an open access article distributed under the terms of the Creative Commons Attribution (CC BY-NC) license (https://creativecommons.org/licenses/by-nc/4.0/). See http://ivyspring.com/terms for full terms and conditions.