ISSN: 1449-1907International Journal of Medical Sciences
- Current issue
- Volume 21; 2024
- Volume 20; 2023
- Volume 19; 2022
- Volume 18; 2021
- Volume 17; 2020
- Archive
- Cover images
- Index & coverage
- Cover suggestion
- Special issues
Introduction
Material and methods
Results
Discussion
Future studies and clinical...
Conclusion
Conflicts of interest
References

Int J Med Sci 2018; 15(9):907-914. doi:10.7150/ijms.25836 This issue Cite
Research Paper
Rehabilitative ultrasound imaging of the bilateral intrinsic plantar muscles and fascia in post-stroke survivors with hemiparesis: A case-control study.
Cesar Calvo-Lobo1, Ana Isabel Useros-Olmo2,3, Jaime Almazán-Polo4,5, Ricardo Becerro-de-Bengoa-Vallejo6, Marta Elena Losa-Iglesias7, Patricia Palomo-López8, David Rodríguez-Sanz4, Daniel López-López5 ![]()
1. Nursing and Physical Therapy Department, Institute of Biomedicine (IBIOMED), Universidad de León, Ponferrada, León, Spain.
2. Centro superior de estudios Universitarios La Salle, Universidad Autónoma de Madrid, Madrid, Spain.
3. Unidad de Daño Cerebral, Hospital Beata Maria Ana, Madrid, Spain
4. Health science and Physical Therapy Research group, Physiotherapy Department, Faculty of Health, Exercise and Sport, European University of Madrid, Villaviciosa de Odón, Madrid, Spain
5. Research, Health and Podiatry Unit. Department of Health Sciences. Faculty of Nursing and Podiatry. Universidade da Coruña, Spain.
6. School of Nursing, Physiotherapy and Podiatry. University Complutense of Madrid, Spain.
7. Faculty of Health Sciences. University Rey Juan Carlos, Spain.
8. Department of Nursing, Faculty of Medicine, Badajoz. University of Extremadura, Spain.
Abstract
Purpose: The study main aim was to compare the cross-sectional area (CSA) and thickness of the plantar muscles and fascia in the hemiparesis and contralateral feet of poststroke survivors with respect to healthy feet of matched controls.
Methods: A case-control observational study was performed using B-mode rehabilitative ultrasound imaging. A convenience sampling method was used to select 60 feet. The sample was divided into 20 feet ipsilateral and 20 feet contralateral to the hemiparesis lower limb from poststroke survivors, as well as 20 healthy feet from matched controls. The CSA and thickness of the abductor hallucis, flexor digitorum brevis and flexor hallucis brevis, as well as the thickness for the posterior, middle and anterior plantar fascia portions were measured. Comparisons and multivariate predictive analyses were carried out for ultrasound measurements. In all analyses, a P-value<.01 with a 99% confidence interval was considered as statistically significant.
Results: Statistically significant differences (P<.01) were shown for a flexor hallucis brevis thickness increase as well as middle and anterior plantar fascia thickness decrease of the hemiparesis feet and contralateral feet with respect to the healthy matched control feet. The rest of measurements did not show any statistically significant difference (P>.01).
Conclusions: The thickness of the flexor hallucis brevis muscle as well as the middle and anterior plantar fascia portions of the hemiparesis and contralateral feet from poststroke survivors presented morphology changes with respect to the healthy matched control feet.
Keywords: Anatomy, Cross-sectional, Foot, Ultrasonography, Paresis.
Introduction
Strokes or cerebrovascular accidents may be considered as a high prevalence syndrome in developed countries (ranged from 1.47 to 2.6%) that shows neurologic disorders secondary to interruption of the cerebral blood flow [1]. Indeed, different geographic regions from Spain showed a high incidence of stroke which ranged from 141 to 220 cases per 100 000 persons per year [1,2]. In Spain, the rates of mortality in-hospital and after 1-year for stroke were 5.9% and 17.4%, respectively [3]. Indeed, the age standardized stroke mortality may range from 49 to 50 years old for males and from 38 to 42 years old for females [1].
The burden of stroke comprised high economic costs across the European countries with a total annual cost estimated at €27 billion [4]. The etiology, outcome measurements, and intervention strategies may differ and depend on the stroke categories, such as hemorrhagic or ischemic types. Strokes may be considered as a major cause of disability secondary to the debilitating initial symptoms and the severe long-term impairment regarding activities such as walking [1,4].
Thus, plantar flexor muscles ipsilateral to the impaired and spastic lower limb were shown as a main focus for evaluation and treatment in poststroke survivors [5-7]. Specifically, rehabilitative ultrasound imaging (RUSI) was used to measure the pennation angle and muscle thickness of the medial gastrocnemius muscle with a good intra- (intraclass correlation coefficient, ICC ranged from 0.69 to 0.99) and inter-examiner (ICC ranged from 0.70 to 0.99) reliability. RUSI technique may be useful for clinical evaluation in poststroke patients [6]. Nevertheless, there is a lack of research studies regarding the RUSI evaluation of the intrinsic plantar muscles and fascia in poststroke survivors.
Considering the intrinsic plantar muscles and fascia, RUSI was applied to evaluate the cross sectional area (CSA) and thickness of these foot structures [8-10]. Indeed, the CSA and thickness ultrasound measurements of plantar muscles such as the flexor hallucis brevis (FHB), flexor digitorum brevis (FDB) and abductor hallucis (AbH) as well as plantar fascia (PF) thickness were used to study the relationship between foot function and clinical conditions (i.e. hallux valgus or pes planus) and foot function [9,10]. An excellent reliability for these RUSI measurements was shown in a prior research study (ICC ranged from 0.91 to 0.98) [8].
To date, the CSA and thickness of the intrinsic plantar muscles and fascia have not yet been established in patients who suffered from stroke. Therefore, the study main aim was to compare the CSA and thickness of the plantar muscles and fascia in the hemiparesis and contralateral feet of poststroke survivors with respect to healthy feet of matched controls. In addition, the second objective of this study was to predict these ultrasound measurements based on the demographic and descriptive data, ambulation capacity and spasticity level.
Material and methods
Design
A cross-sectional observational study was carried out in order to measure the RUSI of the plantar muscles and fascia in the hemiparesis and contralateral feet of poststroke survivors with respect to healthy feet of matched controls from June 2017 to January 2018. The Strengthening the Reporting of Observational Studies in Epidemiology (STROBE) criteria and checklist were followed [11].
Sample size calculation
The sample size was calculated using the F test for one-way analysis of variance (fixed effects, omnibus ANOVA) with the G*Power 3.1.9.2 software and based on the AbH thickness (cm) of a pilot study with 3 groups (mean), 10 hemiparetic feet (1.17 cm), 10 contralateral feet (1.17 cm) and 10 healthy feet (0.92 cm), and a total standard deviation (SD) within each group of 0.18 cm. Indeed, an effect size of 0.68, an α error probability of 0.01 and a power (1-β error probability) of 0.90 were used for the sample size calculation. Thus, a total sample size of 45 subjects, 15 for each group, was calculated. Considering information loss of 20%, at least n = 54 participants (18 per group) must be studied. Finally, a total sample of 60 participants, 20 per group, was included in the study.
Participants
A convenience sampling method was used to select 60 feet which were recruited at the Beata Maria Ana Hospital (Madrid, Spain). The sample was divided into 20 feet ipsilateral and 20 feet contralateral to the hemiparesis lower limb from poststroke survivors, as well as 20 healthy feet from matched controls.
The inclusion criteria comprised participants older than 18 years without soreness in the leg, ankle and foot body areas over the last 6 months [8,10]. The exclusion criteria comprised self-reported or medical record surgeries, fractures, sprains, tears, tendinopathies, prior neuropathies (excluding the impairment secondary to hemiparetic feet), systemic or rheumatoid conditions, and pharmacotherapy (different from antiaggregants, antiplatelets or medications necessary for poststroke patients) [8-10,12]. Considering the foot and forefoot body areas, other specific exclusion criteria such as prior medical diagnosis of pes planus and cavus (considering the control group and the contralateral feet, excluding the spastic equinus feet from poststroke patients), hallux rigidus, heel spurs, plantar fasciitis, Sever's disease, Morton's neuroma, tibial nerve entrapment or tarsal tunnel syndrome, and plantar orthoses use [8-10,13]. Regarding the body regions from the low back to the leg, tibial periosteum degeneration or inflammation, meniscopathies, sprains, bursitis, Baker cysts, piriformis syndrome or sciatic nerve entrapments, sacroiliac joint dysfunction or labral impingement syndrome [9,10,12-19]. Furthermore, subjects who performed more than 3 hours per week or high intensity exercise were excluded because lower limbs CSA modifications could be generated [20].
Ethical considerations
The Ethics Committee of Centro Superior de Estudios Universitarios La Salle (Madrid, Spain; code: CSEULS-PI-156/2017) approved this study. Informed consent forms were signed by all participants before the start of the study. The ethical guidelines for human experimentation and the Declaration of Helsinki were considered and respected [21].
Demographic and descriptive data
The demographic and descriptive data such as age (years), sex (male or female), body mass index (BMI; kg/m2), weight (kg), height (m), and foot side (right or left) were initially collected [8-10].
Ambulation capacity
The ambulation capacity was measured with the Functional Independence Measure and Functional Assessment Measure (FIM+FAM) by an experienced neurology physician. This scale has shown adequate psychometric properties to be valid and reliable in patients who suffered from stroke [22]. The FIM may be considered as a global score of disability and a common language measurement with 18 items of dependency for activities of daily living (13 motor items and 5 cognitive items; each item ranged from 1 to 7) showing satisfactory scaling assumptions and internal consistency (total correlations varied from 0.57 to 0.91; Cronbach's alpha was equal to 0.94) in the Spanish population [22,23]. The FAM comprised the FIM together with 12 additional items evaluating psychosocial function as the key factors to measure in brain injury. Its reliability was improved in comparison with the original version and was used as a functionality predictor in Spanish poststroke patients [22,24,25]. The ambulation capacity was scored and categorized as 7 (complete independency), 6 (modified independency), 5 (supervision), 4 (minimum assistance), 3 (moderate assistance), 2 (maximum assistance), and 1 (total assistance) [22-25].
Spasticity level
The Modified Modified Ashworth Scale (MMAS) was applied for the assessment of plantar flexor spasticity in poststroke patients by an experienced neurology physician. This scale has shown good agreement (Cohen kappa ranged from 0.70 to 0.75) in patients with brain injury. Their scores were categorized as 0 (normal muscle tone), 1 (slight hypertonicity), 2 (moderate hypertonicity), 3 (high hypertonicity) and 4 (very high hypertonicity) [26].
Ultrasound Imaging
All RUSI measurements were carried out by the same expert physical therapist with more than 4 years of specialization and experience. This evaluator was not blind to group allocation during RUSI assessment. A high quality diagnostic ultrasound tool (Ecube i7; Alpinion Medical Systems, Ltd. Verdi Tower 72, Digital-ro 26-gil, Guru-gu, Seoul, Korea) with a 8- to 12.0-MHz-range linear transducer (Broadband Linear Array type L3-12 T; 45 mm footprint) and single crystal technology of linear type) was utilized to perform resting B-mode ultrasound imaging.
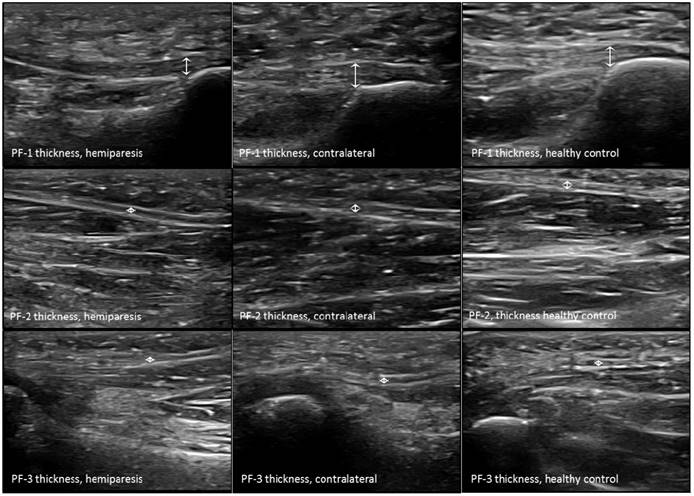
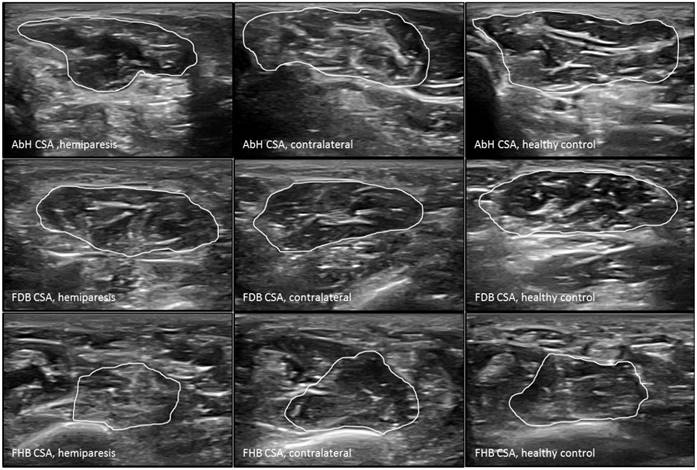
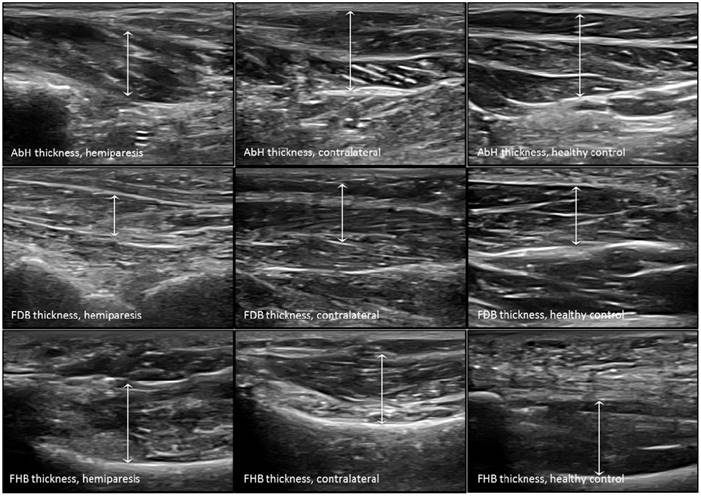
The probe was located according to prior research studies about RUSI measures of the intrinsic plantar muscles and fascia [8-10]. First, the PF was assessed in a longitudinal line from the medial calcaneal tubercle to the 2nd toe. The PF was divided into 3 points of evaluation: 1) the calcaneus insertion (PF-1), b) the navicular tubercle (PF-2), and 3) the 2nd metatarsal head (PF-3). Second, the CSA (perpendicular to the muscle fibers) and the thickness (longitudinal to the muscle fibers) were assessed in the thickest part of the muscles (AbH, FDB and FHB) coinciding with 3 different scanning lines. Indeed, the AbH scanning line was located from the medial calcaneus bone tuberosity to the navicular bone tuberosity. After, the FDB scanning line was placed between the medial calcaneus tuberosity bone tubercle to the 3rd toe. Lastly, the FHB scanning line was longitudinally placed along the 1st metatarsal shaft (8,9). Regarding the RUSI measurements of the PF thickness (Figure 1), intrinsic plantar muscles CSA (Figure 2) and thickness (Figure 3) obtained in the hemiparesis, contralateral and healthy matched control feet, subjects who presented difficulties to evaluate the muscles and PF limits (i.e. structures larger than the probe footprint or ultrasound images with poor visually perimeters) were excluded [10].
Finally, the RUSI measurements were performed by the same expert physical therapist with more than 4 years of specialization and experience (blinded to the allocation group by means of number codification of the offline images). The ImageJ software (version 2.0; US National Institutes of Health, Bethesda, Maryland, USA) was used for measuring all the offline images [27]. These RUSI measurements have shown an excellent reliability which varied from 0.91 to 0.98 ICC [8].
Statistical analysis
Statistical analyses were carried out by the 22.0 version of the SPSS software (IBM SPSS Statistics for Windows; Armonk, NY: IBM Corp) considering an α error of 0.01 and a 99% confidence interval (CI) with a desired power of 90% (β error of 0.1) according to the sample size calculation.
Ultrasound imaging measurements of the plantar fascia thickness. Abbreviations: PF-1, plantar fascia at the calcaneus insertion; PF-2, plantar fascia at the navicular tubercle; PF-3, plantar fascia at the 2nd metatarsal head.
Ultrasound imaging measurements of the intrinsic plantar muscles CSA. Abbreviations: AbH, abductor hallucis; CSA, cross-sectional area; FDB, flexor digitorum brevis; FHB, flexor hallucis brevis.
Considering the quantitative data, Shapiro-Wilk test was performed to evaluate normality. All parametric data (P > .01) were described by mean ± standard deviation (SD) and rage (minimum-maximum), and analyzed to compare descriptive data (BMI) and RUSI measurements (PF-1 thickness, FDB CSA and thickness, FHB CSA, AbH thickness and CSA) by the one-way ANOVA completed with the Bonferroni´s post-hoc analysis. All non-parametric data (P < .01) were described by median ± interquartile range (IR) and rage (minimum-maximum), and analyzed to compare descriptive data (age, weight and height) and RUSI measurements (PF-2, PF-3 and FHB thicknesses) by the Kruskal-Wallis test completed with the paired Wilcoxon test post-hoc analysis.
Ultrasound imaging measurements of the intrinsic plantar muscles thickness. Abbreviations: AbH, abductor hallucis; FDB, flexor digitorum brevis; FHB, flexor hallucis brevis.
Regarding the categorical data, frequencies and percentages were used to describe these data and the Chi-square (χ2) test was utilized to compare the sex, foot side, MMAS and FIM+FAM data.
In addition, a multivariate predictive analysis was performed by means of linear regression. Linear regression analysis was carried out applying the stepwise selection method and the R2 coefficient to determine the quality adjustment. Demographic and descriptive data, including age, sex, weight, height, BMI, foot side, MMAS degrees and FIM+FAM grades were considered as dependent variables. All RUSI measures (PF-1, PF-2, PF-3 thickness; AbH, FDB and FHB thickness and CSA) were considered as independent variables.
Results
Demographic and descriptive data
The demographic and descriptive data of the sample were shown in Table 1. There were not statistically significant differences (P >.01) for sex, age, weight, height, BMI or foot side between groups. Considering the spasticity, there were statistically significant differences (P < .001; χ2 = 60.00) for the MMAS between groups. The hemiplegic feet MMAS degrees presented 3 (15%) grades-1, 13 (65%) grades-2, 3 (15%) grades-3 and 1 (5%) grade-4, while the rest of feet (n = 20 contralateral feet and n = 20 healthy matched control feet) presented all (100%) grades-0. Regarding the ambulation capacity, there were statistically significant differences (P < .001; χ2 = 45.00) for the FIM+FAM between groups. The hemiplegic and contralateral feet FIM+FAM degrees presented 0 (0%) grade-1, 4 (20%) grades-2, 6 (30%) grades-3, 2 (10%) grades-4, 3 (15%) grades-5, 3 (15%) grades-6 and 2 (10%) grades-7, while the healthy matched control feet presented all (100%) grades-7.
RUSI of the intrinsic plantar muscles and fascia
The RUSI measurements regarding the CSA and thickness of the intrinsic plantar muscles and fascia between all groups were summarized in Table 2. Considering the intrinsic plantar muscles, statistically significant differences (P < 0.001) were only shown for the FHB thickness. The post-hoc Bonferroni´s analysis showed statistically significant differences for a FHB thickness increase of the hemiparesis feet (means difference of 0.31 cm; P < 0.001) and contralateral feet (means difference of 0.37 cm; P < 0.001) with respect to the healthy matched control feet. Regarding the fascia, statistically significant differences (P < 0.01) were only shown for the PF-2 and PF-3 thickness. The post-hoc paired Wilcoxon analysis showed statistically significant differences for a PF-2 thickness reduction of the hemiparesis feet (means difference of -0.03 cm; P = 0.006) and contralateral feet (means difference of -0.04 cm; P = 0.005) with respect to the healthy matched control feet. In addition, a PF-3 thickness reduction of the contralateral feet (means difference of -0.03 cm; P = 0.001) with respect to the healthy matched control feet. The rest of measurements did not show any statistically significant difference (P > 0.01).
Multivariate predictive analysis of plantar muscles and fascia RUSI measurements
Considering the multivariate regression analysis of the Table 3, the models of linear regression showed statistically significant differences (P < 0.01) for the PF-1 thickness, AbH, FDB and FHB CSA and thickness with a prediction model R2 ranged from 0.113 to 0.260. Nevertheless, there were not statistically significant differences (P > .01) for the prediction models of the PF-2 and PF-3 thickness.
Discussion
To the author´s knowledge, this may be considered as the first study in order to determine bilaterally the resting RUSI morphology of the intrinsic plantar muscles and fascia of poststroke survivors with respect to paired healthy matched controls. Despite prior RUSI studies have focused on plantar flexor muscles, such as the gastrocnemius muscles, ipsilateral to the impaired and spastic lower limb in poststroke survivors [5-7], there was a lack of studies about treatment and evaluation of the intrinsic plantar muscles and fascia. Thus, this research could be a starting point in order to consider the main role of the FHB and plantar fascia in spastic feet of poststroke survivors.
Demographic, descriptive, ambulation capacity and spasticity characteristics the hemiparesis, contralateral and healthy matched control feet ‡
| Characteristic | Hemiparesis feet (n = 20) | Contralateral feet (n = 20) | Control feet (n = 20) | P-Value (Statistic) |
|---|---|---|---|---|
| Sex, female/male | 10 (50%) / 10 (50%) | 10 (50%) / 10 (50%) | 12 (60%) / 8 (40%) | .765‡ |
| (χ2 = .536) | ||||
| Foot side, right/left | 13 (65%) / 7 (35%) | 13 (65%) / 7 (35%) | 14 (70%) / 6 (30%) | .928‡ |
| (χ2 = .150) | ||||
| Age, y | 61.50 ± 11.50 | 61.50 ± 11.50 | 50.10 ± 18.10 | .012† |
| (25.00-73.00) | (25.00-73.00) | (27.00-62.01) | (H = 8.912) | |
| Weight, kg | 72.50 ± 31.25 | 72.50 ± 31.25 | 59.50 ± 17.00 | .026† |
| (48.00-100.00) | (48.00-100.00) | (51.00-78.00) | (H = 7.295) | |
| Height, m | 1.69 ± 0.15 | 1.69 ± 0.15 | 1.65 ± 0.06 | .030† |
| (1.50-1.90) | (1.50-1.90) | (1.60-1.70) | (H = 6.980) | |
| BMI, kg/m2 | 21.60 ± 4.17 | 21.60 ± 4.17 | 22.63 ± 3.30 | .633* |
| (15.58-28.41) | (15.58-28.41) | (18.44-28.52) | (F = 0.661) |
Abbreviations: ANOVA, analysis of variance; BMI, body mass index; CI, confidence interval; IR, interquartile range; SD, standard deviation. In all analyses, a P-value < .01 with a 99% CI was considered as statistically significant. * Mean ± SD and one-way ANOVA (F) were used. † Median ± IR and Kruskal Wallis (H) were used. ‡ Frequencies (%) and Chi-square (χ2) test were used.
Ultrasound parameter measurements
| Parameter | Hemiparesis feet (n = 20) | Contralateral feet (n = 20) | Control feet (n = 20) | P -value |
|---|---|---|---|---|
| CSA (cm2) | ||||
| FDB | 2.24 ± 0.51 (1.31-3.37) | 2.49 ± 0.57 (1.34-3.43) | 1.98 ± 0.64 (1.08-3.04) | .028 (F = 3.808)* |
| FHB | 2.29 ± 0.46 (1.11-3.34) | 2.13 ± 0.51 (1.18-3.00) | 1.92 ± 0.35 (1.30-2.68) | .043 (F = 3.335)* |
| AbH | 2.50 ± 0.48 (1.39-3.53) | 2.61 ± 0.63 (1.84-4.42) | 2.56 ± 0.63 (1.58-3.58) | .083 (F = 2.595)* |
| Thickness (cm) | ||||
| FDB | 1.05 ± 0.18 (0.77-1.34) | 1.13 ± 0.22 (0.70-1.44) | 1.04 ± 0.15 (0.82-1.38) | .277 (F = 1.312)* |
| FHB | 1.13 ± 0.16 (0.88-1.48) | 1.18 ± 0.35 (0.88-2.60) | 0.81 ± 0.16 (0.57-1.05) | <.001 (F = 13.300)* |
| AbH | 1.16 ± 0.25 (0.74-1.46) | 1.11 ± 0.30 (0.90-1.53) | 1.04 ± 0.36 (0.60-1.45) | .180 (H = 3.426)† |
| PF-1 | 0.32 ± 0.08 (0.17-046) | 0.33 ± 0.08 (0.21-0.55) | 0.35 ± 0.04 (0.28-0.47) | .547 (F = 0.610)* |
| PF-2 | 0.14 ± 0.05 (0.08-0.83) | 0.13 ± 0.06 (0.09-0.26) | 0.17 ± 0.07 (0.12-0.23) | .006 (H = 10.354)† |
| PF-3 | 0.08 ± 0.06 (0.05-0.98) | 0.08 ± 0.03 (0.05-0.97) | 0.11 ± 0.05 (0.08-0.17) | .004 (H = 11.254)† |
Abbreviations: AbH, abductor hallucis; : ANOVA, analysis of variance; CI, confidence interval; CSA, cross-sectional area; FDB, flexor digitorum brevis; FHB, flexor hallucis brevis; IR, interquartile range; PF-1, plantar fascia at the calcaneus insertion; PF-2, plantar fascia at the navicular tubercle; PF-3, plantar fascia at the 2nd metatarsal head; SD, standard deviation. In all analyses, a P-value < .01 with a 99% CI was considered as statistically significant. * Mean ± SD and one-way ANOVA (F) were used. † Median ± IR and Kruskal Wallis (H) were used.
Multivariate predictive analysis of plantar muscles and fascia RUSI changes
| Parameter | Model | R2 change† | Model R2 |
|---|---|---|---|
| CSA (cm2) | |||
| AbH | 1.451 | ||
| +0.051 * BMI | 0.113 | 0.113 | |
| FDB | 1.202 | ||
| +0.019 * age | 0.124 | 0.124 | |
| FHB | 1.284 | ||
| +0.012 * weight | 0.165 | 0.165 | |
| Thickness (cm) | |||
| AbH | 0.813 | ||
| +0.005 * weight | 0.115 | 0.115 | |
| FDB | 0.673 | ||
| -0.018 * BMI | 0.140 | 0.140 | |
| FHB | 1.364 | ||
| -0.159 * group | 0.199 | 0.199 | |
| PF-1 | 0.097 | ||
| +0.010 * BMI | 0.161 | ||
| +0.049 * sex | 0.099 | 0.260 |
Abbreviations: AbH, abductor hallucis; BMI, Body mass index; CO, confidence interval; CSA, cross-sectional area; FDB, flexor digitorum brevis; FHB, flexor hallucis brevis; HV, hallux valgus; PF-1, plantar fascia at the calcaneus insertion.
*Multiplay: age (years); BMI (kg/m2); sex (male = 0; female = 1); group (hemiparesis = 1; contralateral = 2; control = 3); weight (kg).
†P-value < 0.01 with a 99% CI was shown.
Regarding the RUSI measurements of prior studies which evaluated the plantar muscles and fascia in healthy subjects [8-10], these values are coinciding with our normalized reference values. Despite the FHB thickness was shown to be reduced in subjects with pes planus (1.30 ± 0.18 cm2) versus subjects without pes planus (1.43 ± 0.20 cm2) [9], as well as in subjects with hallux valgus (0.93 ± 0.14 cm2) versus subjects without hallux valgus (1.09 ± 0.18 cm2) [10], an increased thickness of the FHB thickness from the spastic and contralateral feet of poststroke survivors with hemiparesis was found with respect to healthy matched controls. Despite the middle and anterior plantar fascia thickness was shown to be thinner in subjects with pes planus (0.16 ± 0.03 and 0.10 ± 0.02 cm) versus subjects without and pes planus (0.19 ± 0.03 and 0.13 ± 0.02 cm) [9], respectively, as well as thicker in subjects with hallux valgus (0.21±0.06 and 0.16 ± 0.05 cm) versus subjects without hallux valgus (0.17 ± 0.03 and 0.11 ± 0.03 cm) [10], respectively, a thinner thickness of the middle and anterior fascia portions from the spastic and contralateral feet of poststroke survivors with hemiparesis was found with respect to healthy matched controls.
Regarding multivariate predictive analysis of RUSI measurements in the intrinsic plantar muscles and fascia, the model R2 ranged from 0.113 to 0.260 in the present study which was lower than the model R2 (ranged from 0.224 to 0.595) in a prior study of hallux valgus [10]. This may be due to statistically significant differences were considered at P-value < 0.01 in the present study (for the PF-1 thickness, AbH, FDB and FHB CSA and thickness), while a P-value < 0.05 was considered in the hallux valgus prior study. Both studies showed BMI, age, weight, sex and group as main predictors of RUSI measurements of the intrinsic plantar muscles and fascia [10].
Future studies and clinical implications
Future interventional studies, such as functional electrical stimulation of the toe muscles [28] or surgical correction of the intrinsic toe flexion deformity associated to the spastic equinovarus deformity [29], should be carried out assessing the gait cycle of poststroke survivors and the thickness of the FHB and fascia by means of ultrasound imaging. In addition, the ultrasound measurements of contractile changes for the intrinsic plantar muscles should be considered for future studies due to an excellent test-retest reliability has recently been reported for measuring motor function [30].
Limitations
Various limitations may be considered in the present study. First of all, the consecutive sampling method should be recognized as a possible limitation of this study. Despite the incidence of residual toe curling secondary to spasticity of the intrinsic plantar muscles was similar in the patients who suffered from a traumatic brain injury and a cerebrovascular accident [29], the type of stroke of the hemiparesis patients was not collected. In addition, more diverse subjects and larger sample sizes could be useful to strengthen the research study and identify variations across countries [31]. Finally, this study only reported the morphological changes of the intrinsic plantar muscles and fascia. Nevertheless, the motor function assessed by ultrasound measurements for the intrinsic plantar muscles should be included for future studies in post-stroke survivors [30].
Conclusion
The thickness of the flexor hallucis brevis muscle as well as the middle and anterior plantar fascia portions of the hemiparesis and contralateral feet from poststroke survivors presented morphology changes with respect to the healthy matched control feet.
Conflicts of interest
All authors have no conflicts of interest to report. All of the authors of the manuscript received any remuneration. Further, the authors have not received any reimbursement or honorarium in any other manner. The authors are not affiliated in any manner.
References
1. Zhang Y, Chapman A-M, Plested M, Jackson D, Purroy F. The Incidence, Prevalence, and Mortality of Stroke in France, Germany, Italy, Spain, the UK, and the US: A Literature Review. Stroke Res Treat. 2012;2012:436125
2. Vega T, Zurriaga O, Ramos JM, Gil M, Alamo R, Lozano JE. et al. Stroke in Spain: epidemiologic incidence and patterns; a health sentinel network study. J Stroke Cerebrovasc Dis. 2009;18:11-6
3. Mar J, Masjuan J, Oliva-Moreno J, Gonzalez-Rojas N, Becerra V, Casado MÁ. et al. Outcomes measured by mortality rates, quality of life and degree of autonomy in the first year in stroke units in Spain. Health Qual Life Outcomes. 2015;13:36
4. Di Carlo A. Human and economic burden of stroke. Age Ageing. 2009;38:4-5
5. Santamato A, Francesca Micello M, Panza F, Fortunato F, Logroscino G, Picelli A. et al. Extracorporeal Shock Wave Therapy for the Treatment of Poststroke Plantar-Flexor Muscles Spasticity: A Prospective Open-Label Study. Top Stroke Rehabil. 2014;21:S17-24
6. Cho KH, Lee HJ, Lee WH. Reliability of rehabilitative ultrasound imaging for the medial gastrocnemius muscle in poststroke patients. Clin Physiol Funct Imaging. 2014;34:26-31
7. Gao F, Ren Y, Roth EJ, Harvey R, Zhang L-Q. Effects of repeated ankle stretching on calf muscle-tendon and ankle biomechanical properties in stroke survivors. Clin Biomech. 2011;26:516-22
8. Crofts G, Angin S, Mickle KJ, Hill S, Nester CJ. Reliability of ultrasound for measurement of selected foot structures. Gait Posture. 2014;39:35-9
9. Angin S, Crofts G, Mickle KJ, Nester CJ. Ultrasound evaluation of foot muscles and plantar fascia in pes planus. Gait Posture. 2014;40:48-52
10. Lobo CC, Marín AG, Sanz DR, López DL, López PP, Morales CR. et al. Ultrasound evaluation of intrinsic plantar muscles and fascia in hallux valgus: A case-control study. Medicine (Baltimore). 2016;95:e5243
11. Vandenbroucke JP, von Elm E, Altman DG, G?tzsche PC, Mulrow CD, Pocock SJ. et al. Strengthening the Reporting of Observational Studies in Epidemiology (STROBE): Explanation and elaboration. Int J Surg. 2014;12:1500-24
12. Cartwright MS, Walker FO. Neuromuscular ultrasound in common entrapment neuropathies. Muscle Nerve. 2013;48:696-704
13. Hagedorn TJ, Dufour AB, Riskowski JL, Hillstrom HJ, Menz HB, Casey VA. et al. Foot disorders, foot posture, and foot function: the Framingham foot study. Milanese S, editor. PLoS One. 2013;8:e74364
14. Relph N, Herrington L, Tyson S. The effects of ACL injury on knee proprioception: a meta-analysis. Physiotherapy. 2014;100:187-95
15. Haviv B, Bronak S, Thein R. Correlation between body mass index and chondral lesions in isolated medial meniscus tears. Indian J Orthop. 2015;49:176-80
16. Meadows JR, Finnoff JT. Lower Extremity Nerve Entrapments in Athletes. Curr Sports Med Rep. 2014;13:299-306
17. Lee AJJ, Armour P, Thind D, Coates MH, Kang ACL. The prevalence of acetabular labral tears and associated pathology in a young asymptomatic population. Bone Joint J. 2015:97 -B:623-7
18. Cass SP. Piriformis Syndrome. Curr Sports Med Rep. 2015;14:41-4
19. Kurosawa D, Murakami E, Aizawa T. Referred pain location depends on the affected section of the sacroiliac joint. Eur Spine J. 2015;24:521-7
20. Belavý DL, Miokovic T, Rittweger J, Felsenberg D. Estimation of changes in volume of individual lower-limb muscles using magnetic resonance imaging (during bed-rest). Physiol Meas. 2011;32:35-50
21. Holt GR. Declaration of Helsinki?The World?s Document of Conscience and Responsibility. South Med J. 2014;107:407
22. Nayar M, Vanderstay R, Siegert RJ, Turner-Stokes L. The UK Functional Assessment Measure (UK FIM+FAM): Psychometric Evaluation in Patients Undergoing Specialist Rehabilitation following a Stroke from the National UK Clinical Dataset. Quinn TJ, editor. PLoS One. 2016;11:e0147288
23. Martínez-Martín P, Fernández-Mayoralas G, Frades-Payo B, Rojo-Pérez F, Petidier R, Rodríguez-Rodríguez V. et al. [Validation of the functional independence scale]. Gac Sanit. 2009;23:49-54
24. Hall KM, Hamilton BB, Gordon WA, Zasler ND. Characteristics and comparisons of functional assessment indices. J Head Trauma Rehabil. 1993;8:60-74
25. Huertas Hoyas E, Pedrero Pérez EJ, Águila Maturana AM, García López-Alberca S, González Alted C. Predictores de funcionalidad en el daño cerebral adquirido. Neurología. 2015;30:339-46
26. Mishra C, Ganesh GS. Inter-Rater Reliability of Modified Modified Ashworth Scale in the Assessment of Plantar Flexor Muscle Spasticity in Patients with Spinal Cord Injury. Physiother Res Int. 2014;19:231-7
27. Schneider CA, Rasband WS, Eliceiri KW. NIH Image to ImageJ: 25 years of image analysis. Nat Methods. 2012;9:671-5
28. Tortolero X, Masani K, Maluly C, Popovic MR. Body movement induced by electrical stimulation of toe muscles during standing. Artif Organs. 2008;32:5-12
29. Keenan MA, Gorai AP, Smith CW, Garland DE. Intrinsic toe flexion deformity following correction of spastic equinovarus deformity in adults. Foot Ankle. 1987;7:333-7
30. Fraser JJ, Mangum LC, Hertel J. Test-retest reliability of ultrasound measures of intrinsic foot motor function. Phys Ther Sport. 2018;30:39-47
31. GBD 2013 DALYs, HALE Collaborators CJL, Murray CJL, Barber RM, Foreman KJ, Abbasoglu Ozgoren A, Abd-Allah F. et al. Global, regional, and national disability-adjusted life years (DALYs) for 306 diseases and injuries and healthy life expectancy (HALE) for 188 countries, 1990-2013: quantifying the epidemiological transition. Lancet (London, England). 2015;386:2145-91
Author contact
![]() Corresponding author: David Rodríguez Sanz. Universidad Europea de Madrid. Faculty of Sports Sciences, Villaviciosa de Odón, Madrid, Spain. Telephone: 0034 915223647, Email: davidrodriguezsanzcom
Corresponding author: David Rodríguez Sanz. Universidad Europea de Madrid. Faculty of Sports Sciences, Villaviciosa de Odón, Madrid, Spain. Telephone: 0034 915223647, Email: davidrodriguezsanzcom
Received 2018-3-1
Accepted 2018-5-25
Published 2018-6-4