Impact Factor ISSN: 1449-1907

 Global reach, higher impact
Int J Med Sci 2018; 15(4):323-338. doi:10.7150/ijms.22747 This issue Cite
Research Paper
Bone Turnover Status: Classification Model and Clinical Implications
Alexander Fisher1,2,4, Leon Fisher3, Wichat Srikusalanukul1, Paul N Smith2,4 ![]()
1. Department of Geriatric Medicine, The Canberra Hospital, Canberra, ACT Health, Canberra, Australia;
2. Department of Orthopaedic Surgery, The Canberra Hospital, Canberra, ACT Health, Canberra, Australia;
3. Frankston Hospital, Peninsula Health, Melbourne, Australia
4. Australian National University Medical School, Canberra, ACT, Australia
Received 2017-9-8; Accepted 2017-11-23; Published 2018-2-1
Abstract
Aim: To develop a practical model for classification bone turnover status and evaluate its clinical usefulness.
Methods: Our classification of bone turnover status is based on internationally recommended biomarkers of both bone formation (N-terminal propeptide of type1 procollagen, P1NP) and bone resorption (beta C-terminal cross-linked telopeptide of type I collagen, bCTX), using the cutoffs proposed as therapeutic targets. The relationships between turnover subtypes and clinical characteristic were assessed in1223 hospitalised orthogeriatric patients (846 women, 377 men; mean age 78.1±9.50 years): 451(36.9%) subjects with hip fracture (HF), 396(32.4%) with other non-vertebral (non-HF) fractures (HF) and 376 (30.7%) patients without fractures.
Resalts: Six subtypes of bone turnover status were identified: 1 - normal turnover (P1NP>32 μg/L, bCTX≤0.250 μg/L and P1NP/bCTX>100.0[(median value]); 2- low bone formation (P1NP ≤32 μg/L), normal bone resorption (bCTX≤0.250 μg/L) and P1NP/bCTX>100.0 (subtype2A) or P1NP/bCTX<100.0 (subtype 2B); 3- low bone formation, high bone resorption (bCTX>0.250 μg/L) and P1NP/bCTX<100.0; 4- high bone turnover (both markers elevated ) and P1NP/bCTX>100.0 (subtype 4A) or P1NP/bCTX<100.0 (subtype 4B). Compared to subtypes 1 and 2A, subtype 2B was strongly associated with nonvertebral fractures (odds ratio [OR] 2.0), especially HF (OR 3.2), age>75 years and hyperparathyroidism. Hypoalbuminaemia and not using osteoporotic therapy were two independent indicators common for subtypes 3, 4A and 4B; these three subtypes were associated with in-hospital mortality. Subtype 3 was associated with fractures (OR 1.7, for HF OR 2.4), age>75 years, chronic heart failure (CHF), anaemia, and history of malignancy, and predicted post-operative myocardial injury, high inflammatory response and length of hospital stay (LOS) above10 days. Subtype 4A was associated with chronic kidney disease (CKD), anaemia, history of malignancy and walking aids use and predicted LOS>20 days, but was not discriminative for fractures. Subtype 4B was associated with fractures (OR 2.1, for HF OR 2.5), age>75 years, CKD and indicated risks of myocardial injury, high inflammatory response and LOS>10 days.
Conclusions: We proposed a classification model of bone turnover status and demonstrated that in orthogeriatric patients altered subtypes are closely related to presence of nonvertebral fractures, comorbidities and poorer in-hospital outcomes. However, further research is needed to establish optimal cut points of various biomarkers and improve the classification model.
Keywords: bone turnover markers, classification, nonvertebral fracture, prediction
Introduction
As the world's population ages, the prevalence of osteoporotic fractures is increasing, but the existing prevention strategies are only partially effective. Although altered bone and mineral metabolism is considered as one of the most important and modifiable risk factors for osteoporotic fractures, the diagnostic and prognostic value of bone turnover markers (BTMs) is still disputed. Currently BTMs, which reflect the status of total bone metabolism, are recommended only for the monitoring the efficacy of osteoporosis treatment and compliance [1-7].The reasons for scepticism about the practical value of BTMs include their significant analytical and biological variability [8-11], parallel dynamics (due to coupling bone formation and resorption), and, more importantly, large overlap in BTMs values between those with and without fractures [2, 4, 7, 12]. Moreover, both increased and low bone turnover have been shown to be associated with bone gain or loss as well as with increased risk of fracture [13-20]. Despite accumulating evidence suggesting heterogeneity of the osteoporotic processes as a reflection of sophisticated and multifactorial regulation of bone metabolism, osteoporosis is still often considered as a single entity. One possible way to deal with this complex disorder is to identify clinical subtypes based on selected variables. However, there is currently no international consensus regarding characteristics (absolute values) of normal, high or low bone turnover, and the balance between bone formation and resorption is mostly neglected, although after midlife bone is lost because remodelling, despite of coupling, becomes unbalanced [13, 20, 21].
In light of paucity of studies investigating the phenomenon of variants of BTMs we attempted to develop and introduce a practical classification model based on both bone formation and resorption biomarkers and their ratio. We aimed to identify distinct subtypes of bone metabolism and analysed in a cohort of hospitalised orthogeriatric patients the relationships between these subtypes and (1) presence and type of a non-vertebral fracture, (2) clinical and laboratory characteristics (2) and (3) in-hospital outcomes.
Patients and Methods
Patients
This was an observational study using prospectively collected data on 1899 consecutive older (>60 years) patients admitted to the Department of Orthopaedic Surgery at the Canberra hospital (a university-affiliated tertiary care centre, Australian Capital Territory, Australia) between 1January 2012 and 31December 2014. After excluding patients with high-trauma fracture, primary hyperparathyroidism, Paget's disease, metastatic cancer to bone, or who lacked adequate laboratory data, 1223 patients (846 women, 377 men) were evaluated for the study. Of these 1223 hospitalized orthogeriatric patients 847 (69.3%) had a non-vertebral bone fracture. Patients with hip fracture (HF, n=451) constituted 53.2% among all fracture patients, and 36.9% of the total cohort. There were 396(32.4%) patients with other non-vertebral (non-HF) fractures (humerus -79, femur - 74, ankle - 68, tibia or/and fibula -27, knee -16, wrist -16, forearm -15, other -101) and 376 (30.7%) patients without fractures (elective hip or knee replacement - 340, suspected surgical site infections not confirmed by further investigation -12, and 24 patients with a prosthetic joint infection following total hip [n=17] or knee [n=7] arthroplasty).
Data on demographics, orthopaedic and medical diagnoses, chronic comorbid conditions, residential and smoking status, alcohol consumption, laboratory characteristics, procedures performed, medication used, and short-term (in-hospital) outcomes were analysed.
The study was conducted according to the ethical guidelines of the current Declaration of Helsinki and was approved by the local Health Human Research Ethical Committee. Informed consent from each patient or carer was obtained.
Laboratory measurements
In each patient fasting venous blood samples were collected in the morning, usually within 24h after arrival. The following serum indicators of bone and mineral metabolism were measured: two bone formation markers (N-terminal propeptide of type 1 procollagen, P1NP, and osteocalcin, OC), bone resorption marker (beta C-terminal cross-linked telopeptide of type I collagen, bCTX), parathyroid hormone (PTH), 25 hydroxyvitamin D [25(OH)D], calcium, phosphate and magnesium concentrations. The serum concentrations of P1NP, OC and bCTX were measured using an electrochemiluminescent immunoassay (Elecsys 2010 analyser, Roche Diagnostics, Ltd Corp., IN, USA). Intra- and inter- assay coefficients of variation (CV) for P1NP were 2.6% and 4.1 %, respectively; for OC 3.6% and 6.6%, respectively, and for bCTX 3.2% and 6.5%, respectively. Serum 25(OH)D level was measured by a radioimmunoassay (Dia Sorin, Stillwater, MN, USA) and intact PTH was determined by a two-site chemiluminescent enzyme-linked immunoassay on DPC Immulite 2000 (Diagnostic Products Corp., Los Angeles, CA, USA); the intra- and inter-assay CV ranged from 2.1% to 12.7%. Calcium concentrations were corrected for serum albumin. The ratio of P1NP to bCTX was calculated by dividing the P1NP by bCTX. Vitamin D status was defined as deficient for circulating 25(OH)D concentration <25nmol/L, and as insufficient for 25-50nmol/L. Secondary hyperparathyroidism (SHPT) was defined as elevated serum PTH (>6.8pmol/L, the upper limit of the laboratory reference range). Chronic kidney disease (CKD) was defined as glomerular filtration rate (GFR)<60 ml/min/1.73m2 (CKD stage ≥3), anaemia as haemoglobin<120g/L and hypoalbuminaemia as albumin<33g/L.
Classification criteria for bone turnover status
In line with the recommendations of the International Osteoporosis Foundation and the International Federation of Clinical Chemistry and Laboratory Medicine on BTMs [7], in our classification we used P1NP as a formation marker and bCTX as a resorption marker. There is to date no consensus on normal reference intervals for BTMs. Because the reports on thresholds of optimal bone metabolism, particularly in the older age, are controversial, to classify bone turnover status we used the cutoffs proposed as therapeutic (fracture-protective) targets, though some researchers concluded “that absolute values for BTMs are not suited as treatment targets” [12]. Two approaches were recommended to choose treatment targets for osteoporotic therapy: (1) provisional threshold values derived from community-dwelling observations [22-24] and (2) the mean/median of premenopausal reference intervals [7, 25, 26]. As a provisional treatment target /threshold for optimal anti-resorptive response values of bCTX ≤0.230 µg/L (Chubb S 2016; 2017) and ≤0.250 µg/L (the equivalent of urinary NTX <21 nmol BCE/mmol [22]) were recommended. In 17 studies, the mean/median reference intervals for bCTX in premenopausal women ranged between 0.217 µg/L and 0.484 µg/L [27-41] being ≤0.260 µg/L in seven reports. In 8 studies, the mean/median reference intervals for bCTX in adult men ranged between 0.260 µg/L and 0.490 µg/L [34-36, 42-45] being ≤0.270 in two studies. Even more controversy exists in relation to the target/desired level of P1NP during osteoporosis treatment because of the direction of changes associated with different classes of drugs: P1NP increases greatly with teriparatide administration (Sugimoto T 2014) and decreases (but less than bCTX) with antiresorptive therapy [3, 46-48]. In 15 studies, the mean/median reference intervals for P1NP in premenopausal women ranged between 33.0 µg/L and 47.7 µg/L [27, 29-31, 33-41, 49, 50]; similarly, in 8 studies, the mean/median reference intervals for P1NP in adult men ranged between 32.7 µg/L and 64.9 µg/L[34-36, 38, 42-45]. Based on data from a cohort of community-dwelling older men receiving antiresorptive therapy, serum P1NP concentrations of <32 μg/L (equivalent to the provisional βCTX threshold of <0.230 μg/L) has recently been recommended as an indicator of optimal therapeutic response to bisphosphonate treatment [23].
In the present study, to classify the bone turnover status we have chosen as the cut points for serum P1NP 32 μg/L and for bCTX 0.250 µg/L; these arbitrary levels are relatively close to those recommended by the majority of experts and based on data reported by both abovementioned approaches.
Our classification of bone turnover status combines analysis of P1NP, bCTX and their ratio, assuming that the circulating concentrations of these markers are related to and reflect the integrated formation and resorption processes of the skeleton, while the ratio P1NP/bCTX<100 (median value) indicates a shift towards accelerated bone resorption.
Outcomes
The following short-term outcomes have been analysed: in-hospital death, myocardial injury (as reflected by cardiac troponin I rise), high postoperative (>3 days) inflammatory responses (CRP>100 mg/L and CRP>150 mg/L), length of hospital stay (LOS >10 days and >20 days), and new discharges to a permanent residential care facility (RCF).
Statistical analyses
Data analyses were performed using Stata software version10 (StataCorp., College Station, TX, USA). The patient characteristics were summarised using descriptive statistics; data presented as mean ± standard deviation (SD) for continuous variables and as numbers (and percentages) for categorical variables. Associations between bone turnover subtypes and fracture prevalence as well as comorbid conditions and outcomes were assessed using multiple linear regression models with a backward stepwise approach adjusting for age and gender. For multivariate logistic regression models all variables with p ≤0.100 at univariate analysis were selected. The discriminative accuracy of each bone turnover subtype was expressed with two descriptors: (1) the area under the receiver operating characteristic curve (ROC), and (2) the percentage of correctly classified patients. Two tailed tests were used and results were considered statistically significant if p <0.05.
Results
Patient characteristics
In the total cohort of orthogeriatric patients the mean age was 78.1±9.50 years, 846(69.2%) were women, and 190(15.4%) were living in a RCF. Patients averaged 2.7 chronic diseases per person. Four or more chronic conditions were identified in 28.5% of patients with the greatest burden among individuals with HF (36.0% vs. 29.4% in the non-fracture group, p=0.040). The most common comorbidities were hypertension requiring medications (60.0%), osteoarthritis (42.5%), abnormal gait with use of an assistive device (42.0%), diabetes mellitus type 2 (DM, 22.0%), CKD (21.3%), coronary artery disease (CAD, 17.1%), chronic obstructive airway disease (COPD, 15.4%), atrial fibrillation (AF, 14.8%), dementia (14.4%), cerebrovascular disease (12.2%), malignancy (10.4%) and chronic/congestive heart failure (CHF, 7.8%).
On admission, vitamin D insufficiency exhibited 295(24.1%) patients, vitamin D deficiency 95(7.8%), hyperparathyroidism 468(38.3%), anaemia 872(71.3%) and hypoalbuminaemia 680(55.6%) subjects. There were 17.3% ex-smokers and 8.0% current smokers, and 31.8% of patients consumed alcohol on average ≥3 times per week. At the time of admission antiresorptive treatment (bisphosphonates or denosumab) received 182(14.9%) patients (26.4% with HF, 18.2% with a non-HF and 11.2% without fractures). Compared with patients without a fracture, subjects with a nonvertebral fracture were significantly older (for HF 83.0±8.48 years, for non-HF 76.6±9.49 years vs. 73.9±8.06), much more frequent female (73.2%, 72.8 vs.60.6%, respectively), more often living in a RCF (27.7%, 10.5% vs.5.7%, respectively). The proportion of patients with hypertension, CHF, DM, COPD, CKD, history of malignancy, as well as current smokers and anticoagultion medication (mainly warfarin) users were similar in the three groups. Patients with fracture had significantly higher mean values of serum bCTX (+20.9%, p=0.000) and PTH (+11.8%, p=0.021), lower P1NP/bCTX ratio (-22.1%, p=0.000), haemoglobin (p=0.001) and albumin (p=0.000) levels. The mean serum levels of P1NP, OC, P1NP/OC ratio, 25(OH)D, creatinine, alkaline phosphatase (ALP), thyroid- stimulating hormone (TSH), free thyroxine (fT4) on admission did not differ between the three groups.
Classification of bone turnover status and fracture prevalence by subtypes
To classify bone turnover status we integrated the evidence available in the literature and used the cutoffs proposed as fracture-protective targets for osteoporotic therapy (see Methods). We used three criteria: 1) serum P1NP concentrations of 32 μg/L, 2) serum bCTX of 0.250 μg/L, and (3) P1NP/bCTX ratio of 100.0 (the median value in our cohort). In this study, serum bCTX<0.250 μg/L is referred as “normal”, and the serum P1NP<32 μg/L is referred as low. Subjects were initially divided into 4 groups according to bone turnover marker levels: 1) normal bone turnover- both markers (P1NP and bCTX) are normal; 2) low bone formation (P1NP≤32 μg/L) and normal bone resorption (bCTX≤0.250 μg/L); 3) low bone formation (P1NP≤32 μg/L) and high bone resorption (bCTX>0.250 μg/L); 4) high bone turnover- both markers are high (P1NP>32 μg/L and bCTX>0.250 μg/L). All subjects in group1, as would be expected, had P1NP/bCTX>100.0, indicating that bone formation was equal or exceeded bone resorption; the absolute majority of patients in group 3 had P1NP/bCTX<100.0 (97.6% among patients with fractures). Groups 2 and 4 were further divided into two subtypes (A and B) on the basis of the ratio P1NP/bCTX (≥100.0 or <100.0). In this paper, for simplicity, we are referring to six subtypes (avoiding terms “variant” or “group”). Figure 1 illustrates the principles of classification and the prevalence of each subtype among patients admitted with and without fracture. In our cohort in total, the prevalence of elevated bCTX was 78.1%, and the prevalence of low P1NP was 38.7%; ratio P1NP/bCTX <100.0 (bone resorption predominates bone formation) was observed in 300 (66.5%) patients with HF, but only in 116(30.9%) individuals without a fracture.
Schematic presentation of principles of classification of bone turnover marker status and the prevalence (%) of each subtype among hospitalised orthogeriatric patients. In subtypes 2A and 4A the ratio P1NP/bCTX >100.0, while in subtypes 2B and 4B the ratio P1NP/bCTX <100.0. The proportion (%) of patients with each subtype among all subjects admitted with a hip or non-hip fracture and without a fracture is shown in geometrical figures. Abbreviations: P1NP, N-terminal propeptide of type I procollagen; bCTX, C-terminal βcross-linked telopeptide of type I collagen; HF, hip fracture; non-FH, other non-vertebral fracture.
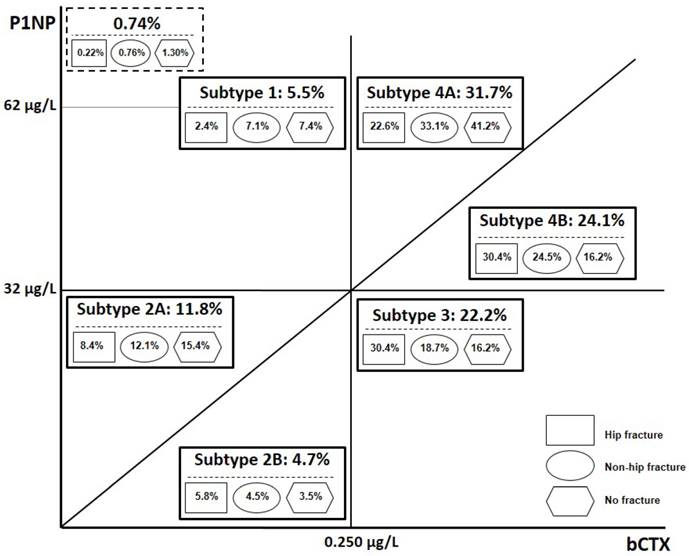
Subtype1 (normal bone turnover) was found in 67 (5.5% of the total cohort) subjects: in 39 patients with fractures (4.6% among all fractures), including 11 with HF (2.4% of all HFs), and in 28 patients without fractures (7.4% among the non-fractured). In subjects with subtype 1, compared to the rest of the cohort, risk of HF (but not other nonvertebral fractures) was 2.3 times lower (inverse association: OR 0.43, Table 1), and receiver operating characteristic (ROC) curve analysis showed the area under the curve (AUC) value of 0.7837 (75% sensitivity, 67.6% specificity and 71.6% accuracy). Interestingly, P1NP>62 µg/L (treatment target for anabolic therapy/ teriparatide) and normal serum bCTX (<0.250 μg/L) was observed in total only in 9 (0.74%) patients, including 5(1.3%) without fracture, 3(0.76%) with non-HF and 1(0.22%) subject with a HF; 8 of these 9 patients (including all 4 with fractures) have been receiving antiresorptive medications.
Discriminative value of bone turnover status for non-vertebral fracture presence/prediction
| Bone turnover status | Fracture site | OR | 95%CI | AUC | Sensitivity, % | Specificity, % | PPV, % | NPV, % | Accuracy, % |
|---|---|---|---|---|---|---|---|---|---|
| 1*.P1NP>32 µg/L, bCTX<0.250 µg/L, P1NP/ bCTX >100.0 (n=67) | Hip | 0.43 | 0.19-0.97 (p=0.043) | 0.7837 | 75.0 | 67.6 | 73.3 | 69.4 | 71.6 |
| Any fracture | 0.77 | 0.46-1.30 (p=0.324) | 0.6916 | 91.2 | 18.02 | 71.3 | 47.9 | 68.6 | |
| 2A*. P1NP<32 µg/L, bCTX <0.250 µg/L, P1NP/ bCTX >100.0 (n=144) | Hip | 0.70 | 0.43-1.14 (p=0.151) | 0.7815 | 76.7 | 66.0 | 73.0 | 70.3 | 71.8 |
| Any fracture | 0.73 | 0.50-1.06 (p=0.095) | 0.6918 | 91.3 | 17.8 | 71.4 | 47.5 | 68.7 | |
| 2B. P1NP<32 µg/L, bCTX <0.250 µg/L, P1NP/ bCTX <100.0 (n=57) | Hip | 3.23 | 1.37-7.65 (p=0.008) | 0.8061 | 66.7 | 84.9 | 76.9 | 77.1 | 71.0 |
| Any fracture | 2.04 | 1.00-4.17 (p=0.051) | 0.7220 | 82.3 | 39.4 | 69.9 | 56.5 | 66.4 | |
| 3. P1NP<32 µg/L, bCTX >0.250 µg/L, P1NP/ bCTX >100.0 (n=272) | Hip | 2.40 | 1.42-4.06 (p=0.001) | 0.8124 | 79.0 | 70.1 | 77.0 | 72.5 | 75.1 |
| Any fracture | 1.74 | 1.14-2.65 (p=0.010) | 0.7194 | 89.9 | 27.9 | 74.0 | 54.7 | 71.0 | |
| 4A. P1NP>32 µg/L, bCTX>0.250 µg/L, P1NP/ bCTX >100.0 (n=388) | Hip | 0.94 | 0.58-1.53 (p=0.815) | 0.7597 | 57.6 | 84.7 | 70.2 | 76.1 | 74.2 |
| Any fracture | 0.94 | 0.66-1.34 (p=0.714) | 0.6647 | 77.7 | 38.2 | 65.1 | 53.5 | 61.8 | |
| 4B. P1NP>32 µg/L, bCTX >0.250 µg/L, P1NP/ bCTX <100.0 (n=295) | Hip | 2.53 | 1.48-4.33 (p=0.001) | 0.8247 | 81.2 | 72.8 | 79.1 | 75.4 | 77.5 |
| Any fracture | 2.08 | 1.37-3.16 (p=0.001) | 0.7412 | 91.4 | 26.5 | 75.2 | 55.7 | 72.5 |
The asterisk (*) on the subtypes 1 and 2A indicates comparison with the rest of the cohort. For all other subtypes comparison was made with combined data for subtypes 1 and 2A.
Abbreviations: P1NP, N-terminal propeptide of type I procollagen; β-CTX, C-terminal βcross-linked telopeptide of type I collagen; HF, hip fracture; OR, odds ratio; AUC, area under the receiver operating characteristic curve; CI, confidence interval; PPV, positive predictive value; NPV, negative predictive value.
Subtypes2A and 2B (low P1NP and normal bCTX) were observed in 201(16.4%) patients: in 64 with HF (14.2% of all HFs), 66 with non-HF (16.6% among the non-HFs) and in 71without fracture (18.9% of all non-fractured). Among 57subjects with subtype 2B (an imbalance between bone formation and resorption) 44(77.2%) patients presented with fractures, including 26 with HF. There was no significant difference between subjects with subtype 2A and subtype1 in prevalence of HFs (p=0.155) or non-HFs (p=0.300), whereas in patients with subtype 2B the risk of any fracture was 3.3 times higher (OR 3.3, 95% CI 1.45-7.61, p=0.004) and risk of HF was 4.3 times higher (OR 4.3, 95% CI 1.73-10.68, p=0.001) than in subjects with subtype1. After adjustment for age and gender, compared to the rest of the cohort, patients with subtype 1 and subtype 2A did not show significant association with presence of nonvertebral fractures, while subjects with subtype 2B, had 2.1-fold increased risk of HF (OR 2.12, 95% CI 1.00-4.53, p=0.050; AUC value 0.7821, 76.7% sensitivity, 66.0% specificity and 71.8% accuracy). In other words, despite low/normal levels of both BTMs contrasting association with fracture prevalence were related to the inadequate formation /resorption balance.
Subtype3 (low P1NP and elevated bCTX) accounted for 272(22.2%) patients in the total cohort, including 137 with HF (30.4% among all HFs), 74 with non-HF (18.7% among the non-HFs) and in 61patients without fractures (16.2% among the non-fractured). Compared to the rest of the cohort (adjusted for age and gender), patients with subtype3 had a 1.5-fold increased risk for any fracture (OR 1.45, 95%CI 1.04- 2.01, p=0.027) and 1.8-fold increased risk for HF (OR 1.77, 95%CI 1.21- 2.58, p=0.003) with AUC values of 0.6920 and 0.7852, respectively.
Subtypes 4A and 4B (high bone turnover) were found in 683 (55.8%) patients, and in 272 (39.8%) of them the P1NP level was >62μg/L. The subtype 4B (bone resorption predominating the formation) demonstrated 295 subjects (24.1% of the total cohort), including 137 with HF (30.4% among the HFs), 97 with non-HF (24.5% among the non-HFs) and 61 without fractures (16.2% among the non-fractured). When compared to the rest of the cohort and adjusted for age and gender, subtype 4B was a significant indicator of presence of both HF (OR 1.78, 95%CI 1.1.21-2.62, p=0.003; AUC value 0.7853) or non-HF (OR 1.64, 95%CI 1.14-2.36, p=0.008; AUC value 0.6172). Comparison of subtypes 4A and 4B showed that in the latter odds ratio (OR) for presence of HF was 2.4-fold higher (OR 2.41, 95%CI 1.74-3.40, p=0.000) and for any fracture 2.6-fold higher (OR 2.55, 95%CI 1.78-3.67, p=0.000).
As can be seen, the most common subtypes were 4A, 4B and 3, representing 31.7%, 24.1% and 22.2%, respectively, of patients in the total cohort and 27.5%, 27.6% and 24.9%, respectively, among patients with fractures. Among individuals with P1NP/bCTX<100, patients with fractures comprised 79.2%. In patients with nonvertebral fractures, subtypes 2B, 3 and 4B were found in 5.2%, 24.9% and 27.6%, respectively, compared to 3.5%, 16.2% and 16.2% among subjects without a fracture. Conversely, among patients with subtypes 2B, 3 and 4B nonvertebral fractures had 77.2%, 77.6% and 79.3% (including a HF - 45.6%, 50.4% and 46.4%, respectively).
Because both subtypes1 and 2A, compared to the rest of the cohort, were not significantly associated with presence of nonvertebral fractures (except an inverse association of subtype1 with HF presence) and there were no major differences between subtype 1 and 2A in regard to fracture prevalence, we further evaluated the relationship between subtypes 2B, 3, 4A and 4B and fracture presence in comparison with combined data for subtypes 1 and 2A (Table 1). These analyses revealed that subtype 2B increases the risk of HF by 3.2-fold and the risk of any non-vertebral fracture by 2.0-fold, subtype 3 by 2.4- and 1.7-fold, respectively, and subtype 4B by 2.5- and 2.1-fold, respectively, whereas subtype 4A does not show such discriminative value (Table 1). Receiver operating characteristic (ROC) curve analyses for distinguishing HF and non-fracture patients showed the highest area under the curve (AUC) values for subtype1 when compared to the rest of the cohort (0.7837), and for subtypes 2B (0.8061), 3(0.8124, ) and 4B (0.8247) when compared to subtypes 1 and 2 combined. For distinguishing any non-vertebral fracture the AUC values were lower (0.7220, 0.7194, and 0.7412 for subtypes 2B, 3 and 4B, respectively). For HF, subtypes 2B, 3 and 4B had, respectively, an accuracy of 71.0%, 75.1% and 77.5%, sensitivity of 66.7%, 79.0% and 81.2%, specificity of 84.9%, 70.1% and 72.8%; for any non-vertebral fracture the corresponding values for sensitivity were 82.3%, 89.9% and 91.4%, and for specificity 39.4%, 27.9% and 26.5%, respectively.
On the other hand, subtypes 2A and 4A, both with P1NP/bCTX>100.0, were not discriminative for fracture presence, although in 37.7% of patients with fractures these subtypes of bone turnover were observed. These findings suggest that in subjects with subtypes 2A and 4A metabolic factors other than reflected by serum P1NP and bCTX may be more relevant for assessing bone quality and fracture development.
Bone turnover status and other parameters related to bone and mineral metabolism
The profiles of bone-mineral metabolism in subjects with different subtypes of bone turnover demonstrated, as would be expected, significant differences in a number of parameters in addition to the variables used for classification (Table 2). Subtype1, compared to subtype 2A, showed higher mean levels of bone formation markers (P1NP, OC, alkaline phosphatase [ALP]), bone resorption (bCTX), as well as P1NP/bCTX and P1NP/OC ratios. Comparison with combined data from subtypes1 and 2A revealed the following statistically significant differences in the mean values. For subtype 2B: lower P1NP, OC, ALP, phosphate, albumin and haemoglobin concentrations, P1NP/bCTX and P1NP/OC ratios, and higher bCTX and PTH levels. For subtype3: higher bCTX (2.7-fold) and lower P1NP (2-fold), ALP, magnesium, albumin, haemoglobin, transferrin saturation and GFR levels, P1NP/bCTX and P1NP/OC ratios. For subtype 4A: higher concentrations of P1NP (3.7-fold), bCTX (3.3-fold) OC, ALP (about 2-fold each), phosphate, calcium (corrected for albumin) and GGT, significantly elevated P1NP/OC ratio, but lower magnesium, albumin and haemoglobin levels. For subtype 4B: a 4.3-fold higher bCTX concentration, higher P1NP, OC (both about 2-fold), ALP, PTH, phosphate, and lower magnesium, albumin, haemoglobin and GFR levels, as well as P1NP/bCTX ratio. Subtypes 4A and 4B, despite similarities in the direction of changes in P1NP, OC, ALP, bCTX, phosphate, magnesium, albumin, haemoglobin and GFR, demonstrated significant differences. Patients with subtype 4A comparing to those with subtype 4B exhibited higher mean values for PINP, calcium (in absence of overt hypercalcaemia), P1NP/OC ratio and lower values for bCTX and PTH (p<0.001 for all variables), indicating a higher bone formation, lower bone resorption as well as a strong coupling of bone formation and resorption.
Parameters of mineral-bone metabolism and related variables in orthogeriatric patients by bone turnover status
| Variable | Bone turnover status | ||||||
|---|---|---|---|---|---|---|---|
| Subtype 1 | Subtype 2A | Subtypes 1+2A | Subtype 2B | Subtype 3 | Subtype 4A | Subtype 4B | |
| P1NP, µg/L | 46.20±18.71 | 22.85±5.85*** | 30.26±15.88 | 14.83±3.98*** | 23.02±5.84*** | 112.02±142.45*** | 50.45±19.57*** |
| bCTX, µg/L | 0.195±0.038 | 0.160±0.049*** | 0.171±0.048 | 0.190±0.036** | 0.458±0.210*** | 0.563±0.405*** | 0.740±0.317*** |
| P1NP/bCTX | 247.62±112.04 | 151.88±52.31*** | 182.28±88.34*** | 78.30±15.52*** | 57.17±22.82*** | 187.12±113.49 | 71.96±17.98*** |
| OC, pg/ml | 5.91±2.35 | 4.02±1.86*** | 4.62±2.21 | 3.86±2.65* | 4.60±2.30 | 8.48±5.32*** | 8.60±5.13*** |
| P1NP/OC | 9.36±6.58 | 6.82±3.51*** | 7.63±4.83 | 4.75±2.04*** | 6.15±3.30*** | 15.48± 17.21*** | 7.28±4.16 |
| PTH, pmol/L | 6.88±6.33 | 6.80±4.99 | 6.82±5.44 | 8.49±5.69* | 7.67± 5.21 | 6.30±4.52 | 8.65±6.09*** |
| 25(OH)D, mmol/L | 62.55±21.54 | 63.22±23.67 | 63.00±22.97 | 62.23±23.67 | 62.78±26.67 | 64.53±25.85 | 61.04±29.37 |
| Ca (corrected), mmol/L | 2.41±0.14 | 2.38±0.11 | 2.39±0.12 | 2.36±0.14 | 2.38±0.14 | 2.44±0.13*** | 2.41±0.14 |
| PO4, mmol/L | 0.87±0.22 | 0.83±0.24 | 0.84±0.23 | 0.77±0.24* | 0.84±0.23 | 0.98±0.23*** | 0.97±0.25*** |
| Mg, mmol/L | 0.79±0.08 | 0.77±0.09 | 0.78±0.09 | 0.77±0.10 | 0.76±0.11* | 0.76 ±0.10* | 0.76 ±0.09* |
| ALP, IU | 78.73±27.66 | 66.85±26.47* | 72.00±27.18 | 59.32±17.62*** | 73.48±38.20 | 112.28±104.33*** | 91.43±72.98*** |
| GGT, IU | 44.30±33.46 | 47.02±72.78 | 46.15±62.88 | 40.32±51.53 | 49.41±64.69 | 62.88±82.82* | 51.16±84.28 |
| Albumin, g/L | 34.49±3.87 | 33.90±4.06 | 34.09±4.00 | 32.82±3.6* | 31.03±3.85*** | 32.34±4.72*** | 31.07±4.40*** |
| TSAT, % | 12.52±7.68 | 11.51±7.63 | 11.82±7.64 | 9.68±6.38 | 9.65±7.00*** | 12.63±8.38 | 12.04±9.54 |
| Hb, g/L | 117.10±17.90 | 115.01±17.56 | 115.7±17.65 | 107.37±16.66** | 107.71±18.03*** | 109.00±16.93*** | 106.89±18.02*** |
| GFR, ml/min/1.73m2 | 79.43±10.50 | 78.47±14.11 | 78.77±13.05 | 74.96±14.75 | 74.24±16.77*** | 71.58±19.51*** | 67.39±22.45*** |
| Age, years | 74.4±8.63 | 75.5±8.66 | 75.1±8.65 | 77.6±8.60 | 80.4±9.17*** | 76.6±9.25 | 80.3.5±9.92*** |
Subtype 2A is compared with subtype1, while subtypes 2B, 3, 4A and 4B are compared with combined data for subtypes1 and 2A; *, p<0.05. **, p<0.01, ***, p<0.001.
Abbreviations: P1NP, N-terminal propeptide of type I procollagen; bCTX, C-terminal βcross-linked telopeptide of type I collagen; OC, osteocalcin; PO4, phosphate; Cac, calcium corrected for albumin; Mg, magnesium; ALP, alkaline phosphatase; GGT, gamma-glutamyltransferase; 25(OH)D, 25hydroxyvitamin D; PTH, parathyroid hormone; TSAT, transferrin saturation; Hb, haemoglobin; GFR, glomerular filtration rate.
Bone turnover status and clinical characteristics
We analysed the associations of bone turnover subtypes with the following chronic comorbidities: dementia, hypertension, coronary artery disease (CAD), atrial fibrillation(AF), chronic heart failure (CHF), history of myocardial infarction, stroke, transitional ischaemic attack, malignancy, peripheral vascular disease (PVD), diabetes (DM), chronic kidney disease (CKD), chronic obstructive pulmonary disease (COPD), anaemia, Parkinson's disease, osteoarthritis, and use of osteoporotic medications prior to admission. The analysis also included relation to smoking (current or ex-smoker), alcohol consumption (more than 3 times a week), use of a walking device and residential status (living in a long-term RCF).
There was no significant difference between patients with subtypes 1 and 2A in regard to sociodemographic parameters, prevalence of fractures (including HF) and comorbid conditions, as well as in mean values of most laboratory variables (except P1NP, OC, ALP, bCTX, P1NP/bCTX and P1NP/OC ratios) and short-term outcomes. Therefore, data for types 1 and 2A were combined, and other subtypes were compared with the combined data. Patients with 2B, 3, 4A and 4B subtypes showed remarkable differences in regard to clinical characteristics. Compared to subtypes1 and 2A, individuals with 3, 4A and 4B subtypes were more likely to have CKD (18.0%, 23.5% and 30.2% vs. 10.4%, respectively), anaemia (76.5%, 72.7% and 75.3% vs.56.9%), history of malignancy (12.1%, 12.1% and 11.9% vs. 6.2%), to use a walking device (42.9%,45.4% and 48.1% vs.26.1%), and least likely to receive anti-osteoporotic treatment (13.6%, 11.9% and 10.5% vs.23.2%). Patients with subtypes 3 and 4B were significantly older (+ 5 years on average) and demonstrated a significantly higher prevalence of dementia (20.2% and 17.3% vs. 9.0%, respectively), CHF (9.2% and 11.5% vs.2.8%) and hyperparathyroidism (43.8% and 49.7% vs.32.2%). Subtype 2B was also associated with hyperparathyroidism (49.1% vs. 32.2%). Subjects with subtype 3 were more likely to be residents of RCF (21.7% vs.12.8%). Subtype 4B demonstrated a lower prevalence of diabetes mellitus (DM, 18.6% vs. 26.5%) and alcohol over-users (26.8% vs. 31.8%).
Independent clinical indicators/predictors of bone turnover status
We further performed multivariate logistic regression analyses with a backward stepwise approach for presence of bone turnover subtypes 2B, 3, 4A and 4B, including in the models the following variables: dementia, CHF, anaemia, CKD, history of malignancy, DM, vitamin D status, hyperparathyroidism, hypoalbuminaemia, use of walking aids, RCF residence, alcohol overuse, smoking (current and previous), use of anti-resorptive medications (>3 months), gender and age; age was evaluated as a continuous and as a categorical(>75 years) variable in separate models. As can be seen in Table 3, following these analyses, subtype 2B was independently predicted by 2 variables, subtype 3 by 6 variables, subtype 4A by 6, and subtype 4B by 4 variables. For every year increase in age there was a 6% increase in probability of subtype 3 and a 5% increase in probability of subtype 4B. Compared to subjects with subtypes 1 and 2A, among aged>75 years the presence of subtype 2B was 1.9-fold higher and presence of subtypes 3 and 4B was 2.5-fold higher. Hyperparthyroidism was the only other independent predictor for subtype 2B. For subtypes 3, 4A and 4B hypoalbuminaemia on admission was a significant independent positive indicator while use of osteoporotic treatment was an independent negative predictor. Anaemia and history of malignancy were independent predictors of subtypes3 and 4A, presence of CHF strongly indicated subtype3, and CKD correlated independently with subtypes 4A and 4B.
Independent and significant clinical and biochemical correlates/predictors of bone turnover status in orthogeriatric patients
| Variables | Bone turnover status | |||||||||||
|---|---|---|---|---|---|---|---|---|---|---|---|---|
| Subtype 2B | Subtype 3 | Subtype 4A | Subtype 4B | |||||||||
| OR | 95%CI | P Value | OR | 95%CI | P Value | OR | 95%CI | P Value | OR | 95%CI | P Value | |
| Age | 1.06 | 1.03-1.08 | <0.001 | 1.05 | 1.03-1.07 | <0.001 | ||||||
| Age>75yrs* | 1.87 | 1.01-3.47 | 0.048 | 2.49 | 1.64-3.79 | <0.001 | 2.51 | 1.65-3.82 | <0.001 | |||
| Anaemia | 1.82 | 1.15-2.87 | 0.010 | 1.57 | 1.00-2.47 | 0.048 | ||||||
| CKD | 2.04 | 1.16-3.58 | 0.013 | 3.08 | 1.78-5.32 | <0.001 | ||||||
| CHF | 3.01 | 1.13-7.97 | 0.027 | |||||||||
| History of malignancy | 2.16 | 1.04-4.48 | 0.039 | 2.17 | 1.02-4.60 | 0.045 | ||||||
| Hyperparathyroidism | 1.87 | 1.01-3.46 | 0.046 | |||||||||
| Hypoalbuminaemia | 2.48 | 1.62-3.80 | <0.001 | 1.6 | 1.03-2.49 | 0.036 | 2.14 | 1.44-3.19 | <0.001 | |||
| OPT | 0.32 | 0.19-0.56 | <0.001 | 0.29 | 0.17-0.49 | <0.001 | 0.25 | 0.15-0.44 | <0.001 | |||
| Walking aids use | 2.3 | 1.32-3.12 | 0.001 | |||||||||
Only statistically significant associations (compared to subjects with subtypes 1 and 2A) are shown. The backward stepwise regression models included dementia, CHF, anaemia (<120g/L), CKD (GFR<60 ml/min/1.73m2), history of malignancy, diabetes mellitus, vitamin D insufficiency ( 25(OH) D<50 mmol/L) or deficiency ( 25(OH) D<25 mmol/L), hyperparathyroidism (PTH>6.8pmol/L), hypoalbuminaemia (<33g/L), use of walking aids, nursing home residence, alcohol use (> 3 times/week), smoking (current and previous), use of anti-osteoporotic medications (>3 months) and adjusted for age and gender. * evaluated in separate models.
Abbreviations: OR, odds ratio; CI, confidence interval; CKD, chronic kidney disease; CHF, chronic heart failure; OPT, osteoporotic therapy; GFR, estimated glomerular filtration rate.
Taken together, these results suggest that different bone turnover subtypes are linked to specific clinical characteristics (constellation of specific clinical variables) which can be used as indicators/predictors of altered bone turnover status. In other words, the clinical profile may serve as an early warning sign indicative of a possibly abnormal bone turnover status, and, vice versa, the bone turnover subtype may suggest the need of further evaluation for extraskeletal diseases. For example, subtype 3 is associated with and can be predicted by a clinical profile encompassing advanced age, CHF, anaemia, hypoalbuminaemia and history of malignancy. Presence of any of these conditions should raise the alarm regarding bone status and associated high risk for nonvertebral fracture, especially HF; conversely, in a patient with subtype 3 presence of previously non-diagnosed chronic conditions (e.g., CHF, anaemia, hypoalbuminaemia) as well as lack of osteoporotic treatment should be considered.
Bone turnover status and short-term outcomes
The association between bone turnover subtypes and comorbidities led us to investigate whether bone status can predict adverse in-hospital outcomes. In total, there were 32 deaths corresponding to in-hospital mortality of 2.6%: 25 (5.5%) deaths occurred among patients admitted with HF, and 7(1.8%) among subjects with non-HF. Among patients with subtype 3 there were 11(4.0%) non-survivors, among subjects with subtype 4A - 11(2.8%), among patients with subtype 4B - 9(3.0%) and among patients with subtype 2B -1(1.8%). None of the patients with subtypes 1or 2A died.
Post-operative myocardial injury with cardiac troponin I rise was observed in 444 (36.4%) patients including 16 (24.2%) with subtype 1, 36(25.0%) with subtype 2A, 16(28.1%) with subtype 2B, 125(46.0%) with subtype 3, 112(28.9%) with subtype 4A and 139(47.3%) patients with subtype 4B. Comparing to subjects with subtypes1 and 2A, the OR for this complication obtained in patients with subtype3 was 2.6(95%CI 1.7-3.9, p=0.000) and in subjects with subtype 4B 2.7(95%CI 1.8-4.1, p=0.000); after adjustment for age and gender the ORs were 2.1and 2.2, respectively (Table 4); however, these associations become non-significant in fully adjusted models.
Bone turnover status and in-hospital outcomes
| Outcomes | Bone turnover status | |||||||||||
|---|---|---|---|---|---|---|---|---|---|---|---|---|
| Subtype 2B | Subtype 3 | Subtype 4A | Subtype 4B | |||||||||
| OR | 95%CI | P Value | OR | 95%CI | P Value | OR | 95%CI | P Value | OR | 95%CI | P Value | |
| cTnI rise | 0.97 | 0.49-1.92 | 0.934 | 2.05 | 1.36-3.09 | 0.001 | 1.13 | 0.77-1.68 | 0.535 | 2.17 | 1.44-3.26 | <0.001 |
| 0.80 | 0.38-1.68 | 0.561 | 1.40 | 0.90-2.19 | 0.139 | 0.84 | 0.55-1.30 | 0.440 | 1.38 | 0.88-2.17 | 0.162 | |
| LOS>10days | 1.08 | 0.57-2.04 | 0.891 | 1.54 | 1.03-2.28 | 0.034 | 2.20 | 1.54-3.15 | <0.001 | 2.08 | 1.41-3.06 | <0.001 |
| 0.95 | 0.49-1.84 | 0.876 | 1.16 | 0.76-1.76 | 0.496 | 2.18 | 1.48-3.20 | <0.001 | 1.74 | 1.17-2.61 | 0.007 | |
| LOS>20days | 0.88 | 0.36-2.17 | 0.783 | 1.65 | 0.99-2.75 | 0.058 | 2.49 | 1.57-3.96 | <0.001 | 1.54 | 0.92-2.56 | 0.098 |
| 0.80 | 0.32-2.01 | 0.640 | 1.30 | 0.76-2.23 | 0.333 | 2.61 | 1.60-4.26 | <0.001 | 1.40 | 0.82-2.36 | 0.209 | |
| CRP>100mg/L | 1.74 | 0.92-3.29 | 0.088 | 2.40 | 1.59-3.63 | <0.001 | 1.23 | 0.87-1.74 | 0.238 | 1.30 | 0.88-1.91 | 0.184 |
| 1.67 | 0.81-3.43 | 0.165 | 1.75 | 1.12-2.72 | 0.013 | 0.97 | 0.66-1.42 | 0.883 | 0.94 | 0.61-1.44 | 0.778 | |
| CRP>150mg/L | 1.24 | 0.68-2.26 | 0.483 | 1.70 | 1.16-2.49 | 0.006 | 1.28 | 0.91- 1.81 | 0.156 | 1.49 | 1.02-2.17 | 0.038 |
| 1.18 | 0.62-2.24 | 0.622 | 1.44 | 0.96-2.15 | 0.078 | 1.04 | 0.72-1.52 | 0.821 | 1.20 | 0.80-1.78 | 0.374 | |
| New RCF d/c | 1.31 | 0.31-5.50 | 0.709 | 1.26 | 0.47-3.42 | 0.649 | 1.09 | 0.42-2.83 | 0.858 | 1.36 | 0.50-3.68 | 0.858 |
| 0.85 | 0.17-4.30 | 0.847 | 1.18 | 0.38-3.67 | 0.781 | 1.09 | 0.41-2.89 | 0.857 | 1.48 | 0.47-4.66 | 0.507 | |
Multivariate regression comparisons with subtypes1and 2A combined.
Model 1 (1st line): adjustment for age and gender. Model 2 (2nd line): included chronic heart failure, dementia, chronic kidney disease (GFR<60ml/min/1.73m2), history of malignancy, PTH>6.8pmol/L, albumin<33 g/L, anaemia (haemoglobin <120g/L), hip or any non-vertebral fracture, use of osteoporotic treatment, age and gender.
Abbreviations: OR, odds ratio; CI, confidence interval; cTnI, cardiac troponin I; LOS, length of hospital stay; CRP, C-reactive protein; RCF d/c, new discharges to a permanent residential care facility.
A high and persistent ( ≥3 days) post-operative inflammatory response was mostly related to urinary tract, respiratory or skin infections; elevated CRP of>100mg/L and >150mg/L demonstrated 553(45.3%) and 348(28.5%) patients, respectively. In models adjusted for age and gender, subtype 3 was a significant predictor of both CRP>100mg/L (OR 2.4, p<0.001) and CRP>150mg/L (OR 1.7, p=0.006), subtype 4B predicted CRP>150mg/L (OR1.5, p=0.038), while subtypes 2B and 4A were not predictive for inflammatory marker raise. In fully adjusted models, only subtype 3 showed a significant link with CRP>100mg/L (OR1.8, p=0.013).
The length of hospital stay (LOS) was ≥10 days in 530(43.3%) patients and ≥20 days in 256(20.9%). Compared to patients with subtypes1 and 2, in subjects with subtypes 3, 4A and 4B the corresponding ORs for LOS≥10 days were 1.8 (95%CI 1.2-2.7, p=0.004), 2.3 (95%CI 1.6-3.1, p=0.000) and 2.3 (95%CI 1.6-3.4, p=0.000), and for LOS≥20 days 1.8 (95%CI 1.1-3.1, p=0.026), 2.6 (95%CI 1.6-4.2, p=0.000), and 1.7 (95%CI 1.1-2.9, p=0.044), respectively. After adjusting for age and gender the ORs did not change significantly, although subtypes 3 and 4B showed borderline significance for LOS≥20 days. In fully adjusted models, a strong association remained only for subtype 4A.
New discharges to a RCF required 45(5.7%) patients: 1.9% of subjects with subtype1, 5.1% with subtype 2A and 6.8%, 6.8%, 5.2% and 6.8% of patients with subtypes 2B, 3, 4A and 4B, respectively; the differences between subtypes in the percentage of patients being discharged to RCFs did not reach statistical significance (Table 4).
Discussion
Main findings
In the current study, we proposed a model for classification bone turnover status and evaluated the clinical usefulness (advantages and limitations) of such approach. The classification scheme is based on optimal treatment targets and captures three significant and widely accepted factors of bone metabolism - bone formation, bone resorption and their ratio, indices that reflect bone remodelling in the entire skeleton. We defined six subtypes of bone turnover and showed that among hospitalized orthogeriatric patients these subtypes differed substantially in terms of clinical characteristics, including prevalence of nonvertebral fractures, especially HF, chronic comorbid conditions and in-hospital outcomes. Subtypes suggestive an imbalance in bone turnover favouring an increase in bone resorption demonstrated a good/moderate discriminative ability in regard to non-vertebral fracture presence. The study highlights the similarities and differences between subtypes and indicates that the future classification should also include other indices of bone metabolism which may better reflect bone health and fracture risk.
In osteoporosis, a multifactorial heterogeneous disease, bone formation and bone resorption, though mutually dependent through crosstalk between osteoblasts and osteoclasts, may be affected differently, and, not surprisingly, various patterns of bone metabolism (determined by specific genetic, metabolic and clinical factors) occur. The present study, to our knowledge, is the first of its kind, evaluating the clinical significance of different subtypes of bone turnover markers in the elderly. Identifying the bone turnover status in the elderly is an important key to better understand underlying pathophysiological mechanisms and may have an advantage in at least three areas: individualized management, prediction of nonvertebral fractures, and prognosis of in-hospital outcomes. Table 5 presents an overview of our findings.
Overview of the relationships between altered bone turnover status and presence of non-vertebral fracture, clinical characteristics and in-hospital outcomes
| Bone turnover status | ||||
|---|---|---|---|---|
| Subtype 2B | Subtype 3 | Subtype 4A | Subtype 4B | |
| Fracture risk (compared to subtypes 1 and 2): | ||||
| HF, (OR) | ↑,3.2 | ↑,2.4 | ↑,2.5 | |
| Any fracture, (OR) | ↑,2.0 | ↑,1.7 | ↑,2.1 | |
| Independent clinical indicators/predictors: | ||||
| Age>75years, (OR) | ↑,1.9 | ↑,2.5 | ↑,2.5 | |
| Hypoalbuminaemia,(OR) | ↑,2.5 | ↑,1.6 | ↑,2.1 | |
| Anaemia, (OR) | ↑,1.8 | ↑,1.6 | ||
| CKD, (OR) | ↑,2.0 | ↑,3.1 | ||
| CHF, (OR) | ↑,3.0 | |||
| Hyperparathyroidism, (OR) | ↑,1.9 | |||
| History of malignancy, (OR) | ↑,2.1 | ↑,2.2 | ||
| Walking aids use, (OR) | ↑,2.3 | |||
| OPT, (OR) | ↓,0.32 | ↓,0.29 | ↓,0.25 | |
| In-hospital outcomes: | ||||
| Myocardial injury with cTnI rise, (OR) | ↑, 2.1* | ↑,2.2* | ||
| LOS>10 days, (OR) | ↑,1.5* | ↑,2.2 | ↑,1.7 | |
| LOS>20 days, (OR) | ↑,2.6 | |||
| CRP>100mg/L, (OR) | ↑,1.8 | |||
| CRP>150mg/L, (OR) | ↑,1.7* | ↑,1.5* | ||
| In- hospital death, (%) | 1.8 | 4 | 2.8 | 3 |
Data reflect only statistically significant results compared to subtypes 1 and 2A (combined) in multivariate adjusted regression models; the asterisk (*) indicates statistical significance in models adjusted only for age and gender.
Abbreviations: OR, odds ratio; CHF, chronic heart failure; CKD, chronic kidney disease; cTnI, cardiac troponin I; LOS, length of hospital stay; CRP, C-reactive protein (marker of systemic inflammatory response).
Classification of bone turnover status
Our classification is three-fold: it takes into account bone formation, bone resorption and the balance between these processes. Due to existing controversy concerning reference intervals of BTMs, for classification we used as cutoffs values recently proposed optimal treatment targets for anti-resorptive therapy. It worthy of mention in this connection that many, but not all [1, 12], studies suggested that P1NP and bCTX may provide information about both response to treatment and reduction of fracture risk following osteoporotic therapy with antiresorptive [7, 23, 24, 26, 48, 51, 52] or anabolic [6, 53-59] agents. Almost all published studies demonstrated reduction in serum bCTX during antiresorptive therapy and rise in serum P1NP during therapy with teriparatide; these changes have been associated with an improvement in BMD and reduced fracture risk. The importance to examine the balance between formation and resorption when evaluating bone turnover has also been recognized [60-64].
Bone turnover status and fractures
Despite the wide heterogeneity of bone turnover markers, from low to significantly elevated, even within the same fracture type, specific subtypes of turnover status demonstrate different impact on fracture development, and may, therefore, provide a rough estimate of individual risk. Elevated BTMs, a sign of an increased turnover rate, is commonly reported as a factor which adversely influences BMD and increases fracture risk. Consistent with this data, in our study, high levels of both biomarkers were found in 55.1% of all patients with fractures. In this context, the low prevalence of fractures among subjects with subtype1 (normal bCTX and P1NP>32 µg/L and, especially, with P1NP>62 µg/L), appears to contradict previous studies, who found a protective effect of low P1NP. In the present study, among patients with bCTX<0.250 μg/L, higher levels of P1NP were associated with lower prevalence of fractures: with P1NP>32 μg/L there were in total 67(5.5%) patients [11(2.4%) among HFs], including with P1NP levels between 32 μg/L and 62 μg/L - 35(4.1%) patients [10(2.2%) among HFs] and with P1NP>62 μg/L only 4(0.47%) patients [including 1(0.22%) among HFs], whereas with P1NP<32 μg/L there were 130(15.3%) patients [64(14.2%) among HFs]. On the other hand, bCTX was elevated in 683(91.1%) of 750 subjects with P1NP>32 µg/L and in 272(96.8%) of 281 patients with P1NP>62 µg/L. These data strongly suggest that higher P1NP becomes a risk factor for fracture only in the presence of elevated bCTX and lower P1NP/bCTX ratio (subtype 4B), showing that the ratio is of major importance in assessing bone status rather than each of the markers taken alone; it appears that well-balanced formation/resorption processes are protective. These observations indicate that an increase or a decrease in serum P1NP can be related to positive or negative effects, depending on the bCTX level and P1NP/bCTX ratio, and should not be interpreted in isolation. These data may explain the conflicting results in the literature on the associations between P1NP, BMD and fractures [42, 65-67].
Obviously, bone turnover status as defined by subtypes is more closely related to presence of osteoporotic fractures compared with separate indicators of bone metabolism. Patients with subtypes 2B, 3 and 4B, compared to those with subtypes1 and 2A, have a 3.2-, 2.4- and 2.5-fold increase in risk for HF, respectively, and a 2.0-, 1.7- and 2.1-fold increase in risk for any nonvertebral fracture, respectively. Subtypes 2B, 3 and 4B showed good AUC values (0.8061- 0.8247) for HF, and fair AUC values (0.7194 - 0.7412) for any nonvertebral fracture, and had an acceptable sensitivity for estimating risk of any fracture of 82.3%, 89.9% and 91.4%, respectively, but a low specificity (39.4%, 27.9% and 26.5%, respectively). These data shows that dysregulation in skeletal metabolism causing bone frailty is a necessary but not a sufficient condition for fracture development. A nonvertebral bone fracture usually occurs as a result of a fall in a person with frail bones. The deterioration of main components of bone strength - bone mass, microarchitecture and remodelling/metabolism - not always remains in parallel; bone quality is only partially reflected by BTMs. Most patients with osteoporosis (as defined by BMD) do not have a fracture and at least half of fractures occur in patients without osteoporosis, while both high and low BTMs are associated with increased fracture risk. Subtypes 2B, 3 and 4B because of their relatively high sensitivity can be useful as screening tools to identify patients at fracture risk. However, subtype 4A (both markers elevated and the ratio P1NP/bCTX >100.0) which constituted 27.5% of all patients with fractures (22.6% among all HF patients), does not discriminate presence of nonvertebral fractures against subtypes 1 and 2A (seen in 14.8% of all patients with fractures and in 10.9% of HF patients). The fact that fractures in subjects with subtype 4A are not entirely explained by elevated P1NP and bCTX may suggest that high bone turnover with preserved P1NP/bCTX ratio occur rather as a compensatory/adaptive response to bone loss but it is not sufficient enough to provide adequate bone quality and prevent fracture. Apparently, the described classification model does not completely represent the (patho)physiology of bone metabolism; P1NP, bCTX and their ratio reflect important but not all factors contributing to bone health and fragility fractures, and additional biomarkers are required to characterise more accurately bone quality and predict fractures, especially in subjects with subtype 4A.
Nevertheless, the results of the study raise the possibility that identifying subtypes of bone turnover may provide the basis for pharmaceutical treatment decisions: (a) focus on those at greatest risk and avoid complications of therapy (although current osteoporotic drugs are relatively benign) in individuals with low risk, and (b) choose between therapeutics which mainly suppress bone resorption or stimulate bone formation.
Bone turnover status and other indices of bone and mineral metabolism
Compared to subjects with subtypes1 and 2A, patients with subtypes 2B-4B demonstrated significant differences in calcium (higher in subtype 4A), phosphate (lower in subtype 2B and higher in 4A and 4B), magnesium (lower in subtypes 3, 4A and 4B) and PTH concentrations (elevated in subtypes 2B and 4B), as well as in P1NP/OC ratio (decreased in subtypes 2B and 3 but elevated in subtype 4A). These heterogeneous disturbances of parameters of mineral-bone metabolism reflect the complexities underneath the bone turnover subtypes indicating, among other mechanisms, the important role of fibroblast growth factor 23 (FGF23), a hormone secreted mainly by osteocytes that modulates serum phosphate balance, PTH and 1,25(OH) vitamin D synthesis [68-71] and sclerostin, a glycoprotein also produced by mature osteocytes that influences differentiation and survival of osteoblasts [72-74]. It could be speculated that these and other hormones, not evaluated in this study, may be the modifying factors contributing to bone fragility and fractures, especially in subjects with subtype 4A.
Our findings add to previous studies linking separate BTMs with fracture risk evidence of higher discriminative value of specific bone turnover subtypes, and also suggest that other biomarkers of bone metabolism need to be included in the classification to improve fracture prediction and identify novel therapeutic targets in the geriatric population.
Bone turnover status and chronic clinical conditions
Although age-related chronic diseases and frailty [75-81] are among known factors predisposing to bone loss, falls and fractures, no previous studies evaluated the relationship between bone turnover status and clinical characteristics. Our data clearly showed that in the elderly, subtypes of bone metabolism are associated with and can be predicted by specific clinical conditions. On univariate analyses 16 different variables were associated with distinct bone turnover subtypes. Backward stepwise linear regression analyses after adjusting for main confounders revealed several chronic conditions as independent and significant predictors/indicators of specific bone turnover subtypes (Tables 3 and 5). Among patients with subtypes 2B, 3, and 4B the proportion of aged >75 years was 1.9-2.5 times higher than in those with subtypes 1 and 2A. Other independent correlates included the following: for subtype 2B - hyperthyroidism; for subtype 3 - hypoalbuminaemia, anaemia, CHF, and history of malignancy; for subtype 4A - hypoalbuminaemia, anaemia, CKD, history of malignancy and use of walking aids; for subtype 4B - hypoalbuminaemia and CKD. Despite an overlap between the variables, specific conditions characterised the respective subtype. Each of these clinical variables indicated the presence of a specific bone turnover subtype with an OR of 1.6-3.1 (Tables 3 and 5). As would be expected, OPT was inversely associated with subtypes 3, 4A and 4B (risk decreased by 68-75%). The observation that OPT may be highly effective is important because in recent years worldwide the percentage of OPT users has declined [82-84]. In our cohort, approximately 85% of patients did not receive OPT.
Our results are in line with numerous evidences of multidirectional (patho)physiological links between the skeleton as a dynamic, metabolically active organ and the cardiovascular, renal, liver, endocrine, nervous and immune systems. Our observations complement the results from many previous studies showing positive bi- and multi-directional relationships between osteoporosis, falls and fractures, on one hand, and chronic conditions such as CKD [71, 85-90], CVDs [91-104], anaemia [105-111], hypoalbuminaemia [112-114] and hyperthyroidism [115-119] on the other, supporting the concept that osteoporosis is a systemic disease.
Despite the growing knowledge of bone-extraskeletal interactions, the reasons and implications for this connection(s) remain not fully understood. These associations may be driven by shared risk factors (advanced age, reduced physical activity, malnutrition, disturbed inflammatory and antioxidant responses, etc.), common genetic basis and multiple common biochemical pathways involved in the regulation of both bone and extraskeletal metabolism (PTH, 25(OH) vitamin D, osteoprotegerin/RANK ligand/RANK axis, FGF23, sclerostin-Klotho axis, bone morphogenetic proteins, adipocytokines, autonomic nervous system). Given the wide range of genetic, metabolic and environmental (medications, smoking, alcohol, etc) factors influencing production, release and removal of P1NP and bCTX, it is not surprising that different subtypes of bone turnover status reflecting altered mechanisms of either bone formation or bone resorption or both were found to be associated with different chronic conditions. It can be assumed that common factors contribute to constellation of specific patterns of abnormal metabolism (including bone metabolism) and diseases, predisposing to falls and osteoporotic fractures. The presence of relatively specific clinical profiles for each turnover subtype implies that altered turnover status may serve as a warning sign for both frail bones and extraskeletal diseases. The provided data suggests that in an elderly person presenting with the abovementioned clinical conditions it would be worth considering impaired bone turnover (with increased fracture risk) and the need for special bone examination, and vice versa, presence of an unfavourable turnover status may help to identify earlier individuals with serious medical problems requiring intervention (e.g. CKD, CHF, anaemia), despite the absence of clinical signs and symptoms.
Bone turnover status and outcomes
In older orthopaedic patients, hospital complication rates are high (up to 50 % after surgery for hip fracture) indicating a vital need of early identification of individuals prone to postoperative morbidity and mortality. This study demonstrated for the first time that in the orthogeriatric population, altered bone turnover status is associated with poorer in-hospital outcomes, and that specific subtypes independently of established clinical risk factors (age, gender and presence of multi-morbidities) predict myocardial injury, high inflammatory response, prolonged LOS, and all-cause mortality. Subtypes 3, 4A and 4B accounted for 31 (96.9%) of 32 in-hospital deaths, while no fatal outcomes occurred among 211 subjects with subtypes 1 and 2A. This observation is in line with studies on older adults living in the community or RCFs showing a positive association between all-cause mortality and bCTX levels [120-123] as well as osteoporosis defined by BMD [124-128].
Models adjusted for age and gender demonstrated that, compared to subjects with subtypes 1 and 2A, patients with subtype 3 had a significantly higher risk of developing postoperative myocardial injury (OR 2.1), inflammatory/infective complications with CRP>100 mg/L (OR 2.4) and LOS>10 days (OR 1.5). Similarly, subtype 4A was predictive for prolong hospitalisation (for LOS>10 days OR 2.2 and for LOS>20 days OR 2.5), and subtype 4B indicated an increased risk of myocardial injury (OR 2.2), high inflammatory response with CRP>150 mg/L (OR 1.5) and LOS>10 days (OR 2.1). After controlling for multiple comorbidities, presence of HF or any non-vertebral fracture, OPT, age and gender (fully adjusted models, Tables 4 and 5), subtype 3 remained a significant independent predictor for CRP>150 mg/L (OR 1.7), subtype 4A for prolonged LOS (OR 2.2 and 2.6 for LOS>10 days and >20 days, respectively), and subtype 4B for LOS>10 days (OR 1.7). Compared to subtypes 1 and 2A, the subtype 2B did not demonstrate significant associations with the outcomes. These analyses show that turnover subtypes independently of a variety of clinical characteristics (on admission) known to adversely affect outcomes can help in individualized risk assessment identifying patients in whom poorer outcomes to be expected and additional interventions planned.
No studies on predictive value of bone turnover status for hospital outcomes in orthogeriatric patients have been reported. Previous studies found in critically ill patients on admission significantly elevated bone resorption markers, including bCTX levels ([129-133]), and low-normal P1NP levels [132, 133]. Lower BMD was shown to predict myocardial infarction in men and women during 5.7 years of follow-up [97]. Other studies identified higher P1NP levels as a risk factor for incident myocardial infarction in older men followed for 7 years [134] and as a biomarker of frailty [77].
Taking together, the study illuminates the close and complex relationship between bone turnover status, nonvertebral fractures, functioning of other systems and in-hospital outcomes.
The proposed classification model of bone turnover status may be of relevance for clinical management, as well as for research. While requiring further replication, our data highlights the heterogeneity of bone turnover status, identifies distinct subtypes, their association with chronic conditions and usefulness for better patient stratification for more individualised approaches. This pilot classification is a first step towards integrative understanding bone metabolism, further exploration of the underlying pathophysiologic differences between various turnover subtypes is needed. Subtyping could be improved by adding new biomarkers. The combination of bone turnover subtypes with other diagnostic and prognostic tools may improve the preventive and treatment strategies for the elderly.
Limitations and strengths
Several limitations of our study should be considered. Firstly, we recognize the limitations of the classification model: it is based on BTM values proposed as treatment targets, the cutoffs are arbitrarily chosen, the two markers analysed reflect mainly the function of osteoblasts and osteoclasts, but biochemical indicators of the osteocyte activity, important factors in the maintenance of skeletal integrity [135], are not included (currently these markers are used for research purposes). Therefore, the pathogenesis of bone metabolism is only partially represented by various subtypes, and there is no evidence at present that all patients with a particular subtype share the same metabolic defect(s). Although the proposed classification brings a conceptual shift in our understanding of the pathophysiology and clinical applications of bone turnover status, additional biochemical indicators of the complex multilayered regulatory mechanisms need to be found and considered in future classification. The model, despite its limitations, illustrates the clinical opportunities of an integrative approach based on simultaneous use of a formation and resorption marker and their ratio compared to those which relied on analysis of these biomarkers separately. Secondly, the subjects in our study do not represent the general population, they were selected from hospitalised orthogeriatric patients, and a significant proportion of individuals admitted without fractures may have had undiagnosed/undocumented osteoporosis. Thirdly, the study has been done in a single centre, and the patients were mainly Caucasian; that could affect the generalizability of the results. Fourthly, the cross-sectional design of the study does not allow causal conclusions, and, despite multivariate analyses with extensive adjustment for potential confounders, the possibility of residual unmeasured confounders could not be excluded.
Our study has also several strengths. For the first time, a practical method for subtyping bone turnover status using three criteria (both serum bone formation and bone resorption markers and their ratio as a reflection of the bone turnover balance) was provided. Six bone turnover subtypes were identified and in a relatively large cohort of orthogeriatric patients clear relationships between bone turnover status and presence of nonvertebral fracture, chronic comorbid conditions and in-hospital outcomes have been shown.
Conclusions
We proposed a classification model of bone turnover status based on a combination of serum bone formation and resorption markers and demonstrated that in orthogeriatric patients altered subtypes are closely related to presence of nonvertebral fractures, comorbidities and poorer in-hospital outcomes. However, the pathogenesis of bone metabolism is only partially represented by this classification, and the future subtyping model could be improved by adding other biomarkers. Further research is needed to establish optimal cut points of various BTMs, improve the classification and achieve more-individualized prognosis and treatments.
Competing Interests
The authors have declared that no competing interest exists.
References
1. Burch J, Rice S, Yang H. et al. Systematic review of the use of bone turnover markers for monitoring the response to osteoporosis treatment: the secondary prevention of fractures, and primary prevention of fractures in high-risk groups. Health Technol Assess. 2014;18(11):1-180
2. Eastell R, Szulc P. Use of bone turnover markers in postmenopausal osteoporosis. Lancet Diabetes Endocrinol. 2017;5(11):908-923
3. Eastell R, Walsh JS, Watts NB, Siris E. Bisphosphonates for postmenopausal osteoporosis. Bone. 2011;49(1):82-88
4. Garnero P. The Utility of Biomarkers in Osteoporosis Management. Mol Diagn Ther. 2017;21(4):401-418
5. Greenblatt MB, Tsai JN, Wein MN. Bone Turnover Markers in the Diagnosis and Monitoring of Metabolic Bone Disease. Clin Chem. 2017;63(2):464-474
6. Tsujimoto M, Chen P, Miyauchi A, Sowa H, Krege JH. PINP as an aid for monitoring patients treated with teriparatide. Bone. 2011;48(4):798-803
7. Vasikaran S, Eastell R, Bruyere O. et al. Markers of bone turnover for the prediction of fracture risk and monitoring of osteoporosis treatment: a need for international reference standards. Osteoporos Int. 2011;22(2):391-420
8. Biver E. Use of bone turnover markers in clinical practice. Curr Opin Endocrinol Diabetes Obes. 2012;19(6):468-473
9. Szulc P, Naylor K, Hoyle NR. et al. Use of CTX-I and PINP as bone turnover markers: National Bone Health Alliance recommendations to standardize sample handling and patient preparation to reduce pre-analytical variability. Osteoporos Int. 2017 [Epub ahead of print]
10. Vescini F, Attanasio R, Balestrieri A. et al. Italian association of clinical endocrinologists (AME) position statement: drug therapy of osteoporosis. J Endocrinol Invest. 2016;39(7):807-834
11. Seibel MJ. Biochemical markers of bone turnover: part I: biochemistry and variability. Clin Biochem Rev. 2005;26(4):97-122
12. Kanis JA, McCloskey E, Branco J. et al. Goal-directed treatment of osteoporosis in Europe. Osteoporos Int. 2014;25(11):2533-2543
13. Cheung AM, Frame H, Ho M, Mackinnon ES, Brown JP. Bone strength and management of postmenopausal fracture risk with antiresorptive therapies: considerations for women's health practice. Int J Womens Health. 2016;8:537-547
14. Coen G, Ballanti P, Bonucci E. et al. Bone markers in the diagnosis of low turnover osteodystrophy in haemodialysis patients. Nephrol Dial Transplant. 1998;13(9):2294-2302
15. Dai Z, Wang R, Ang LW, Yuan JM, Koh WP. Bone turnover biomarkers and risk of osteoporotic hip fracture in an Asian population. Bone. 2016;83:171-177
16. Ebeling PR, Atley LM, Guthrie JR. et al. Bone turnover markers and bone density across the menopausal transition. J Clin Endocrinol Metab. 1996;81(9):3366-3371
17. Kuo TR, Chen CH. Bone biomarker for the clinical assessment of osteoporosis: recent developments and future perspectives. Biomark Res. 2017;5:18
18. Watts NB, Miller PD. Changing perceptions in osteoporosis. Markers should be used as adjunct to bone densitometry. BMJ. 1999;319(7221):1371-1372
19. Rogers A, Hannon RA, Eastell R. Biochemical markers as predictors of rates of bone loss after menopause. J Bone Miner Res. 2000;15(7):1398-1404
20. Seeman E, Nguyen TV. Bone remodeling markers: so easy to measure, so difficult to interpret. Osteoporos Int. 2016;27(1):33-35
21. Manolagas SC, Parfitt AM. What old means to bone. Trends Endocrinol Metab. 2010;21(6):369-374
22. Vasikaran SD, Chubb SA. The use of biochemical markers of bone turnover in the clinical management of primary and secondary osteoporosis. Endocrine. 2016;52(2):222-225
23. Chubb SA, Byrnes E, Manning L. et al. Bone turnover markers: Defining a therapeutic target. Clin Biochem. 2017;50(3):162-163
24. Chubb SA, Mandelt C, Vasikaran S. Comparison of clinical cut-points and treatment targets for urine NTX and plasma betaCTX-I in osteoporosis. Clin Biochem. 2016;49(7-8):529-533
25. Delmas PD, Eastell R, Garnero P. et al. The use of biochemical markers of bone turnover in osteoporosis. Committee of Scientific Advisors of the International Osteoporosis Foundation. Osteoporos Int. 2000;11(Suppl 6):S2-17
26. Morris HA, Eastell R, Jorgensen NR. et al. Clinical usefulness of bone turnover marker concentrations in osteoporosis. Clin Chim Acta. 2017;467:34-41
27. Ardawi MS, Maimani AA, Bahksh TA. et al. Reference intervals of biochemical bone turnover markers for Saudi Arabian women: a cross-sectional study. Bone. 2010;47(4):804-814
28. de Papp AE, Bone HG, Caulfield MP. et al. A cross-sectional study of bone turnover markers in healthy premenopausal women. Bone. 2007;40(5):1222-1230
29. Gossiel F, Finigan J, Jacques R. et al. Establishing reference intervals for bone turnover markers in healthy postmenopausal women in a nonfasting state. Bonekey Rep. 2014;3:573
30. Adami S, Bianchi G, Brandi ML. et al. Determinants of bone turnover markers in healthy premenopausal women. Calcif Tissue Int. 2008;82(5):341-347
31. Glover SJ, Garnero P, Naylor K, Rogers A, Eastell R. Establishing a reference range for bone turnover markers in young, healthy women. Bone. 2008;42(4):623-630
32. Martinez J, Olmos JM, Hernandez JL. et al. Bone turnover markers in Spanish postmenopausal women: the Camargo cohort study. Clin Chim Acta. 2009;409(1-2):70-74
33. Eastell R, Garnero P, Audebert C, Cahall DL. Reference intervals of bone turnover markers in healthy premenopausal women: results from a cross-sectional European study. Bone. 2012;50(5):1141-1147
34. Jenkins N, Black M, Paul E. et al. Age-related reference intervals for bone turnover markers from an Australian reference population. Bone. 2013;55(2):271-276
35. Michelsen J, Wallaschofski H, Friedrich N. et al. Reference intervals for serum concentrations of three bone turnover markers for men and women. Bone. 2013;57(2):399-404
36. Hu WW, Zhang Z, He JW. et al. Establishing reference intervals for bone turnover markers in the healthy shanghai population and the relationship with bone mineral density in postmenopausal women. Int J Endocrinol. 2013;2013:513925
37. Nomura Y, Yoshizaki A, Yoshikata H. et al. Study of the distribution by age group of serum cross-linked C-terminal telopeptide of type I collagen and procollagen type I N-propeptide in healthy Japanese women to establish reference values. J Bone Miner Metab. 2013;31(6):644-651
38. Hannemann A, Wallaschofski H. Reference intervals for serum concentrations of three bone turnover markers for men and women. Bone. 2016;93:216
39. Wu XY, Li HL, Xie H. et al. Age-related bone turnover markers and osteoporotic risk in native Chinese women. BMC Endocr Disord. 2014;14:8
40. Guanabens N, Filella X, Monegal A. et al. Reference intervals for bone turnover markers in Spanish premenopausal women. Clin Chem Lab Med. 2016;54(2):293-303
41. Shigdel R, Osima M, Lukic M. et al. Determinants of Transitional Zone Area and Porosity of the Proximal Femur Quantified In Vivo in Postmenopausal Women. J Bone Miner Res. 2016;31(4):758-766
42. Bauer DC, Garnero P, Harrison SL. et al. Biochemical markers of bone turnover, hip bone loss, and fracture in older men: the MrOS study. J Bone Miner Res. 2009;24(12):2032-2038
43. Chubb SA, Byrnes E, Manning L. et al. Reference intervals for bone turnover markers and their association with incident hip fractures in older men: the Health in Men study. J Clin Endocrinol Metab. 2015;100(1):90-99
44. Olmos JM, Hernandez JL, Martinez J. et al. Bone turnover markers in Spanish adult men The Camargo Cohort Study. Clin Chim Acta. 2010;411(19-20):1511-1515
45. Shou Z, Jin X, Bian P, Li X, Chen J. Reference intervals of beta-C-terminal telopeptide of type I collagen, procollagen type I N-terminal propeptide and osteocalcin for very elderly Chinese men. Geriatr Gerontol Int. 2017;17(5):773-778
46. Eastell R, Christiansen C, Grauer A. et al. Effects of denosumab on bone turnover markers in postmenopausal osteoporosis. J Bone Miner Res. 2011;26(3):530-537
47. Naylor KE, Jacques RM, Paggiosi M. et al. Response of bone turnover markers to three oral bisphosphonate therapies in postmenopausal osteoporosis: the TRIO study. Osteoporos Int. 2016;27(1):21-31
48. Diez-Perez A, Naylor KE, Abrahamsen B. et al. International Osteoporosis Foundation and European Calcified Tissue Society Working Group. Recommendations for the screening of adherence to oral bisphosphonates. Osteoporos Int. 2017;28(3):767-774
49. Glover SJ, Gall M, Schoenborn-Kellenberger O. et al. Establishing a reference interval for bone turnover markers in 637 healthy, young, premenopausal women from the United Kingdom, France, Belgium, and the United States. J Bone Miner Res. 2009;24(3):389-397
50. Li JW, Xu C, Fan Y, Wang Y, Xiao YB. Can serum levels of alkaline phosphatase and phosphate predict cardiovascular diseases and total mortality in individuals with preserved renal function? A systemic review and meta-analysis. PLoS One. 2014;9(7):e102276
51. Naylor KE, Jacques RM, Peel NF, Gossiel F, Eastell R. Response of bone turnover markers to raloxifene treatment in postmenopausal women with osteopenia. Osteoporos Int. 2016;27(8):2585-2592
52. Idolazzi L, Rossini M, Viapiana O. et al. Teriparatide and denosumab combination therapy and skeletal metabolism. Osteoporos Int. 2016;27(11):3301-3307
53. Miyauchi A, Matsumoto T, Sugimoto T. et al. Effects of teriparatide on bone mineral density and bone turnover markers in Japanese subjects with osteoporosis at high risk of fracture in a 24-month clinical study: 12-month, randomized, placebo-controlled, double-blind and 12-month open-label phases. Bone. 2010;47(3):493-502
54. Eastell R, Vrijens B, Cahall DL. et al. Bone turnover markers and bone mineral density response with risedronate therapy: relationship with fracture risk and patient adherence. J Bone Miner Res. 2011;26(7):1662-1669
55. Ryder KM, Tanner SB, Carbone L. et al. Teriparatide is safe and effectively increases bone biomarkers in institutionalized individuals with osteoporosis. J Bone Miner Metab. 2010;28(2):233-239
56. Blumsohn A, Marin F, Nickelsen T. et al. Early changes in biochemical markers of bone turnover and their relationship with bone mineral density changes after 24 months of treatment with teriparatide. Osteoporos Int. 2011;22(6):1935-1946
57. Koivula MK, Risteli L, Risteli J. Measurement of aminoterminal propeptide of type I procollagen (PINP) in serum. Clin Biochem. 2012;45(12):920-927
58. Krege JH, Lane NE, Harris JM, Miller PD. PINP as a biological response marker during teriparatide treatment for osteoporosis. Osteoporos Int. 2014;25(9):2159-2171
59. Tsai JN, Burnett-Bowie SM, Lee H, Leder BZ. Relationship between bone turnover and density with teriparatide, denosumab or both in women in the DATA study. Bone. 2017;95:20-25
60. Fisher A, Srikusalanukul W, Fisher L, Smith PN. Lower serum P1NP/betaCTX ratio and hypoalbuminemia are independently associated with osteoporotic nonvertebral fractures in older adults. Clin Interv Aging. 2017;12:1131-1140
61. Bieglmayer C, Kudlacek S. The bone marker plot: an innovative method to assess bone turnover in women. Eur J Clin Invest. 2009;39(3):230-238
62. Nakatoh S. The importance of assessing the rate of bone turnover and the balance between bone formation and bone resorption during daily teriparatide administration for osteoporosis: a pilot study. J Bone Miner Metab. 2016;34(2):216-224
63. Nakatoh S. Effect of osteoporosis medication on changes in bone mineral density and bone turnover markers after 24-month administration of daily teriparatide: comparison among minodronate, raloxifene, and eldecalcitol. J Bone Miner Metab. 2017 Mar 14 [Epub ahead of print]
64. Shieh A, Han W, Ishii S. et al. Quantifying the Balance Between Total Bone Formation and Total Bone Resorption: An Index of Net Bone Formation. J Clin Endocrinol Metab. 2016;101(7):2802-2809
65. Szulc P, Delmas PD. Biochemical markers of bone turnover: potential use in the investigation and management of postmenopausal osteoporosis. Osteoporos Int. 2008;19(12):1683-1704
66. Finnes TE, Lofthus CM, Meyer HE. et al. Procollagen type 1 amino-terminal propeptide (P1NP) and risk of hip fractures in elderly Norwegian men and women. A NOREPOS study. Bone. 2014;64:1-7
67. Seguro LP, Casella CB, Caparbo VF. et al. Lower P1NP serum levels: a predictive marker of bone loss after 1 year follow-up in premenopausal systemic lupus erythematosus patients. Osteoporos Int. 2015;26(2):459-467
68. Martin A, David V, Quarles LD. Regulation and function of the FGF23/klotho endocrine pathways. Physiol Rev. 2012;92(1):131-155
69. Sapir-Koren R, Livshits G. Bone mineralization is regulated by signaling cross talk between molecular factors of local and systemic origin: the role of fibroblast growth factor 23. Biofactors. 2014;40(6):555-568
70. Hu MC, Shiizaki K, Kuro-o M, Moe OW. Fibroblast growth factor 23 and Klotho: physiology and pathophysiology of an endocrine network of mineral metabolism. Annu Rev Physiol. 2013;75:503-533
71. Iwasaki Y, Kazama JJ, Fukagawa M. Molecular Abnormalities Underlying Bone Fragility in Chronic Kidney Disease. Biomed Res Int. 2017;2017:3485785
72. Baron R, Rawadi G. Wnt signaling and the regulation of bone mass. Curr Osteoporos Rep. 2007;5(2):73-80
73. Delgado-Calle J, Sato AY, Bellido T. Role and mechanism of action of sclerostin in bone. Bone. 2017;96:29-37
74. Kim SW, Lu Y, Williams EA. et al. Sclerostin Antibody Administration Converts Bone Lining Cells Into Active Osteoblasts. J Bone Miner Res. 2017;32(5):892-901
75. Seibel MJ. Biochemical markers of bone turnover part II: clinical applications in the management of osteoporosis. Clin Biochem Rev. 2006;27(3):123-138
76. Cavalier E, Bergmann P, Bruyere O. et al. The role of biochemical of bone turnover markers in osteoporosis and metabolic bone disease: a consensus paper of the Belgian Bone Club. Osteoporos Int. 2016;27(7):2181-2195
77. Alvarez-Rios AI, Guerrero JM, Garcia-Garcia FJ. et al. Associations between frailty and serum N-terminal propeptide of type I procollagen and 25-hydroxyvitamin D in older Spanish women: The Toledo Study for Healthy Aging. Exp Gerontol. 2015;69:79-84
78. Chen JS, Simpson JM, March LM. et al. Risk factors for fracture following a fall among older people in residential care facilities in Australia. J Am Geriatr Soc. 2008;56(11):2020-2026
79. Gielen E, Bergmann P, Bruyere O. et al. Osteoporosis in Frail Patients: A Consensus Paper of the Belgian Bone Club. Calcif Tissue Int. 2017;101(2):111-131
80. Sambrook PN, Cameron ID, Chen JS. et al. Influence of fall related factors and bone strength on fracture risk in the frail elderly. Osteoporos Int. 2007;18(5):603-610
81. Wiklund R, Toots A, Conradsson M. et al. Risk factors for hip fracture in very old people: a population-based study. Osteoporos Int. 2016;27(3):923-931
82. McClung M, Baron R, Bouxsein M. An update on osteoporosis pathogenesis, diagnosis, and treatment. Bone. 2017;98:37
83. Kanis JA, Cooper C, Rizzoli R. et al. Identification and management of patients at increased risk of osteoporotic fracture: outcomes of an ESCEO expert consensus meeting. Osteoporos Int. 2017;28(7):2023-2034
84. Khosla S, Cauley JA, Compston J. et al. Addressing the Crisis in the Treatment of Osteoporosis: A Path Forward. J Bone Miner Res. 2016 Dec 29 [Epub ahead of print]
85. Miller PD. Chronic kidney disease and the skeleton. Bone Res. 2014;2:14044
86. Kazama JJ. Chronic kidney disease and fragility fracture. Clin Exp Nephrol. 2017;21(Suppl 1):46-52
87. Moe SM. Renal Osteodystrophy or Kidney-Induced Osteoporosis? Curr Osteoporos Rep. 2017;15(3):194-197
88. Torres PA, Cohen-Solal M. Evaluation of fracture risk in chronic kidney disease. J Nephrol. 2017;30(5):653-661
89. Ott SM. Review: Osteoporosis drugs may improve BMD and reduce fractures in some patients with CKD. Ann Intern Med. 2017;167(4):JC19
90. Wilson LM, Rebholz CM, Jirru E. et al. Benefits and Harms of Osteoporosis Medications in Patients With Chronic Kidney Disease: A Systematic Review and Meta-analysis. Ann Intern Med. 2017;166(9):649-658
91. Carbone LD, Buzkova P, Fink HA. et al. Association of Plasma SDF-1 with Bone Mineral Density, Body Composition, and Hip Fractures in Older Adults: The Cardiovascular Health Study. Calcif Tissue Int. 2017;100(6):599-608
92. Kenny AM, Boxer R, Walsh S, Hager WD, Raisz LG. Femoral bone mineral density in patients with heart failure. Osteoporos Int. 2006;17(9):1420-1427
93. Lyles KW, Colon-Emeric CS. Does low bone mineral density cause a broken heart? JACC Heart Fail. 2014;2(4):390-391
94. Pfister R, Michels G, Sharp SJ. et al. Low bone mineral density predicts incident heart failure in men and women: the EPIC (European Prospective Investigation into Cancer and Nutrition)-Norfolk prospective study. JACC Heart Fail. 2014;2(4):380-389
95. van Diepen S, Majumdar SR, Bakal JA, McAlister FA, Ezekowitz JA. Heart failure is a risk factor for orthopedic fracture: a population-based analysis of 16,294 patients. Circulation. 2008;118(19):1946-1952
96. Verheyen N, Fahrleitner-Pammer A, Belyavskiy E. et al. Relationship between bone turnover and left ventricular function in primary hyperparathyroidism: The EPATH trial. PLoS One. 2017;12(4):e0173799
97. Wiklund P, Nordstrom A, Jansson JH, Weinehall L, Nordstrom P. Low bone mineral density is associated with increased risk for myocardial infarction in men and women. Osteoporos Int. 2012;23(3):963-970
98. Szulc P. Association between cardiovascular diseases and osteoporosis-reappraisal. Bonekey Rep. 2012;1:144
99. Myint PK, Clark AB, Kwok CS. et al. Bone mineral density and incidence of stroke: European prospective investigation into cancer-norfolk population-based study, systematic review, and meta-analysis. Stroke. 2014;45(2):373-382
100. Fisher L, Srikusalanukul W, Fisher A, Smith P. Liver function parameters in hip fracture patients: relations to age, adipokines, comorbidities and outcomes. Int J Med Sci. 2015;12(2):100-115
101. Leavy B, Michaelsson K, Aberg AC, Melhus H, Byberg L. The Impact of Disease and Drugs on Hip Fracture Risk. Calcif Tissue Int. 2017;100(1):1-12
102. Veronese N, Stubbs B, Crepaldi G. et al. Relationship Between Low Bone Mineral Density and Fractures With Incident Cardiovascular Disease: A Systematic Review and Meta-Analysis. J Bone Miner Res. 2017;32(5):1126-1135
103. Jin ES, Jeong JH, Lee B, Im SB. Association factor analysis between osteoporosis with cerebral artery disease: The STROBE study. Medicine (Baltimore). 2017;96(9):e6164
104. Fohtung RB, Brown DL, Koh WJ. et al. Bone Mineral Density and Risk of Heart Failure in Older Adults: The Cardiovascular Health Study. J Am Heart Assoc. 2017;6(3):e004344
105. Valderrabano RJ, Lee J, Lui LY. et al. Older Men with Anemia Have Increased Fracture Risk Independent of Bone Mineral Density. J Clin Endocrinol Metab. 2017;102(7):2199-2206
106. Cesari M, Pahor M, Lauretani F. et al. Bone density and hemoglobin levels in older persons: results from the InCHIANTI study. Osteoporos Int. 2005;16(6):691-699
107. Laudisio A, Marzetti E, Pagano F, Bernabei R, Zuccala G. Haemoglobin levels are associated with bone mineral density in the elderly: a population-based study. Clin Rheumatol. 2009;28(2):145-151
108. Chen Z, Thomson CA, Aickin M. et al. The relationship between incidence of fractures and anemia in older multiethnic women. J Am Geriatr Soc. 2010;58(12):2337-2344
109. Korkmaz U, Korkmaz N, Yazici S. et al. Anemia as a risk factor for low bone mineral density in postmenopausal Turkish women. Eur J Intern Med. 2012;23(2):154-158
110. Looker AC. Hemoglobin and hip fracture risk in older non-Hispanic white adults. Osteoporos Int. 2014;25(10):2389-2398
111. Pan ML, Chen LR, Tsao HM, Chen KH. Iron Deficiency Anemia as a Risk Factor for Osteoporosis in Taiwan: A Nationwide Population-Based Study. Nutrients. 2017;9(6):E616
112. Afshinnia F, Pennathur S. Association of Hypoalbuminemia With Osteoporosis: Analysis of the National Health and Nutrition Examination Survey. J Clin Endocrinol Metab. 2016;101(6):2468-2474
113. Drevet S, Bioteau C, Maziere S. et al. Prevalence of protein-energy malnutrition in hospital patients over 75 years of age admitted for hip fracture. Orthop Traumatol Surg Res. 2014;100(6):669-674
114. Goisser S, Schrader E, Singler K. et al. Malnutrition According to Mini Nutritional Assessment Is Associated With Severe Functional Impairment in Geriatric Patients Before and up to 6 Months After Hip Fracture. J Am Med Dir Assoc. 2015;16(8):661-667
115. Curtis JR, Ewing SK, Bauer DC. et al. Association of intact parathyroid hormone levels with subsequent hip BMD loss: the Osteoporotic Fractures in Men (MrOS) Study. J Clin Endocrinol Metab. 2012;97(6):1937-1944
116. Portillo MR, Rodriguez-Ortiz ME. Secondary Hyperparthyroidism: Pathogenesis, Diagnosis, Preventive and Therapeutic Strategies. Rev Endocr Metab Disord. 2017;18(1):79-95
117. Alonso S, Ferrero E, Donat M. et al. The usefulness of high pre-operative levels of serum type I collagen bone markers for the prediction of changes in bone mineral density after parathyroidectomy. J Endocrinol Invest. 2012;35(7):640-644
118. Garnero P, Sornay-Rendu E, Munoz F, Borel O, Chapurlat RD. Association of serum sclerostin with bone mineral density, bone turnover, steroid and parathyroid hormones, and fracture risk in postmenopausal women: the OFELY study. Osteoporos Int. 2013;24(2):489-494
119. Drake MT, Khosla S. Hormonal and systemic regulation of sclerostin. Bone. 2017;96:8-17
120. Sambrook PN, Chen CJ, March L. et al. High bone turnover is an independent predictor of mortality in the frail elderly. J Bone Miner Res. 2006;21(4):549-555
121. Lerchbaum E, Schwetz V, Pilz S, Boehm BO, Marz W. Association of bone turnover markers with mortality in women referred to coronary angiography: the Ludwigshafen Risk and Cardiovascular Health (LURIC) study. Osteoporos Int. 2014;25(2):455-465
122. Lerchbaum E, Schwetz V, Pilz S. et al. Association of bone turnover markers with mortality in men referred to coronary angiography. Osteoporos Int. 2013;24(4):1321-1332
123. Gulin T, Kruljac I, Kirigin L. et al. Advanced Age, High beta-CTX Levels, and Impaired Renal Function are Independent Risk Factors for All-Cause One-Year Mortality in Hip Fracture Patients. Calcif Tissue Int. 2016;98(1):67-75
124. Kado DM, Browner WS, Blackwell T, Gore R, Cummings SR. Rate of bone loss is associated with mortality in older women: a prospective study. J Bone Miner Res. 2000;15(10):1974-1980
125. Sinnott B, Kukreja S, Barengolts E. Utility of screening tools for the prediction of low bone mass in African American men. Osteoporos Int. 2006;17(5):684-692
126. Qu X, Huang X, Jin F. et al. Bone mineral density and all-cause, cardiovascular and stroke mortality: a meta-analysis of prospective cohort studies. Int J Cardiol. 2013;166(2):385-393
127. Domiciano DS, Machado LG, Lopes JB. et al. Bone Mineral Density and Parathyroid Hormone as Independent Risk Factors for Mortality in Community-Dwelling Older Adults: A Population-Based Prospective Cohort Study in Brazil. The Sao Paulo Ageing & Health (SPAH) Study. J Bone Miner Res. 2016;31(6):1146-1157
128. Marques EA, Elbejjani M, Gudnason V. et al. Proximal Femur Volumetric Bone Mineral Density and Mortality: 13 Years of Follow-Up of the AGES-Reykjavik Study. J Bone Miner Res. 2017;32(6):1237-1242
129. Lind L, Carlstedt F, Rastad J. et al. Hypocalcemia and parathyroid hormone secretion in critically ill patients. Crit Care Med. 2000;28(1):93-99
130. Smith LM, Cuthbertson B, Harvie J. et al. Increased bone resorption in the critically ill: association with sepsis and increased nitric oxide production. Crit Care Med. 2002;30(4):837-840
131. Van den Berghe G, Van Roosbroeck D, Vanhove P. et al. Bone turnover in prolonged critical illness: effect of vitamin D. J Clin Endocrinol Metab. 2003;88(10):4623-4632
132. Gavala A, Makris K, Korompeli A, Myrianthefs P. Evaluation of Bone Metabolism in Critically Ill Patients Using CTx and PINP. Biomed Res Int. 2016;2016:1951707
133. Orford NR, Lane SE, Bailey M. et al. Changes in Bone Mineral Density in the Year after Critical Illness. Am J Respir Crit Care Med. 2016;193(7):736-744
134. Yeap BB, Alfonso H, Chubb SA. et al. Proportion of Undercarboxylated Osteocalcin and Serum P1NP Predict Incidence of Myocardial Infarction in Older Men. J Clin Endocrinol Metab. 2015;100(10):3934-3942
135. Garnero P. New developments in biological markers of bone metabolism in osteoporosis. Bone. 2014;66:46-55
Author contact
![]() Corresponding author: A/Prof Alexander Fisher, Dept of Geriatric Medicine, The Canberra Hospital, Canberra, PO Box 11, Woden, ACT, Australia 2606; Phone: +61-2-6244 3738; Fax: +61-2-6244 3395; E-mail: alex.fishergov.au
Corresponding author: A/Prof Alexander Fisher, Dept of Geriatric Medicine, The Canberra Hospital, Canberra, PO Box 11, Woden, ACT, Australia 2606; Phone: +61-2-6244 3738; Fax: +61-2-6244 3395; E-mail: alex.fishergov.au