Impact Factor ISSN: 1449-1907

 Global reach, higher impact
Int J Med Sci 2018; 15(2):176-187. doi:10.7150/ijms.22008 This issue Cite
Research Paper
An Amino Acids Mixture Attenuates Glycemic Impairment but not Affects Adiposity Development in Rats Fed with AGEs-containing Diet
Yi-Hung Liao1, Chung-Yu Chen2*, Chiao-Nan Chen3*, Chia-Ying Wu1, Shiow-Chwen Tsai4 ![]()
1. Department of Exercise and Health Science, National Taipei University of Nursing and Health Sciences, Taipei 11219, Taiwan;
2. Department of Exercise and Health Sciences, University of Taipei, Taipei 11153, Taiwan;
3. Department of Physical Therapy and Assistive Technology, School of Biomedical Science and Engineering, National Yang-Ming University, Taipei City 112, Taiwan;
4. Institute of Sports Sciences, University of Taipei, Taipei 11153, Taiwan.
* Chen, C.-Y. and Chen, C.-N. contributed equally to this work.
Received 2017-7-20; Accepted 2017-11-18; Published 2018-1-1
Abstract
Background: Unhealthy western dietary patterns lead to over-consumption of fat and advanced glycation end-products (AGEs), and these account for the developments of obesity, diabetes, and related metabolic disorders. Certain amino acids (AAs) have been recently demonstrated to improve glycemia and reduce adiposity. Therefore, our primary aims were to examine whether feeding an isoleucine-enriched AA mixture (4.5% AAs; Ile: 3.0%, Leu: 1.0%, Val: 0.2%, Arg: 0.3% in the drinking water) would affect adiposity development and prevent the impairments of glycemic control in rats fed with the fat/AGE-containing diet (FAD).
Methods: Twenty-four male Sprague-Dawley rats were assigned into 1) control diet (CD, N = 8), 2) FAD diet (FAD, N = 8), and 3) FAD diet plus AA (FAD/AA, N = 8). After 9-weeks intervention, the glycemic control capacity (glucose level, ITT, and HbA1c levels), body composition, and spontaneous locomotor activity (SLA) were evaluated, and the fasting blood samples were collected for analyzing metabolic related hormones (insulin, leptin, adiponectin, and corticosterone). The adipose tissues were also surgically collected and weighed.
Results: FAD rats showed significant increases in weight gain, body fat %, blood glucose, HbA1c, leptin, and area under the curve of glucose during insulin tolerance test (ITT-glucose-AUC) in compared with the CD rats. However, the fasting levels of blood glucose, HbA1c, leptin, and ITT-glucose-AUC did not differ between CD and FAD/AA rats. FAD/AA rats also showed a greater increase in serum testosterone.
Conclusion: The amino acid mixture consisting of Ile, Leu, Val, and Arg showed clear protective benefits on preventing the FAD-induced obesity and impaired glycemic control.
Keywords: Visceral fat, Locomotor activity, Insulin sensitivity, Leptin, Testosterone, HbA1c.
Introduction
Obesity and its related metabolic disorders, particularly type 2 diabetes, are highly prevalent worldwide. According to evidence from current epidemiological investigations, the global figure of people with diabetes will be projected to 366 million by 2030 (46% increase) [1, 2]. Recently, dietary factors and physical activity levels have been recognized to play critical roles in the pathogenesis of insulin resistance and diabetes [1, 2]. Western dietary pattern (e.g. high-fat food, fried/grilled food, etc.) has been recognized as one of the primary causes in the initiation and development of metabolic diseases [1, 3, 4]. Also, fried and grilled foods are very common in the western diet, but when foods cooked at dry and high temperature can lead to the production of the great amount of advanced glycation end-products (AGEs) [5, 6]. High-fat diet (40-60% of fat) [7] and high-AGEs diet (only 5-6% of fat) [8] are the most used research models for investigating the effects of unhealthy dietary patterns on the development metabolic disorders. However, unlike rodent, humans usually have cooked food, particularly for the foods with high fat/protein contents instead of raw food materials. Therefore, in this investigation, we used a dietary model containing both fat and AGEs to mimic the impact of unhealthy Western diets on the development of obesity and metabolic disorders.
Protein or certain amino acids have potential therapeutic effects on regulating glycemic control [9-15]. For example, branched-chain amino acids (BCAAs), especially leucine and isoleucine, have been reported to be involved in regulations of muscle protein synthesis (Leu) [16] and glycemic control (Leu and Ile) [9, 13-15]. It has been previously reported that an amino acid mixture, predominately consisting of BCAA, improves glucose tolerance in genetic Zucker fatty rats [17] and that these improvements are associated with an increase in skeletal muscle glucose uptake [18, 19]. More recently, increasing dietary leucine intake (1.5% Leu in water) has been reported to reduce food intake and improve glucose metabolism in mice with high-fat diet (HFD) [20]. Additionally, chronic supplementation of isoleucine (2-2.5% Ile in water) significantly reduces insulin response but not glucose level during oral glucose challenge [10] and prevents lipid accumulation in insulin-sensitive tissues [21] in diet-induced obese mice. On the other hand, L-arginine (1.5% Arg in water) supplementation has been shown to suppress fat gain and to improve the metabolic profile in Zucker diabetic fatty rats [22] and in diet-induced obese rats [23]. These results suggest that these amino acids probably have an insulin-sensitizing and weight-loss effects along with its acute hypoglycemic effects. However, it is still unclear whether chronic administration of a mixture of these glucose-lowering amino acids is capable of producing clear benefits on improving glycemic control and preventing from adiposity accumulation in rats fed with diet containing fat and AGEs.
With this in mind, we hypothesized that an addition of a novel mixture of hypoglycemic amino acids (Leu, Ile, valine, and Arg), can produce benefits on improving systemic glycemic control and weight loss in fat/AGEs-containing diet (FAD)-induced obese rats. Therefore, the purpose of the present investigation was to determine whether the provision of a novel amino acid mixture, containing leucine, isoleucine, valine, and arginine, would ameliorate the development of dietary-induced obesity and metabolic disorders in Sprague-Dawley rats fed with fat/AGEs-enriched diet.
Materials and Methods
Animal care and maintenance
Twenty-four male Sprague-Dawley rats (7 weeks old) were purchased from Lasco Biotechnology Company (Taipei City, Taiwan). Upon arrival, rats were then housed individually in a temperature and humidity controlled animal room with an artificial 12-12 hr dark/light cycle (temperature, 22-24 °C; relative humidity, 35-45%). In the first week of acclimation, all rats were provided standard laboratory chow (LabDiet® 5LL2; PMI Nutrition International, St Louis, MO, USA) and water ad libitum, and their diets were then changed to either standard chow or high-fat/high-AGE diet (FAD) in accordance with the experimental design. In prior to conducting experiment, all the animal care procedures were approved and followed the guidelines provided by the Institutional Animal Care and Use Committee (IACUC) at University of Taipei (IACUC approval number: UT104002).
Experimental design
After one week acclimation, rats were then randomly assigned to the following groups, including 1) placebo group (CD; n = 8; body weight: 296 ± 8 g), 2) high-fat/high-AGE diet plus placebo group (FAD; n = 8; body weight: 302 ± 11 g), 3) high-fat/high-AGE diet plus amino acids mixture group (FAD/AA; n = 8; body weight: 289 ± 11 g), and there was no statistical difference in body weight among three experimental groups. The rats were fed either normal standard control diet (CD: PRO 20%, CHO 70%, FAT 10%, total 3.85 kcal/g; D12450B, Research Diet, New Brunswick, NJ) or high-fat/high-AGE diet (FAD which was further prepared from high fat diet by our research team) supplemented with or without the novel amino acid mixture (AA mixture; totally 4.5% amino acids in distilled drinking water; non-AA mixture supplemented rats received distilled drinking water as placebo vehicle) according to the experimental design. The AA mixture solution consisted of isoleucine, leucine, valine, and arginine (Ile: 3.0%, Leu: 1.0%, Val: 0.2%, Arg: 0.3%; Sigma-Aldrich Corp., St. Louis, MO, USA), and this AA mixture supplement was prepared daily to ensure the fresh quality. The rationale of using this amino acid mixture was based on existing evidence in the literature. Isoleucine showed greater effects on promoting muscle glucose uptake compared to leucine [11], although both isoleucine and leucine have glucose-lowering effects [11]. Moreover, a previous study demonstrated that infusion of high-dose amino acid resulted in the development of insulin resistance in skeletal muscle tissue through over-activation of mammalian target of rapamycin (mTOR) pathway [24, 25]. Therefore, in order to avoid the possible adverse effects of exceeding amino acids intake, we decreased the total amino acid amount to a relatively lower level (4.5%) compared with previous studies using amino acid mixture. The daily intake of amino acids (mg amino acids/kg body weight/day) was calculated based on the daily water intake of the animals with amino acid mixture supplementation (FAD/AA group) at week 3, week 6, and week 9 (Table 1).
The calculated AA intake for the rats with amino acid mixture supplementation
| Amino Acid Mixture | Amount of Amino Acids Intake (mg/kg/day) | |||
|---|---|---|---|---|
| Dose (% in drink water) | 0 week | 3 week | 6 week | 9 week |
| Amino Acids (4.5% AA) | N/A | 3375 ± 425 | 2706 ± 249 | 2445 ± 276 |
| Isoleucine (Ile: 3.0%) | N/A | 2250 ± 283 | 1804 ± 166 | 1630 ± 184 |
| Leucine (Leu: 1.0%) | N/A | 750 ± 94 | 601 ± 55 | 543 ± 61 |
| Valine (Val: 0.2%) | N/A | 150 ± 19 | 120 ± 11 | 109 ± 12 |
| Arginine (Arg: 0.3%) | N/A | 225 ± 28 | 180 ± 17 | 163 ± 18 |
The calculated amount of amino acids intake (mg/kg/day) was calculated in accordance with the amount of daily water intake of the rats with amino acid mixture supplementation (FAD/AA group; n = 8). The amino acid mixture, consisting of Ile (3.0%), Leu (1.0%), Val (0.2%), and Arg (0.3%), was dissolved in the drinking water and provided to the animals ad labium, and the solution was prepared daily in fresh to ensure the supplement quality. N/A: Not applicable (No amino acid mixture was provided at the week 0). Values are expressed as Mean ± S.E.M.
Experimental procedure
After 8 weeks of dietary intervention, we used dual-energy X-ray absorptiometry (DEXA) method to determine body composition of animal, and the insulin tolerance test (ITT) was also performed to assess their systemic insulin sensitivity. At the end of 9-weeks treatment, the rats fasted for 12 hours, and an overnight fasted tail blood samples (0.5 ml) were collected. Thereafter, whole blood samples were collected in a tube containing 50 μl EDTA (24 mg/ml, pH 7.4) and used immediately for the measurement of blood glucose using a portable blood glucose analyzer (One Touch Ultra 2; LifeScan Inc., Milpitas, CA). The remaining blood was centrifuged at 3,000 × g for 10 min at 4 °C with an Eppendorf™ Model 5810 Centrifuge (Thermo Fisher Scientific Inc., Waltham, MA), and the plasma aliquoted and stored at -80 °C until assayed for later biochemical analyses. After fast blood sample collection, the rats were euthanized by an intraperitoneal injection of sodium pentobarbital (40 mg/kg), and the visceral adipose tissues (retroperitoneal and epididymis portions) were then surgically harvested and weighed using an electronic microscale balance.
Preparation for high-fat/AGE diet (FAD)
The standard commercialized high-fat diet (HFD: PRO 20%, CHO 35%, FAT 45%, total 4.73 kcal/g; D12451, Research Diet) was selected to prepare for the high-fat/AGE rodent diet (FAD) in this study. The high-fat/AGE rodent diet (FAD) was prepared according to the previous study by Feng et al. [8]. In brief, the high-fat rodent diet was exposed to the heat cycle (180 °C for 45 min) and fortified with supplement to offset heat-depleted micronutrients. Moreover, for the diet quality purpose, this FAD was prepared in a three-day interval and kept in the refrigerator at 4 °C before bringing out for feeding. The level of AGEs in rodent diet specimens (CD and FAD) was measured by quantitating content of AGEs in the rodent diet by using fluorospectrometry method [26]. In this study, the AGEs content in prepared high-fat/AGEs diet was approximate ~3.41-folds greater than that in control standard rodent diet (FAD: 5.59 ng/g protein vs. CD: 1.64 ng/g protein; FAD contained ~341% of AGEs above the level of CD).
Analyses of rat body composition and tissue weights
After 8 weeks of treatment, we measured rat body composition using dual-energy X-ray absorptiometry method (DEXA) as previous described [27, 28]. In brief, in prior to the DEXA measurement, the DEXA instrument (Lunar PIXImus, GE Lunar, Madison, WI, USA) was calibrated with a step bar with acrylic plastic and aluminum sections simulating soft tissue and bone according to manufacturer's operational guidelines, respectively. Thereafter, all rats were anesthetized by intraperitoneal injection of sodium pentobarbital (40 mg/kg), and they were then placed in a prone position on the rat platform in all DEXA scans. The vital signs of animals were continuously monitored by sight during DEXA scan, and then they were placed in cages with intensive monitoring vital signs until awoke. The scan results were analyzed using the software provided by the manufacturer, and the percent body fat and percent fat-free mass were recorded into a spreadsheet. When dietary intervention ended, the rats were euthanized by an intraperitoneal injection of sodium pentobarbital (40 mg/kg), and the intra-abdominal visceral adipose tissues (retroperitoneal and epididymis portions) were surgically removed and weighed using an electronic microscale balance.
Measurements of blood glucose and HbA1c
In the completion of 9-weeks dietary intervention, a fasting blood sample (0.5 ml) was collected in a test tube containing 40 μl of EDTA (24 mg/ml, pH 7.4) and then used for measurement of blood glucose and hemoglobin A1c (HbA1c). Blood glucose concentration was measured using a portable glucose analyzer with glucose dehydrogenase (GD)-based and glucose oxidase (GO)-based test strip (One Touch Ultra 2; LifeScan Inc., Milpitas, CA, USA). Blood HbA1c level was detected using an HbA1c biochemical analyzer with HbA1c immune-reaction test strip (Eclipse A1c Analyzer, ApexBio Inc., Taipei City, Taiwan). Additionally, the glucose analyzer and HbA1c analyzer were calibrated prior to each experiment according to the manufacturer's instructions.
Insulin tolerance test (ITT)
The insulin tolerance test was performed at three days before the completion of 9-week dietary intervention, and the protocol of the ITT was conducted as previously described [29]. For the ITT, after an overnight fasting (10 hrs), the rats were intraperitoneally injected with 0.75 U human insulin/kg body weight (regular Humulin, Eli Lilly, Indianapolis, IN, USA). Tail blood samples were collected before insulin injection (0 min) and after 30, and 60 min. Likewise, blood glucose concentration during ITT was measured using a portable glucose analyzer as described previously (One Touch Ultra 2; LifeScan Inc., Milpitas, CA, USA), and area under the curve (AUC) of blood glucose response during ITT was calculated using the trapezoidal rule.
Assessment of spontaneous locomotor activity level
The levels of spontaneous locomotor activity (SLA) of the animals were measured at the 8th week of treatment using the animal locomotor video-tracking analyzing system in accordance with a previous report [30]. In brief, we tested animal locomotor activity level during their dark cycle at 2100 hours due to the nocturnal behavior of rats. For the measurement of activity level, the rats were placed individually in the open-filed box made of black plastic (L: 50 cm; W: 50 cm; and H: 50 cm), and this measurement was performed in the isolated dark recording room without any external disturbances to ensure the accuracy. The SLA level of the rats within the 10-min stay were traced and analyzed using the LocoScan software (LocoScan, CleverSys Inc., VA, USA) in accordance with manufacturer's instructions.
Measurements for serum metabolic-related hormonal levels
At the end of intervention, the rat tail fasting blood samples were collected into test tubes and then centrifuged at 3000 × g for 10 minutes, and the supernatants were stored and used for the later hormonal analyses. The supernatant was used to measure for rat insulin (intra-assay CV% = 3.7%, Mercodia Ultra-sensitive Rat Insulin ELISA, Mercodia AB, Uppsal, Sweden), rat leptin (intra-assay CV% = 1.9%, BioVendor, Czech Republic), rat adiponectin (intra-assay CV% = 4.4%, AssayMaxTM, Assaypro LLC., St. Charles, MO, USA), rat corticosterone (intra-assay CV% = 7.4%, Immuno-Biological Laboratories Inc., IBL-America, Minneapolis, MN, USA), and testosterone (intra-assay CV% = 8.8%, Cayman Chemicals, Ann Arbor, MI, USA) by commercial available enzyme-linked immunosorbent assay (ELISA) kits according to the manufacturers' instructions. At the completion of each assay, the optical density and hormonal concentration of the samples were measured and calculated using an ELISA reader detection system (Tecan GENios Microplate Reader, Switzerland).
Statistical analyses
All data were presented as mean ± standard error of mean (Mean ± S.E.M.). Periodic growth rate was calculated in a 3-weeks interval to measure increment of body weight every 3 weeks. The data in this study were analyzed and graphed using SPSS 20.0 software (IBM SPSS statistics for Windows, New York, USA) and GraphPad Prism 5.0 (GraphPad software Inc., La Jolla, CA, USA), respectively. In prior to performing statistical analyses, we used Shapiro-Wilk normality test to analyze the normality of all variables. Two-way analysis of variance (ANOVA) with repeated measurement followed by last significant difference (LSD) post-hoc was used to compare the changes of body weight, food energy intake, and glucose response during ITT over time. One way ANOVA followed by LSD post-hoc was used to compare the differences in body compositions (fat-free mass, percent body fat, and visceral fat mass), biomarkers of glycemic control capacity (blood glucose, insulin, and HbA1c), and circulating hormonal concentrations (insulin, leptin, adiponectin, corticosterone, and testosterone) at the same time point among experimental groups. Pearson's correlation coefficient test was applied to assess the correlation among hormones. The alpha level was set at 0.05 (p <.05) for accepting statistical difference for all comparisons.
Results
Body weight
The results of body weight changes during our dietary intervention are shown in Fig 1. The body weight of animals was measured at baseline, week 3 (W3), week 6 (W6), and week 9 (W9) in a three-week interval (Fig. 1A). There was no difference in body weight at W0 among three experimental groups, whereas the overall trend of body weight of FAD rats was significantly greater than that of rats with CD treatment from week 3 to week 9 (p = 0.042). In compared with FAD, the amino acid mixture supplementation reduced the gain of body weight with an approached significant difference (p = 0.072) during 9-week intervention. However, the body weight of FAD/AA group showed no difference from CD group and was significantly lower than that of FAD group at W9. The FAD treatment led to the greatest growth rate during W0-W3 in compared with the other two groups, but this difference was absent in W3-W6 and W6-W9 (Fig. 1B).
Effects of FAD and FAD/AA on the changes in body weight, periodic growth rate, and basic metabolic demand from food during the 9-weeks dietary intervention. (A) The changes in body weight, (B) periodic growth rate calculated in a 3-weeks interval, and (C) basic metabolic demand from food presented in kcal/kg body weight/day were measured at baseline (week 0, acclimation week; W0), 3 weeks of dietary intervention (week 3; W3), 6 weeks of dietary intervention (week 6; W6), and 9 weeks of dietary intervention (week 9; W9). CD = control standard diet; FAD = fat/AGEs-containing diet; FAD/AA = fat/AGEs-containing diet plus AAs mixture. Values are expressed as Mean ± S.E.M. Means with different letters are statistically different from each other at individual time point (p < 0.05).
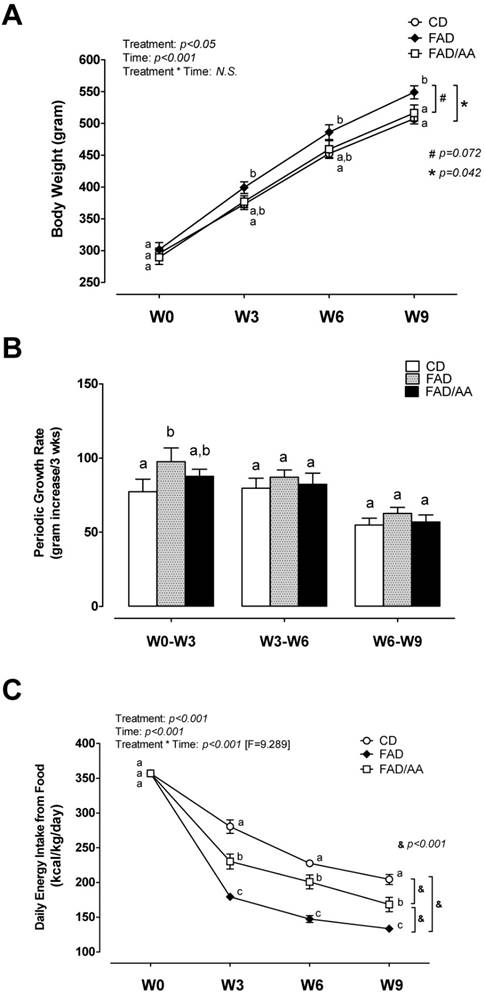
Basic energy intake from food and spontaneous locomotor activity
Fig. 1C displays the pattern of basic energy intake from food during the 9-weeks dietary treatment, and the basic energy intake from food is presented in kilocalories per kg body weight per day (kcal/kg/day). When the animals were fed with standard control diet during their acclamation week, there were no differences in the basic energy intake at W0 (baseline) among groups. The overall trend of daily energy intake was significantly different with each other among three groups (p < 0.001). The energy intake gradually decreased in all groups over time, but the rats fed with FAD showed the largest decline in this measurement from W3 to W9 in compared with those with CD and FAD/AA, although FAD/AA group still exhibited significantly lower basic energy intake from food than CD group.
Table 2 displays the spontaneous locomotor activity measured by LocoScan video recording system at the end of dietary intervention. The sedentary time (sec), non-moving time (sec), counts of upright standing (times), upright standing time (sec), moving distance (mm), and moving speed (mm/sec) within a certain time of period (60 min) were used as the indicators of animal physical activity. We found there were no statistical differences in all parameters of locomotor activity level assessment among three groups.
Spontaneous locomotor activity measured by LocoScan video recording system
| Measurements | CD | FAD | FAD/AA |
|---|---|---|---|
| Number | 8 | 8 | 8 |
| Sedentary time (sec) | 424.3 ± 0.9 | 414.8 ± 0.8 | 402.1 ± 1.3 |
| Non-moving time (sec) | 120.7 ± 1.1 | 125.9 ± 1.4 | 108.2 ± 1.1 |
| Standing count (times) | 44.5 ± 0.4 | 59.5 ± 1.0 | 81.2 ± 2.0 |
| Standing time (sec) | 10.4 ± 0.1 | 13.4 ± 0.1 | 21.2 ± 0.5 |
| Moving distance (mm) | 11173.9 ± 46.1 | 11751.3 ± 40.4 | 11664.8 ± 61.3 |
| Moving speed (mm/s) | 18.6 ± 0.1 | 19.8 ± 0.1 | 21.2 ± 0.1 |
CD = control standard diet; FAD = fat/AGEs-containing diet; FAD/AA = fat/AGEs-containing diet plus AAs mixture. At the end of 9 weeks of dietary intervention, the time of resting physical activity levels of animal were recorded by LocoScan video recording system with 10 min during their dark cycle at 2100 hours. Values are expressed as Mean ± S.E.M.
Body compositions
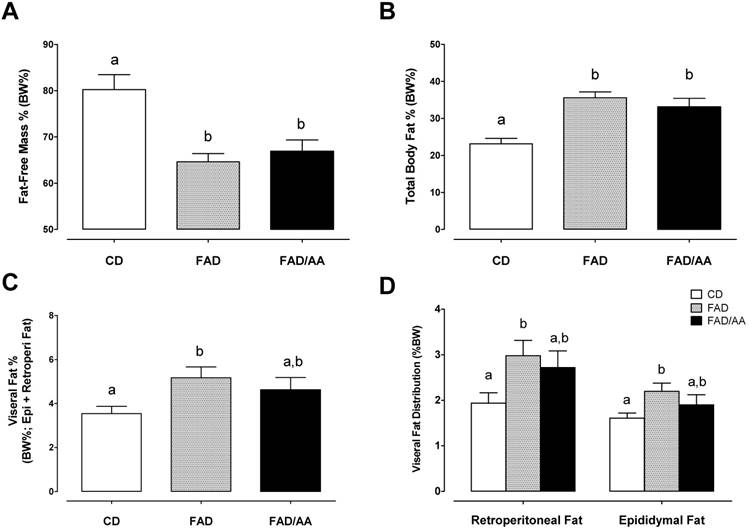
Figs 2A and 2B show the parameters of body composition measurements analyzed using DEXA, including percent fat-free mass (%fat-free mass) and percent total body fat (% body fat) after 9-weeks dietary intervention. The percentage of fat-free mass decreased significantly in the FAD and FAD/AA groups compared to the CD groups, and there were no differences between FAD and FAD/AA. Also, the FAD and FAD/AA groups significantly increased % body fat in compared with CD group. Figs 2C and 2D illustrate the percent visceral adipose tissue mass (overall) and differences in the distribution of these tissues (retroperitoneal fat pad or epididymal fat pad). The percent of visceral fat showed the trend of increase in rats fed with FAD, and the visceral fat % was not different between FAD and FAD/AA. However, there was no significant difference between FAD/AA and CD.
Effects of FAD and FAD/AA on the changes in body compositions including fat-free mass %, total body fat %, visceral fat %, and visceral fat distribution at the end of 9-weeks dietary intervention. (A) The changes in fat-free mass % measured by DEXA, (B) total body fat % measured by DEXA, (C) visceral fat % presented by the percentage of intra-abdominal visceral fat summing retroperitoneal, mesenteric, and epididymal fat, and (D) visceral fat distribution presented by the percentage of retroperitoneal fat and epididymal fat. CD = control standard diet; FAD = fat/AGEs-containing diet; FAD/AA = fat/AGEs-containing diet plus AAs mixture. Values are expressed as Mean ± S.E.M. Means with different letters are statistically different from each other (p < 0.05).
Whole-body glycemic control capacity and insulin tolerance
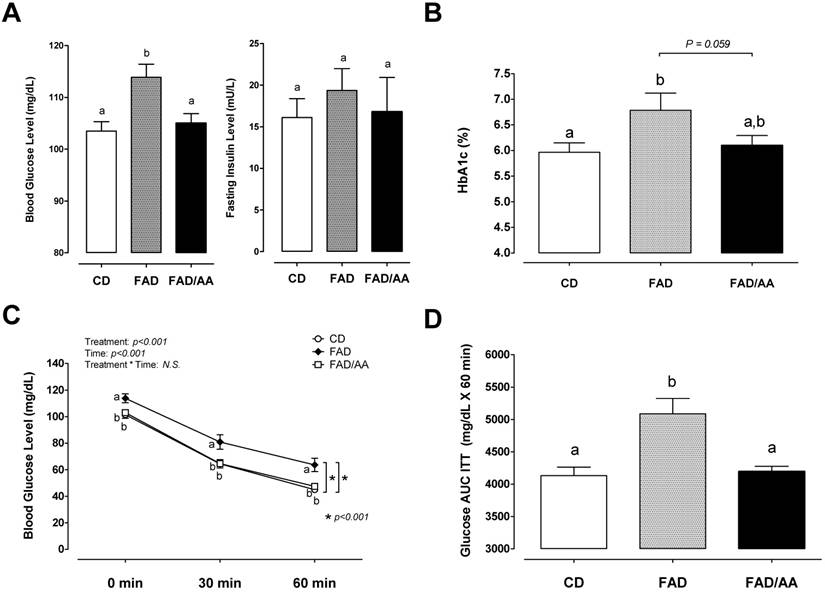
Fig. 3A displays the fasting levels of blood glucose and plasma insulin after 9 weeks of dietary intervention. In compared with the CD group, the fasting blood glucose was significantly higher in the FAD group (p = 0.0025) but not in the FAD/AA group, and FAD/AA also showed lower blood glucose level than FAD group (p = 0.007). There were no statistical differences in fasting insulin concentration among these groups. The high-fat/AGEs diet significantly increased blood HbA1c concentration by 13.7% (p = 0.033) above the level of those with standard diet, but the AA mixture attenuated the FAD-induced increase in HbA1c to an approached significance (-10.1% below FAD; p = 0.059; Fig. 3B). The ITT and the area under blood glucose response curve (ITT-glucose AUC) during ITT are shown in Figs 3C and 3D. In compared with the CD group, the blood glucose level during the ITT was significantly higher in the FAD group, and the FAD group also exhibited a significantly higher ITT-glucose AUC than the CD group (+23.1% above CD; p = 0.002). The results in ITT and ITT-glucose AUC showed no differences between CD and FAD/AA groups.
Effects of FAD and FAD/AA on whole-body glycemic control capacity and insulin tolerance at the end of 9-weeks dietary intervention. (A) The fasting blood glucose and serum insulin concentrations, (B) the fasting blood HbA1c concentration, (C) the blood glucose concentrations during insulin tolerance test (ITT), and (D) the area under curve of blood glucose concentrations during ITT (glucose AUC ITT). CD = control standard diet; FAD = fat/AGEs-containing diet; FAD/AA = fat/AGEs-containing diet plus AAs mixture. Values are expressed as Mean ± S.E.M. Means with different letters are statistically different from each other (p < 0.05).
Serum levels of adipokines, testosterone, and corticosterone
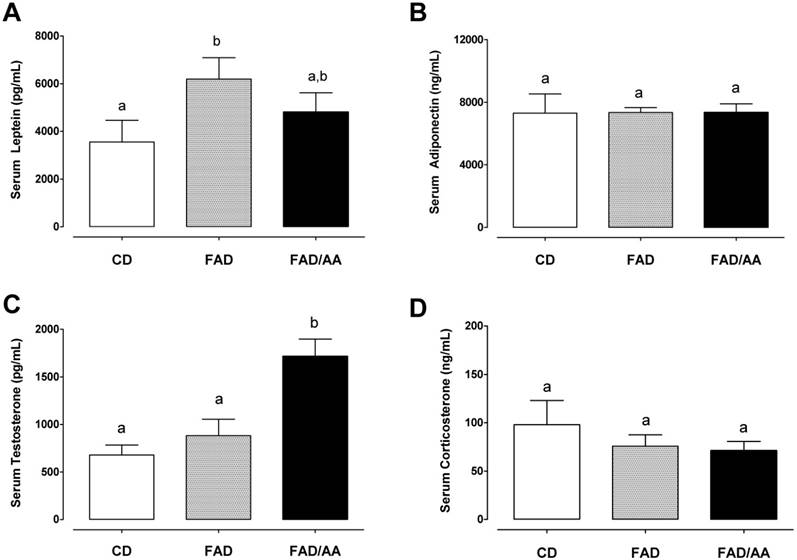
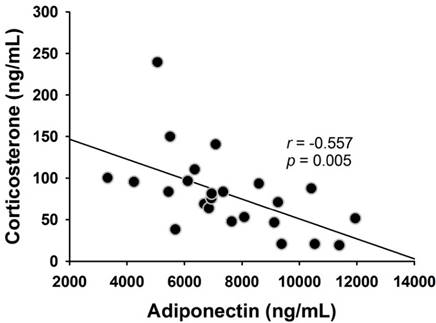
Fig. 4 shows the fasting levels of circulating hormones, including leptin (4A), adiponectin (4B), testosterone (4C), and corticosterone (4D), after 9 weeks of dietary intervention. We observed that the serum leptin level of FAD (6195 ± 898 pg/mL) and FAD/AA (4807 ± 810 pg/mL) increased by 74.4% (p = 0.029) and 35.3% (non-significance) above the level of rats with CD (3552 ± 914 ng/ml), respectively. There were no significant differences in fasting serum adiponectin concentration among three groups at the end of treatment (Fig. 4B). Fig. 4C displays the serum testosterone level at the end of intervention, and the rats fed with FAD plus AA mixture exhibited a statistically higher testosterone level (1717 ± 180 pg/ml; +152% above CD, p < 0.001; +94% above FAD, p = 0.002) in compared with the CD (679 ± 104 pg/ml) and FAD (883 ± 173 pg/ml) groups. The serum corticosterone level is showed in Fig. 4D, and there were no significant differences in this hormone among three groups at the end of treatment. Among the four hormones, only between adiponectin and corticosterone has shown negative correlation significantly (r = -0.557, p=0.005) (Fig. 5).
Effects of FAD and FAD/AA on the fasting serum levels of leptin, adiponectin, testosterone, and corticosterone at the end of 9-weeks dietary intervention. (A) The fasting serum level of leptin, (B) the fasting serum level of adiponectin, (C) the fasting serum level of testosterone, and (D) the fasting serum level of corticosterone were measured at the end of 9-weeks dietary intervention. CD = control standard diet; FAD = fat/AGEs-containing diet; FAD/AA = fat/AGEs-containing diet plus AAs mixture. Values are expressed as Mean ± S.E.M. Means with different letters are statistically different from each other (p < 0.05).
The correlation between serum adiponectin and corticosterone. Serum adiponectin level was negatively correlated with the serum corticosterone level (r = -0.557, p = 0.005).
Discussion
The present study was aimed to examine the effectiveness of an Ile-enriched amino acids mixture, consisting of Leu, Ile, Val, and Arg (4.5% AAs in drinking water), on FAD-induced weight gain and metabolic impairments in rats. In the diet preparation, the content of advanced glycation end-product (AGEs) in FAD increased by +310% above the level in the regular control diet (CD). The primary findings of this study were 1) the AA mixture suppressed the body weight gain but not attenuated visceral fat accumulation in rats fed with FAD, 2) the AA mixture suppressed FAD-induced increase in blood glucose, HbA1c, and impaired insulin sensitivity, and 3) administration of AA mixture decreased serum leptin and stimulated testosterone secretion in the rats fed with FAD. Our present findings, therefore, provide an evidence that this AA mixture was capable of ameliorating FAD-induced insulin resistance development and impaired glycemic control but had no effect on accumulated adiposity in Sprague Dawley rats.
Inadequate physical activity levels is one of the primary factors for the development of obesity [31], whereas it is still little known whether chronic amino acids supplementation would influence locomotor activity. Tsuneyoshi et al. (2007) reported that BCAA dipeptides administration promoted hyperactivity in chicks, suggesting the ability of BCAA dipeptides to stimulate activity in poultry [32]. However, chronic supplementation of Leu and Arg both have no effects on altering spontaneous locomotor activity (SLA) in mice [33, 34], while Arg ingestion increased energy expenditure [34]. Although several studies had investigated the effects of certain amino acids on locomotor activity [32-34], yet the benefits are still inconclusive in the literature. To our knowledge, this study is the first study investigating the effects of chronic AA mixture supplementation on SLA in rats fed with FAD. Here we measured SLA using a video recording motion analyzing system and revealed that there were no differences in all parameters of locomotor activity among three groups (Table 2). Thus this finding ruled out the effect of the AA mixture on increasing energy expenditure through eliciting SLA.
On the other hand, we found that rats in the FAD group consumed 35-36% less of energy from food than the control group. Our results implied that the FAD-induced obesity development could not be fully explained by excess dietary energy intake, and this raised the possibility that FAD might reduce metabolic rate and thereby facilitate lipid accumulation in adipose tissue. Of interest, the AA mixture supplementation substantially attenuated the decline in energy intake from food (only 12-18% decreases; Fig. 1D) in rats fed with FAD. Previous evidence has revealed that Leu can alter the energy balance toward decreasing adiposity in rodents fed a high-fat diet [35, 36], implying the potential of AA mixture on reducing diet-induced obesity. However, we did not detect the differences of percent body and visceral fat between FAD and FAD/AA groups, even though the rats fed FAD plus AA mixture showed a trend toward lower body weight and less body fat % than those fed FAD alone (Fig. 1A and Fig. 2). The addition of AGEs into diet possibly lead to the discrepant effects of AA supplementation on adiposity development between ours and previous findings, but this aspect still warrants further investigation to be clarified in future studies.
In this study, the FAD-induced obesity was accompanied with significantly increased blood glucose and HbA1c levels, and impaired insulin sensitivity (indicated by relatively higher glucose AUC during ITT; Fig. 3D). However, there is a lack of evidence for the effectiveness of chronic administration of these amino acids on whole-body glycemic control capacity in unhealthy Western dietary pattern model. The Ile-predominant amino acid mixture has been developed based on several previous studies revealing that isoleucine exhibits a clear potency on reducing adiposity [21] and maintaining whole-body glycemic control through promoting skeletal muscle glucose uptake and inhibiting hepatic glucose output [17-19, 37-38]. An interesting observation from the present work is that the relatively lower level of AA mixture not only decreased fasting blood glucose level in FAD/AA rats but reduced blood HbA1c level to an approached significant state compared with rats fed with FAD alone (-10.1% below FAD; p = 0.059; Fig. 3B). These findings reveal that the AA mixture is capable of better maintaining blood glucose homeostasis in animals experiencing a dietary challenge with high contents of fat and AGEs.
At present, little is known about the mechanisms underlying the effectiveness of the AA mixture on lowering blood glucose and improving insulin sensitivity in FAD-fed rats. The underlying mechanisms for the benefits of an AA mixture are possibly mediated through the hypoglycemic effects of Leu and Ile, because Leu and Ile have both been shown to stimulate muscle glucose uptake via phosphatidylinositol 3-kinase (PI3-kinase) and atypical protein kinase C (aPKC) pathways independently of the mammalian target of TOR (mTOR) [14, 15]. Meanwhile, Leu and Val, but not Ile, had been found to increase muscle glycogen content under insulin free conditions [14]. Furthermore, chronic Arg treatment possibly enhanced nitric oxide (NO) synthesis and contributed to the subsequent improvements in metabolic profiles (i.e. ↓ blood glucose, ↓ serum leptin, ↓ blood dyslipidemia, etc.) in genetic- and diet-induced fatty rats [22, 23]. Taken together, these glucose-lowering effects of the AA mixture might result from both enhanced insulin sensitivity and glycogen synthetic capacity in skeletal muscle tissue, yet the molecular mechanisms for this benefit are warranted for future investigations.
A novel and exciting finding of the present study is that the AA mixture supplementation markedly increased circulating testosterone concentration in the rats fed with FAD (Fig. 4C). Chronic administration of L-Arg (15 mg/100 g body wt. for 8 wks) has been reported to increase serum testosterone production in Sprague Dawley rats [39]. In line with our findings, these results suggest the stimulatory effect of Arg on promoting the secretion of testosterone in vivo in male rats. In human, short-term AA supplementation (3.3 g of BCAAs) had also been shown to increase serum testosterone levels after intensified resistance exercise training [40]. Further, an exogenous source of amino acid helped attenuate a drop in testosterone after acute exercise [41] and long-term training [42]. Among BCAAs, Leu, but not Ile and Val, appears to have a role in the stimulation of testosterone production, because chronic Leu supplementation (50 mg/kg/day) had been shown to elevate testosterone level by ~20% during exercise training in male power athletes [43]. Nevertheless, we observed that the AA-induced testosterone secretion did not affected SLA in rats fed with FAD, although the daily locomotor activity level has been previously reported to be associated with circulating testosterone levels in the hamster [44].
Furthermore, hypogonadal states in men accompanied with insulin resistance could be improved by testosterone replacement therapy [45]. Previous evidence also reveals that low serum testosterone levels are associated with an adverse metabolic profile [46] and the testosterone treatment has positive benefits on glycemic control in middle-aged obese men [47]. Likewise, apart from an increase in serum testosterone, we also observed clear effects of amino acids mixture on decreasing serum leptin and enhancing metabolic profile (i.e. ↓ fasting blood glucose, ↓ HbA1c, and ↑ insulin sensitivity) in FAD-fed rats. Leptin is released from adipose tissue and is a pro-inflammatory adipokine that associates with insulin resistance development [48], and testosterone replacement therapy was also reported to decrease serum leptin levels and reverse insulin resistant state in hypogonadal men [43]. Altogether, the increased serum testosterone after chronic AA mixture administration might be regulated by the testicular steroidogenic effects of L-Arg and the unidentified effects of Leu. Moreover, the inducible effect on testosterone secretion possibly accounts for a decline in serum leptin and alleviations of poor glycemic control and insulin resistance in animals experiencing FAD challenge. Expression of adiponectin is reduced in obese mice and restored by adrenalectomy [49]. Our result also showed the negative correlation between serum corticosterone and adiponectin (Fig. 5).
In summary, we demonstrated that a fat/AGE-containing diet (FAD) remarkedly increased body weight gain, induced visceral adiposity, impaired glycemic control, and raised serum leptin level. The Ile-enriched AA mixture, consisting of Ile, Leu, Val, and Arg, attenuated the rate of weight gain but not affected body fat accumulation in FAD-fed rats. Additionally, the fasting blood glucose and insulin sensitivity were comparable between the rats fed control diet and FAD plus AA mixture. However, the AA mixture did not affect spontaneous locomotor activity in FAD-fed rats. Moreover, the amino acid mixture also increased circulating testosterone level in rats fed with FAD. These findings thus suggest that the novel amino acid mixture, consisting of Leu, Ile, Val, and Arg, exhibits clear protective benefits on preventing FAD-induced in glycemic impairments.
Acknowledgements
We would like to thank Ming-Fen Hsu, Yan-Ting Yang, Wei-Hsiang Liang, and Shao-Po Chiu for their assistance in this project. This work was supported by the Ministry of Science and Technology, Taiwan Grant number MOST-104-2410-H-227-003- (Liao, Y.H.) and partially supported by Grant number MOST-102-2410-H-845-014-MY3 and University of Taipei (Tsai, S.C.).
Author Contributions
Conceived and designed the experiments: LYH, TSC, and CCY. Performed the experiments: CCN, and WCY. Analyzed the data: LYH, TSC, CCN, and WCY. Contributed reagents/materials/analysis tools: LYH, TSC, CCN, and CCY. Wrote the paper: LYH, TSC, CCY, and CCN.
Competing Interests
The authors have declared that no competing interest exists.
References
1. Zimmet P, Alberti K, Shaw J. Global and societal implications of the diabetes epidemic. Nature. 2001;414:782-7
2. Wild S, Roglic G, Green A, Sicree R, King H. Global Prevalence of Diabetes: Estimates for the year 2000 and projections for 2030. Diabetes Care. 2004;27:1047-53
3. Atalay M, Laaksonen DE. Diabetes, oxidative stress and physical exercise. J Sports Sci Med. 2002;1:1-14
4. Shoelson SE, Lee J, Goldfine AB. Inflammation and insulin resistance. J Clin Invest. 2006;116:1793-801
5. Ramamurthy B, Larsson L. Detection of an aging-related increase in advanced glycation end products in fast- and slow-twitch skeletal muscles in the rat. Biogerontology. 2013;14:293-301
6. Cassese A, Esposito I, Fiory F, Barbagallo APM, Paturzo F, Mirra P. et al. In skeletal muscle advanced glycation end products (AGEs) inhibit insulin action and induce the formation of multimolecular complexes including the receptor for AGEs. J Biol Chem. 2008;283:36088-99
7. Buettner R, Schölmerich J, Bollheimer LC. High-fat diets: modeling the Metabolic disorders of human obesity in rodents. Obesity. 2007;15:798-808
8. Feng JX, Hou FF, Liang M, Wang GB, Zhang X, Li HY. et al. Restricted intake of dietary advanced glycation end products retards renal progression in the remnant kidney model. Kidney Int. 2007
9. Morifuji M, Koga J, Kawanaka K, Higuchi M. Branched-chain amino acid-containing dipeptides, identified from whey protein hydrolysates, stimulate glucose uptake rate in L6 myotubes and isolated skeletal muscles. J Nutr Sci Vitaminol (Tokyo). 2009;55:81-6
10. Ikehara O, Kawasaki N, Maezono K, Komatsu M, Konishi A. Acute and chronic treatment of L-isoleucine ameliorates glucose metabolism in glucose-intolerant and diabetic mice. Biol Pharm Bull. 2008;31:469-72
11. Doi M, Yamaoka I, Nakayama M, Sugahara K, Yoshizawa F. Hypoglycemic effect of isoleucine involves increased muscle glucose uptake and whole body glucose oxidation and decreased hepatic gluconeogenesis. Am J Physiol Endocrinol Metab. 2007;292(E):1683-93
12. Nishitani S, Takehana K, Fujitani S, Sonaka I. Branched-chain amino acids improve glucose metabolism in rats with liver cirrhosis. Am J Physiol Gastrointest Liver Physiol. 2005;288(G):1292-300
13. Doi M, Yamaoka I, Nakayama M, Mochizuki S, Sugahara K, Yoshizawa F. Isoleucine, a blood glucose-lowering amino acid, increases glucose uptake in rat skeletal muscle in the absence of increases in AMP-activated protein kinase activity. J Nutr. 2005;135:2103-8
14. Doi M, Yamaoka I, Fukunaga T, Nakayama M. Isoleucine, a potent plasma glucose-lowering amino acid, stimulates glucose uptake in C2C12 myotubes. Biochem Biophys Res Commun. 2003;312:1111-7
15. Nishitani S, Matsumura T, Fujitani S, Sonaka I, Miura Y, Yagasaki K. Leucine promotes glucose uptake in skeletal muscles of rats. Biochem Biophys Res Commun. 2002;299:693-6
16. Anthony JC, Yoshizawa F, Anthony TG, Vary TC, Jefferson LS, Kimball SR. Leucine stimulates translation initiation in skeletal muscle of postabsorptive rats via a rapamycin-sensitive pathway. J Nutr. 2000;130:2413-9
17. Bernard J, Liao Y-H, Ding Z, Hara D, Kleinert M, Nelson J. et al. An amino acid mixture improves glucose tolerance and lowers insulin resistance in the obese Zucker rat. Amino Acids. 2013;45:191-203
18. Bernard JR, Liao Y-H, Doerner PG, Ding Z, Hsieh M, Wang W. et al. An amino acid mixture is essential to optimize insulin-stimulated glucose uptake and GLUT4 translocation in perfused rodent hindlimb muscle. J Appl Physiol. 2012;113:97-104
19. Bernard JR, Liao Y-H, Hara D, Ding Z, Chen C-Y, Nelson JL. et al. An amino acid mixture improves glucose tolerance and insulin signaling in Sprague-Dawley rats. Am J Physiol - Endocrinol Metab. 2011;300(E):752-60
20. Zhang Y, Guo K, LeBlanc RE, Loh D, Schwartz GJ, Yu Y-H. Increasing dietary leucine intake reduces diet-induced obesity and improves glucose and cholesterol metabolism in mice via multimechanisms. Diabetes. 2007;56:1647-54
21. Nishimura J, Masaki T, Arakawa M, Seike M, Yoshimatsu H. Isoleucine prevents the accumulation of tissue triglycerides and upregulates the expression of PPARalpha and uncoupling protein in diet-induced obese mice. J Nutr. 2010;140:496-500
22. Fu WJ, Haynes TE, Kohli R, Hu J, Shi W, Spencer TE. et al. Dietary L-arginine supplementation reduces fat mass in Zucker diabetic fatty rats. J Nutr. 2005;135:714-21
23. Jobgen W, Meininger CJ, Jobgen SC, Li P, Lee MJ, Smith SB. et al. Dietary L-arginine supplementation reduces white fat gain and enhances skeletal muscle and brown fat masses in diet-induced obese rats. J Nutr. 2009;139:230-7
24. Tremblay F, Krebs M, Dombrowski L, Brehm A, Bernroider E, Roth E. et al. Overactivation of S6 kinase 1 as a cause of human insulin resistance during increased amino acid availability. Diabetes. 2005;54:2674-84
25. Um SH, D'Alessio D, Thomas G. Nutrient overload, insulin resistance, and ribosomal protein S6 kinase 1, S6K1. Cell Metab. 2006;3:393-402
26. Hou FF, Boyce J, Chertow GM, Kay J, Owen WF Jr. Aminoguanidine inhibits advanced glycation end products formation on beta2-microglobulin. J Am Soc Nephrol. 1998;9:277-83
27. Rose BS, Flatt WP, Martin RJ, Lewis RD. Whole body composition of rats determined by dual energy X-ray absorptiometry is correlated with chemical analysis. J Nutr. 1998;128:246-50
28. Feely RS, Larkin LM, Halter JB, Dengel DR. Chemical versus dual energy x-ray absorptiometry for detecting age-associated body compositional changes in male rats. Exp Gerontol. 2000;35:417-27
29. Satoh H, Nguyen MT, Miles PD, Imamura T, Usui I, Olefsky JM. Adenovirus-mediated chronic "hyper-resistinemia" leads to in vivo insulin resistance in normal rats. J Clin Invest. 2004;114:224-31
30. Hsieh CP, Chang WT, Lee YC, Huang AM. Deficits in cerebellar granule cell development and social interactions in CD47 knockout mice. Dev Neurobiol. 2015;75:463-84
31. Hill JO, Melanson EL. Overview of the determinants of overweight and obesity: current evidence and research issues. Med Sci Sports Exerc. 1999;31(s):515-21
32. Tsuneyoshi Y, Tomonaga S, Asechi M, Morishita K, Denbow DM, Furuse M. Central administration of dipeptides, beta-alanyl-BCAAs, induces hyperactivity in chicks. BMC Neurosci. 2007;8:37-42
33. Nairizi A, She P, Vary TC, Lynch CJ. Leucine supplementation of drinking water does not alter susceptibility to diet-induced obesity in mice. J Nutr. 2009;139:715-9
34. Clemmensen C, Madsen AN, Smajilovic S, Holst B, Brauner-Osborne H. L-Arginine improves multiple physiological parameters in mice exposed to diet-induced metabolic disturbances. Amino Acids. 2012;43:1265-75
35. Zhang Y, Guo K, LeBlanc RE, Loh D, Schwartz GJ, Yu YH. Increasing dietary leucine intake reduces diet-induced obesity and improves glucose and cholesterol metabolism in mice via multimechanisms. Diabetes. 2007;56:1647-54
36. Layman DK, Walker DA. Potential importance of leucine in treatment of obesity and the metabolic syndrome. J Nutr. 2006;136(s):319-23
37. Kleinert M, Liao YH Nelson JL, Bernard JR Wang W, Ivy JL. An amino acid mixture enhances insulin-stimulated glucose uptake in isolated rat epitrochlearis muscle. J Appl Physiol. 2011;111:163-9
38. Wang B, Kammer LM, Ding Z, Lassiter DG, Hwang J, Nelson JL. et al. Amino acid mixture acutely improves the glucose tolerance of healthy overweight adults. Nutr Res. 2012;32:30-8
39. Duru FIO, Olalekan OO, Azu OO, Okoko II. L-arginine augments oxidative stress in cryptorchid testes of adult Sprague-Dawley rats. JMMS. 2011;2:777-82
40. Sharp CP, Pearson DR. Amino acid supplements and recovery from high-intensity resistance training. J Strength Cond Res. 2010;24:1125-30
41. Carli G, Bonifazi M, Lodi L, Lupo C, Martelli G, Viti A. Changes in the exercise-induced hormone response to branched chain amino acid administration. Eur J Appl Physiol Occup Physiol. 1992;64:272-7
42. Kraemer WJ, Ratamess NA, Volek JS, Hakkinen K, Rubin MR, French DN. et al. The effects of amino acid supplementation on hormonal responses to resistance training overreaching. Metabolism. 2006;55:282-91
43. Mero A, Pitkanen H, Oja SS, Komi PV, Pontinen P, Takala T. Leucine supplementation and serum amino acids, testosterone, cortisol and growth hormone in male power athletes during training. J Sports Med Phys Fitness. 1997;37:137-45
44. Ellis GB, Turek FW. Testosterone and photoperiod interact to regulate locomotor activity in male hamsters. Horm Behav. 1983;17:66-75
45. Simon D, Charles MA, Lahlou N, Nahoul K, Oppert JM, Gouault-Heilmann M. et al. Androgen therapy improves insulin sensitivity and decreases leptin level in healthy adult men with low plasma total testosterone: a 3-month randomized placebo-controlled trial. Diabetes Care. 2001;24:2149-51
46. Pitteloud N, Mootha VK, Dwyer AA, Hardin M, Lee H, Eriksson KF. et al. Relationship between testosterone levels, insulin sensitivity, and mitochondrial function in men. Diabetes Care. 2005;28:1636-42
47. Marin P, Holmang S, Jonsson L, Sjostrom L, Kvist H, Holm G. et al. The effects of testosterone treatment on body composition and metabolism in middle-aged obese men. Int J Obes Relat Metab Disord. 1992;16:991-7
48. Otero M, Lago R, Gomez R, Lago F, Gomez-Reino JJ, Gualillo O. Leptin: a metabolic hormone that functions like a proinflammatory adipokine. Drug News Perspect. 2006;19:21-6
49. Makimura H, Mizuno T, Bergen H, Mobbs CV. Adiponectin is stimulated by adrenalectomy in ob/ob mice and is highly correlated with resistin mRNA. Am J Physiol Metab. 2002;283(E):1266-71
Author contact
![]() Corresponding author: Shiow-Chwen Tsai, Ph.D., Institute of Sports Sciences, University of Taipei, No.101, Sec. 2, Zhongcheng Rd., Shilin District, Taipei City 11153, Taiwan E-mail: sctsai6com Phone: +886-2-28718288 ext. 5813 Fax: +886-2-2875-1116
Corresponding author: Shiow-Chwen Tsai, Ph.D., Institute of Sports Sciences, University of Taipei, No.101, Sec. 2, Zhongcheng Rd., Shilin District, Taipei City 11153, Taiwan E-mail: sctsai6com Phone: +886-2-28718288 ext. 5813 Fax: +886-2-2875-1116