International Journal of Medical Sciences
ISSN: 1449-1907
3.2
Impact Factor
ISSN: 1449-1907
- Current Issue
- Volume 22; 2025
- Volume 21; 2024
- Volume 20; 2023
- Volume 19; 2022
- Volume 18; 2021
- Archive
- Editorial Board
- Cover Images
- Index & Coverage
- Cover Suggestion
- Special Issues
Top
Introduction
Materials and Methods
Results
Discussion
Supplementary Material
Acknowledgements
References
Introduction
Materials and Methods
Results
Discussion
Supplementary Material
Acknowledgements
References

 Global reach, higher impact
Int J Med Sci 2017; 14(11):1054-1064. doi:10.7150/ijms.20286 This issue Cite
Research Paper
Gender-Specific Associations between Low Skeletal Muscle Mass and Albuminuria in the Middle-Aged and Elderly Population
Hye Eun Yoon1, 2, Yunju Nam1, 2, Eunjin Kang1, 2, Hyeon Seok Hwang1, 3, Seok Joon Shin1, 2, Yeon Sik Hong2, 4, Kwi Young Kang 2, 4 ![]()
1. Division of Nephrology, Department of Internal Medicine, College of Medicine, The Catholic University of Korea;
2. Department of Internal Medicine, Incheon St. Mary's Hospital;
3. Department of Internal Medicine, Daejeon St. Mary's Hospital;
4. Division of Rheumatology, Department of Internal Medicine, College of Medicine, The Catholic University of Korea.
Received 2017-3-27; Accepted 2017-7-24; Published 2017-9-3
Citation:
Yoon HE, Nam Y, Kang E, Hwang HS, Shin SJ, Hong YS, Kang KY. Gender-Specific Associations between Low Skeletal Muscle Mass and Albuminuria in the Middle-Aged and Elderly Population. Int J Med Sci 2017; 14(11):1054-1064. doi:10.7150/ijms.20286. https://www.medsci.org/v14p1054.htm
Other stylesAbstract
Objective This study assessed gender-specific associations between low muscle mass (LMM) and albuminuria.
Methods Data from the Korea National Health and Nutrition Examination Survey 2011 were employed. The study consisted of 1,087 subjects (≥50 years old). Skeletal muscle index (SMI) was defined as the weight-adjusted appendicular skeletal muscle mass. Mild LMM and severe LMM were defined as SMI that were 1-2 and >2 standard deviations below the sex-specific mean appendicular skeletal muscle mass of young adults, respectively. Increased albuminuria was defined as albumin-to-creatinine ratio ≥30mg/g
Results Men with mild and severe LMM were significantly more likely to have increased albuminuria (15.2% and 45.45%, respectively) than men with normal SMI (9.86%, P<0.0001), but not women. Severe LMM associated independently with increased albuminuria in men (OR=7.661, 95% CI=2.72-21.579) but not women. Severe LMM was an independent predictor of increased albuminuria in hypertensive males (OR=11.449, 95% CI=3.037-43.156), non-diabetic males (OR=8.782, 95% CI=3.046-25.322), and males without metabolic syndrome (MetS) (OR=8.183, 95% CI=1.539-43.156). This was not observed in males without hypertension, males with diabetes or MetS, and all female subgroups.
Conclusion Severe LMM associated with increased albuminuria in men, especially those with hypertension and without diabetes or MetS.
Keywords: Low skeletal muscle mass, Albuminuria, Hypertension, Male.
Introduction
Sarcopaenia is characterised by the progressive loss of muscle mass with aging and associates with physical disability, metabolic impairment, and increased mortality [1, 2]. Moreover, several studies have shown that in the general population, sarcopaenia associates with arterial stiffness [3], a higher Framingham risk score [4], and high pulse pressure [5]. In addition, a recent report showed that a measure of sarcopaenia was predictive of future adverse events in patients with heart failure [6]. These findings suggest that sarcopenia associates with cardiovascular disease (CVD).
Albuminuria is a well-known risk factor for not only chronic kidney disease but also CVD. For example, it associates with increased cardiovascular and all-cause mortality in both the general population and in patients with diabetes or hypertension [7-9]. Notably, in the general population, microalbuminuria is more common in men than in women [10, 11]. Moreover, in patients with an increased risk of chronic kidney disease (such as those with diabetes or hypertension), albuminuria correlates more strongly with cardiovascular morbidity [12] and mortality [13] in males than in females. Similarly, experimental studies show that male mice are more predisposed to hypertension-related renal damage than females: this effect is independent of blood pressure [14]. Altogether, these data suggest that males are more predisposed to CVD and renal disease and that there is a gender difference in the association between cardiovascular risk factors and albuminuria.
In this cross-sectional study, we investigated the association between albuminuria and low skeletal muscle mass in a representative sample of the Korean population. We hypothesized that there would be a gender-specific association between low skeletal muscle mass and albuminuria and then assessed by subgroup analyses whether this association differed in the male and female subjects who had diabetes, hypertension, or metabolic syndrome (MetS), all of which relate closely to CVD.
Materials and Methods
Study participants
The Korea National Health and Nutrition Examination Survey (KNHANES) is a nationwide, population-based, and cross-sectional survey that has been conducted regularly since 1998 by the Division of Chronic Disease Surveillance of the Korea Centers for Disease Control and Prevention in the Ministry of Health and Welfare. Its aim is to monitor the general health and nutritional status of the non-institutionalized civilian population of South Korea [15]. Thus, every year, 10,000-12,000 individuals from 4,600 households are selected as representative Koreans by using a multi-stage clustered and stratified random sampling method that is based on national census data. The surveys consist of three components that each individual must complete, namely, a health interview, a nutritional questionnaire, and a health examination. The health and nutritional data are collected by interviews held in the home, while the health examination involves thorough standardized physical examinations that are conducted at mobile examination centers. Written informed consent is secured from all participants before the study starts. All KNHANES are conducted after receiving ethical approval from the Institutional Review Board of the Korea Center for Disease Control and Prevention: the ethics approval numbers that are relevant to this study are 2008-04EXP-01-C, 2009-01CON-03-2C, 2010-02CON-21-C, and 2011-02CON-06C. The KNHANES database is publicly available at the KNHANES web site (http://knhanes.cdc.go.kr, available in Korean). This study was conducted in accordance with the ethical guidelines set down in the Declaration of Helsinki (1975).
In the 2008-2011 KNHANES, dual-energy x-ray absorptiometry (DXA) was performed. In addition, in the 2011 KNHANES, urine albumin levels were measured. Therefore, for the present study assessing the effect of gender on the relationship between sarcopaenia and albuminuria in the 2011 study, we employed the data from the 2011 KNHANES.
Of the 10,589 people who participated in the 2011 KNHANES, 2,757 participants aged 18 years or older were tested for urine ACR and for body composition by using DXA. As shown in Figure 1, only subjects aged 50 years or older were included in this analysis (N=1,292). Premenopausal women (N=37), subjects with chronic liver diseases (hepatitis B, hepatitis C, and liver cirrhosis), chronic renal diseases, neoplastic diseases, and thyroid diseases (N = 151), and subjects with missing skeletal muscle mass data (N=17) were excluded. The remaining 1,087 subjects (492 males and 595 postmenopausal females) were included in the study.
Lifestyle factors and anthropometric measurements
During the physical examination, the age, weight, and height of the participant are recorded along with his or her smoking, drinking, and exercise habits. Weight (kilograms) and height (centimeters) were measured while the subject was dressed in light clothing without shoes. Body mass index (BMI) was calculated by dividing the patient's weight in kilograms by his/her height in meters squared. Smoking habit was categorized into three levels (never, past, or current), while drinking habit was indicated as yes when the subject consumed 3 U/d or greater of alcohol. Exercise was indicated as high intensity when the subject exercised regularly (defined as above 20 min per session and three or more times per week). High intensity exercise included moderate or vigorous physical activity. Moderate physical activity consisted of activity which was more strenuous or made one breathe harder than usual (e.g., slow swimming, playing tennis doubles, volleyball, badminton, table tennis, transporting light objects, etc.). Vigorous physical activity referred to engaging in intense physical activity which made one very tired or breathe much harder than usual (e.g., running, jogging, mountain climbing, fast cycling, fast swimming, playing soccer, playing basketball, skipping rope, playing squash or singles tennis, transporting heavy objects, etc.).
Biochemical measurements and clinical assessments
Blood samples from all participants were obtained for biochemical analysis during the survey. The samples were immediately refrigerated, transported to the Central Testing Institute in Seoul, Korea, and then analyzed within 24 hours of being drawn. Serum 25-hydroxyvitamin D (25OHD) level was measured by a radioimmunoassay (Diasorin) method using a 1470 Wizard Gamma Counter (PerkinElmer). 25OHD deficiency was defined as <20 ng/mL. Serum and urine creatinine levels and plasma glucose, total cholesterol, high-density lipoprotein cholesterol (HDL-C), triglyceride, and low-density lipoprotein cholesterol (LDL-C) levels were measured by using a Hitachi automatic analyzer 7600. Serum intact parathyroid hormone (PTH) was measured using a chemiluminescence immunoassay (N-tact PTH assay; DiaSorin). The average value of the interassay coefficient of variation for the PTH assay was 8.0%. Albuminuria was estimated as urine albumin-to-creatinine ratio (ACR) from fasting spot urine samples. Normoalbuminuria and increased albuminuria were defined as ACR <30 and ≥30 mg/g, respectively. Microalbuminuria and macroalbuminuria were defined as 30 mg/g ≤ ACR < 300 mg/g, and ACR ≥ 300 mg/g, respectively.
Figure 1
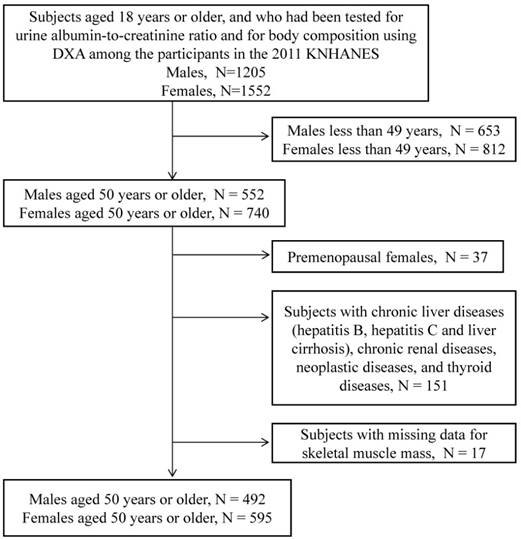
Flow chart depicting the disposition of subjects in this study.
Subjects were considered to have hypertension if they had a systolic blood pressure of 140 mmHg or greater and/or a diastolic blood pressure of 90 mm Hg or greater or if they were being treated for hypertension. A subject was deemed to have diabetes if he or she had a fasting blood glucose of ≥7.0 mmol/L that was first detected in this survey, used an antidiabetes medication, or was previously diagnosed with diabetes by a doctor. Subjects were considered to have dyslipidaemia if they reported that it had been diagnosed by a physician. A history of CVD was defined as a previous stroke, angina, or myocardial infarction. We used the National Cholesterol Education Program-Adult Treatment Panel III criteria to determine whether MetS was present; the cut-offs for the Asia-Pacific region were employed [16]. MetS was considered to be present if three or more of the following conditions were present: (i) systolic/diastolic blood pressure ≥130/85 mmHg or the subject was on antihypertensive drug treatment, (ii) fasting serum triglyceride ≥150 mg/dL, (iii) low HDL-C (<40 mg/dL in men and 50 mg/dL in women), (iv) waist circumference ≥90 cm in men and ≥80 cm in women, and/or (v) fasting serum glucose ≥100 mg/dL or the subject used an antidiabetes medication. The estimated glomerular filtration rate (eGFR) was calculated on the basis of the Modification of Diet in Renal Disease study equation [17].
Body composition measurements
In the KNHANES, body composition was measured at mobile examination centers by using a DXA (Discovery QDR 4500W, Hologic Inc, Belford, MA, USA) that was operated by licensed trained technicians. The whole-body DXA exams measured total and regional lean mass (kg) by using fan-beam technology. Different fat variables were measured, namely, total fat mass in kilograms, percentage fat mass (expressed as percentage of total mass), and appendicular skeletal muscle mass (ASM) in kilograms. ASM was defined as the sum of the lean soft tissue masses of the arms and legs and was measured by using the method of Heymsfield et al. [18]. The skeletal muscle mass index (SMI), which was expressed a percentage, was calculated by using the following formula: ASM (kg)/weight (kg)×100. Normal SMI was defined as SMI that was greater than the gender-specific mean minus one standard deviation (SD) of a young reference group (aged 20-39) in the KNHANES IV-V. Mild low muscle mass (LMM) was defined as an SMI that was within one and two SD below the gender-specific mean of the young reference group; this was a modification of the definition provided by previous studies [19, 20]. Severe LMM was defined as SMI values that were ≥two SDs below the gender-specific mean of the young reference group.
Statistical analysis
Continuous variables were expressed as mean ± SD and categorical variables as percentages. The groups were compared in terms of categorical variables by using the chi-squared test. The groups were compared in terms of continuous variables by using ANOVA for normally distributed continuous variables and Kruskal-Wallis nonparametric tests for nonparametric distributed covariates. To determine whether LMM associated independently with increased albuminuria, a multiple logistic regression model was used including variables that showed statistical significance (P-value <0.05) in a univariate model (enter method). Odds ratios (OR) and 95% confidence intervals (CI) for each variable were determined. P-values of <0.05 were considered to indicate statistical significance. All statistical analyses were performed by using PASW statistics 18 (SPSS Inc., Chicago, IL, USA).
Results
Characteristics of Study Participants According to Sex
Table 1 described the comparison of characteristics between male and female sex. Male subjects were more likely to be young, smoker and alcohol drinker, and to have regular exercise and higher calcium and phosphorus intake, and were less likely to have hypertension and MetS compared with females. Male subjects had lower BMI, diastolic blood pressure, total fat mass, total fat percentage, alkaline phosphatase, intact PTH, TC, HDL-C, and LDL-C levels and had higher ASM, blood urea nitrogen, 25OHD, fasting glucose, triglyceride, and SMI. There was more percentage of normal SMI in males than in females. However, the albuminuria excretion amount was not different between male and female sex.
Table 1
Characteristics of Study Participants According to Sex
| Men (n =492) | Women (n =595) | p-value | |
|---|---|---|---|
| Age (years) | 63.61±8.86 | 65.37±9.4 | 0.002 |
| BMI (kg/m2) | 23.81±2.8 | 24.19±3.3 | 0.041 |
| Current smoker (%) | 153(31.55) | 30 (5.10) | <.0001 |
| Alcohol drinker >3U/d (%) | 84(17.07) | 6(1.01) | <.0001 |
| Diabetes (%) | 75(15.46) | 83(14.12) | 0.615 |
| Hypertension (%) | 178(36.70) | 265(45.07) | 0.023 |
| Dyslipidaemia (%) | 237(51.75) | 262(48.88) | 0.368 |
| History of CVD (%) | 53(10.77) | 50(8.40) | 0.184 |
| Metabolic syndrome (%) | 175(35.57) | 285(47.90) | <.0001 |
| SBP (mmHg) | 127.76±17.62 | 128.47±17.89 | 0.513 |
| DBP (mmHg) | 77.82±10.5 | 76.26±10.09 | 0.013 |
| Estrogen replacement (%) | - | 74(12.59) | |
| Regular exercise (%) | 114(23.17) | 109(18.32) | 0.049 |
| Calcium intake (mg/day) | 556.32±412.73 | 405.4±287.74 | <.0001 |
| Phosphorus intake (mg/day) | 1288.51±560.52 | 915.77±414.08 | <.0001 |
| Total fat mass (kg) | 8.48±3.06 | 10.87±3.61 | <.0001 |
| Total fat percentage (%) | 24.93±6.21 | 35.97±6.98 | <.0001 |
| ASM (kg) | 20.93±2.88 | 14.05±1.94 | <.0001 |
| eGFR (ml/min/1.73m2) | 86.83±16.17 | 88.4±16.33 | 0.124 |
| Blood urea nitrogen (mg/dL) | 15.94±4.41 | 15.33±4.3 | 0.026 |
| 25OHD (ng/mL) | 18.04±5.83 | 16.51±6.44 | <.0001 |
| Alkaline phosphatase (IU/L) | 239.48±78.47 | 257.44±74.28 | 0.000 |
| Intact PTH | 64.48±23.29 | 67.72±27.54 | 0.042 |
| UACR (µg/mg) | 52.1±332.85 | 46.38±364.74 | 0.793 |
| Normoalbuminuria (%) | 429(87.20) | 525(88.24) | 0.873 |
| Microalbuminuria (%) | 53(10.77) | 59(9.92) | |
| Macroalbuminuria (%) | 10(2.03) | 11(1.85) | |
| Fasting glucose (mg/dL) | 105.04±28.04 | 101.37±24.42 | 0.027 |
| HbA1c | 6.04±0.92 | 6.02±0.95 | 0.789 |
| TC (mg/dL) | 189.17±36.46 | 202.47±37.4 | <.0001 |
| Triglyceride (mg/dL) | 161.42±138.1 | 139.04±88.96 | 0.003 |
| HDL-C (mg/dL) | 46.56±12.15 | 48.61±11.02 | 0.006 |
| LDL-C (mg/dL) | 112.12±33.57 | 125.59±34.33 | 0.001 |
| SMI | 31662.43±2694.51 | 24763.9±2734.71 | <.0001 |
| Normal SMI (%) | 345(70.12) | 349(58.66) | <.0001 |
| Mild LMM (%) | 125(25.41) | 174(29.24) | |
| Severe LMM (%) | 22(4.47) | 72(12.10) |
Characteristics of the males and females according to the muscle mass
Table 2 shows the characteristics of the study participants after they had been categorized according to gender and skeletal muscle mass. Thus, the prevalence of severe LMM was 4.5% in men and 12.1% in postmenopausal women aged 50 years and older.
Both men and women with severe LMM had higher BMI, total fat mass, and total fat percentage compared to the men and women with normal SMI or mild LMM, respectively. The men and women with severe LMM were also more likely to have hypertension, a history of CVD, and MetS. The men with severe LMM were older and were more likely to have dyslipidaemia and lower phosphorus intake than the men with normal SMI and mild LMM. By contrast, the women with severe LMM were similar in terms of age as the women who had normal SMI and mild LMM; they also did not differ in terms of dyslipidaemia rate or phosphorus intake. Both men and women with severe LMM had higher fasting glucose and haemoglobin A1c levels than the men and women with normal SMI and mild LMM, respectively. Men with severe LMM had lower eGFR, higher total cholesterol and triglyceride and lower LDL-cholesterol levels than the men with normal SMI and mild LMM. These differences were not observed in the women. However, women with severe LMM had higher intact PTH levels than the women with normal SMI and mild LMM; this difference was not observed in the men.
In both sexes, the groups with normal SMI, mild LMM, and severe LMM did not differ in terms of mean urinary ACR. However, men with mild LMM and severe LMM were significantly more likely to have micro- or macroalbuminuria (15.2% and 45.45%, respectively) than the men with normal SMI (9.86%, P<0.0001). By contrast, the women with normal SMI, mild LMM, and severe LMM did not differ in terms of rates of micro- or macroalbuminuria (P=0.817).
Gender-specific relationships between severe LMM and increased albuminuria
To identify the factors that associate with increased albuminuria, logistic regression analyses were performed. Table 3 shows the logistic regression analysis performed separately in the men and women. In men, severe LMM (OR=7.661, 95% CI=2.72-21.579) associated independently with increased albuminuria. In women, severe LMM did not associate significantly with increased albuminuria.
Effect of hypertension, diabetes, or MetS on the gender-specific relationship between severe LMM and increased albuminuria
Subgroup logistic regression analyses were performed to determine whether the male gender-specific relationship between severe LMM and increased albuminuria continued to be observed when the subjects were categorized according to whether they did or did not have hypertension, diabetes, or MetS.
Table 2
Characteristics of Study Participants According to the Skeletal Muscle Mass
| Men (n = 492) | Women (n = 595) | |||||||
|---|---|---|---|---|---|---|---|---|
| Normal SMI (n =345) | Mild LMM (n =125) | Severe LMM (n =22 ) | p-value | Normal SMI (n =349) | Mild LMM (n =174) | Severe LMM (n =72) | p-value | |
| Age (years) | 62.83±8.80 | 65.15±9.10 | 67.14±6.39 | 0.006* | 65.23±9.8 | 64.89±8.73 | 67.21±8.88 | 0.192* |
| BMI (kg/m2) | 23.24±2.63 | 24.85±2.57 | 26.68±3.24 | <.0001* | 22.93±2.67 | 25.37±2.69 | 27.4±4.12 | <.0001* |
| Current smoker (%) | 114 (33.43) | 34 (27.64) | 5 (23.81) | 0.051# | 26 (7.54) | 2 (1.16) | 2 (2.82) | 0.136# |
| Alcohol drinker >3U/d (%) | 62(17.97) | 15 (12.00) | 7(31.82) | 0.053# | 4 (1.15) | 1 (0.57) | 1(1.39) | 0.779# |
| Diabetes (%) | 43 (12.61) | 28 (22.76) | 4 (19.05) | 0.093# | 43 (12.46) | 26 (15.12) | 14 (19.72) | 0.620# |
| Hypertension (%) | 102 (29.91) | 63 (51.22) | 13 (61.90) | <.0001# | 128 (37.1) | 92 (53.49) | 45 (63.38) | 0.0004# |
| Dyslipidaemia (%) | 147 (42.61) | 73 (58.40) | 17 (77.27) | 0.0002# | 143 (40.97) | 81 (46.55) | 38 (52.78) | 0.134# |
| History of CVD (%) | 28 (8.12) | 18 (14.40) | 7 (31.82) | 0.0008# | 20 (5.73) | 19 (10.92) | 11 (15.28) | 0.010# |
| Metabolic syndrome (%) | 93 (26.96) | 67 (53.60) | 15 (68.18) | <.0001# | 135 (38.68) | 102 (58.62) | 48 (66.67) | <.0001# |
| SBP (mmHg) | 127.05±18.17 | 128.23±16.02 | 136.18±15.92 | 0.058* | 127.49±18.44 | 130.22±17.02 | 128.92±17.09 | 0.252* |
| DBP (mmHg) | 77.9±10.69 | 77.14±9.92 | 80.5±10.85 | 0.374* | 75.63±10.46 | 78.01±9.59 | 75.1±8.99 | 0.022* |
| Estrogen replacement (%) | _ | _ | _ | _ | 50 (14.49) | 18 (10.47) | 6 (8.45) | 0.528# |
| Regular exercise (%) | 78 (22.61) | 33 (26.40) | 3 (13.64) | 0.383# | 63 (18.05) | 32 (18.39) | 14 (19.44) | 0.961# |
| Calcium intake (mg/day) | 580.66±438.88 | 513.72±347.83 | 417.86±266.18 | 0.099* | 414.11±303.87 | 397.94±276.46 | 382.91±234.42 | 0.660* |
| Phosphorus intake (mg/day) | 1332.86±560.89 | 1208.05±568.58 | 1051.02±404.86 | 0.018* | 929.33±430.46 | 898.47±352.77 | 894.16±470.97 | 0.663* |
| Total fat mass (kg) | 7.37±2.44 | 10.7±2.57 | 13.38±2.88 | <.0001* | 9.08±2.73 | 12.54±2.55 | 15.53±3.45 | <.0001* |
| Total fat percentage (%) | 22.53±5.11 | 29.77±4.43 | 35.12±4.14 | <.0001* | 32.22±5.71 | 39.88±3.95 | 44.74±5.04 | <.0001* |
| ASM (kg) | 21.41±2.86 | 20±2.61 | 18.61±2.3 | <.0001* | 14.41±1.89 | 13.71±1.79 | 13.17±2.06 | <.0001* |
| eGFR (ml/min/1.73m2) | 87.34±14.85 | 87.11±18.91 | 77.23±17.97 | 0.020* | 87.92±15.35 | 88.66±17.42 | 90.18±18.46 | 0.579* |
| Blood urea nitrogen (mg/dL) | 16.01±4.25 | 15.48±4.63 | 17.43±5.46 | 0.158* | 15.27±4.19 | 15.35±4.48 | 15.63±4.41 | 0.820* |
| 25OHD (ng/mL) | 18.34±5.92 | 17.49±5.65 | 16.17±4.89 | 0.129* | 16.38±6.45 | 17.03±6.03 | 15.94±7.32 | 0.442* |
| Alkaline phosphatase (IU/L) | 238.88±73.24 | 240.3±95.81 | 244.71±53.74 | 0.939* | 253.72±73.31 | 262.01±70.18 | 265.38±87.48 | 0.342* |
| Intact PTH | 64.87±24.74 | 62.7±19.44 | 67.9±18.34 | 0.546* | 66.24±26.26 | 67.25±24.82 | 76.33±37.29 | 0.025* |
| UACR (µg/mg) | 58.46±389.79 | 23.7±54.97 | 109.52±234.72 | 0.450* | 52.99±442.54 | 37.61±221.27 | 34.22±143.85 | 0.872* |
| Normoalbuminuria (%) | 311(90.14) | 106(84.80) | 12(54.55) | <.0001# | 309(88.54) | 151(86.78) | 65(90.28) | 0.817# |
| Microalbuminuria (%) | 27(7.83) | 19(15.20) | 7(31.82) | 34(9.74) | 20(11.49) | 5(6.94) | ||
| Macroalbuminuria (%) | 7(2.03) | 0(0.00) | 3(13.64) | 6(1.72) | 3(1.72) | 2(2.78) | ||
| Fasting glucose (mg/dL) | 102.76±27.34 | 109.13±26.62 | 119.19±39.41 | 0.006* | 99.06±21.95 | 101.68±23.39 | 112.28±34.2 | 0.0003* |
| HbA1c | 5.94±0.87 | 6.17±0.91 | 6.74±1.29 | <.0001* | 5.94±0.89 | 6.03±0.91 | 6.37±1.20 | 0.003* |
| TC (mg/dL) | 192.13±35.09 | 178.11±36.41 | 202.14±45.69 | 0.0004* | 204.33±36.97 | 201.27±37.78 | 195.95±38.38 | 0.230* |
| Triglyceride (mg/dL) | 154.25±117.32 | 159.73±132.04 | 284.57±319.01 | 0.0001* | 138.64±95.39 | 138.23±78.43 | 142.97±79.4 | 0.929* |
| HDL-C (mg/dL) | 47.56±12.43 | 43.96±10.77 | 44.69±12.86 | 0.021* | 49.09±11.65 | 47.96±9.81 | 47.76±10.49 | 0.470* |
| LDL-C (mg/dL) | 115.93±33.13 | 100.79±32.41 | 92±40.04 | 0.041* | 126.97±35.35 | 124.92±34.47 | 120.29±30.08 | 0.795* |
ANOVA *, Chi-squared test #
Table 3
Univariate and Multivariate Analyses of Factors Associated with Increased Albuminuria in the Total Study Participants.
| Men | Women | |||||||
|---|---|---|---|---|---|---|---|---|
| Univariate Model | Multivariate Model | Univariate Model | Multivariate Model | |||||
| OR (95% CI) | p-value | OR (95% CI) | p-value | OR (95% CI) | p-value | OR (95% CI) | p-value | |
| Age | 0.774 | 0.119 | ||||||
| 50-59 | 1.00 (Reference) | 1.00 (Reference) | ||||||
| 60-69 | 0.782 [0.413,1.48] | 0.449 | 1.577 [0.797,3.122] | 0.191 | ||||
| 70-79 | 1.116 [0.568,2.194] | 0.750 | 2.057 [1.04,4.068] | 0.038 | ||||
| 80- | 0.985 [0.271,3.579] | 0.981 | 2.595 [1.026,6.564] | 0.044 | ||||
| BMI | 0.314 | |||||||
| < 18.5 | 1.00 (Reference) | 1.00 (Reference) | ||||||
| 18.5≤ <23.0 | 2.344 [0.296,18.527] | 0.419 | 0.368 [0.111,1.227] | 0.103 | ||||
| 23.0≤ <25 | 1.477 [0.18,12.096] | 0.716 | 0.437 [0.129,1.482] | 0.184 | ||||
| ≥ 25 | 2.748 [0.347,21.785] | 0.338 | 0.529 [0.163,1.716] | 0.288 | ||||
| Current Smoking | 0.169 | |||||||
| (Current vs. Never) | 2.738 [0.917,8.17] | 0.071 | 0.81 [0.239,2.74] | 0.734 | ||||
| (Past vs. Never) | 2.053 [0.698,6.037] | 0.191 | 1.511 [0.426,5.365] | 0.523 | ||||
| Alcohol intake >3 Unit/d | 0.916 [ 0.446, 1.881] | 0.811 | NA* | NA* | ||||
| Physical activity | 0.944 [0.501,1.779] | 0.858 | 1.023 [0.539,1.943] | 0.944 | ||||
| Diabetes | 4.903 [2.736,8.785] | <.0001 | 4.282[2.14,8.567] | <.0001 | 1.464 [0.762,2.811] | 0.253 | ||
| Hypertension | 1.934 [1.136,3.293] | 0.015 | 0.902[0.456,1.786] | 0.767 | 2.354 [1.399,3.962] | 0.001 | ||
| Dyslipidaemia | 2.428 [1.35,4.368] | 0.003 | 1.348 [0.659,2.761] | 0.413 | 1.645 [0.971,2.789] | 0.064 | ||
| History of CVD | 2.224 [1.099,4.5] | 0.026 | 1.279 [0.545,3.004] | 0.571 | 1.04 [0.426,2.538] | 0.931 | ||
| Metabolic syndrome | 3.039 [1.771,5.217] | <.0001 | 1.211 [0.56,2.619] | 0.625 | 1.168 [0.709,1.922] | 0.542 | ||
| Vitamin D deficiency (<20 ng/ml)) | 1.022 [0.978,1.069] | 0.332 | 1.024 [0.986,1.062] | 0.220 | ||||
| Estrogen replacement | _ | _ | _ | _ | 0.564 [0.236,1.349] | 0.197 | ||
| eGFR <60ml/min/1.73m2 | 0.975 [0.959,0.992] | 0.004 | 0.987 [0.969,1.005] | 0.149 | 0.991 [0.976,1.007] | 0.272 | ||
| Skeletal muscle mass | <.0001 | 0.0006 | 0.715 | |||||
| Normal SMI | 1.00 (Reference) | 1.00 (Reference) | ||||||
| Mild LMM | 1.64 [0.897,2.997] | 0.108 | 1.464 [0.738,2.902] | 0.275 | 1.177 [0.68,2.037] | 0.561 | ||
| Severe LMM | 7.623 [3.066,18.953] | <.0001 | 7.661 [2.72,21.579] | 0.0001 | 0.832 [0.357,1.94] | 0.670 | ||
* In women, the number of subjects taking alcohol >3Unit/d was too small, that an odds ratio for the other groups cannot be calculated.
In the hypertension group, severe LMM continued to be an independent predictor of increased albuminuria in men (OR=11.449, 95% CI=3.037-43.156) but not in women (Table 4). In the non-hypertension (Supplementary Table 1) and diabetes (Supplementary Table 2) groups, severe LMM did not associate significantly with albuminuria in either men or women. In the non-diabetes group, severe LMM continued to be an independent predictor in men (OR 8.782, 95% CI 3.046-25.322) but not in women (Table 5). In the MetS group, severe LMM did not associate with increased albulminuria in either men or women (Supplementary Table 3). However, in the non-MetS group, severe LMM continued to be an independent predictor of increased albulminuria in men (OR=8.183, 95% CI=1.539-43.156) but not in women (Table 6).
Discussion
This study, which was based on nationwide and population-based health examination and survey data, clearly showed that there was a male gender-specific association between severe LMM and micro- or macroalbuminuria. Notably, the association was only observed in men with hypertension, non-diabetic men, and men without MetS. These findings suggest that middle-aged and elderly men who exhibit severe loss of skeletal muscle mass are more prone than women with low skeletal muscle mass to have increased albuminuria and that this risk is particularly prominent in hypertensive men and in men without diabetes and MetS.
Recent studies suggest that the glycocalyx that is present on the surface of the endothelial cells in the glomerulus and widespread vasculature may play a protective role in vessel wall homeostasis. Indeed, it has been proposed that the loss of the endothelial glycocalyx may be an initial mechanistic link between the albuminuria and vasculopathy that occurs during oxidative stress [21]. Thus, albuminuria excretion can serve as a correlate of the atherosclerotic vascular changes that are driven by systemic endothelial dysfunction. Therefore, our results suggest that middle-aged and elderly men with severe LMM may be at higher risk of endothelial dysfunction than similarly-aged women with severe LMM. These observations are consistent with those of other studies that show the prevalence of microalbuminuria is higher in men than in women [10, 11], and that men with a given level of a cardiovascular risk factor have higher albuminuria levels than women with the same cardiovascular risk factor level [10]. Altogether, these findings indicate that there is a gender difference in the association between cardiovascular risk factors and albuminuria.
Table 4
Subgroup Analysis of Hypertension Patients: Univariate and Multivariate Analyses of Factors Associated with Increased Albuminuria.
| Men (n = 178) | Women (n = 265) | |||||||
|---|---|---|---|---|---|---|---|---|
| Univariate Model | Multivariate Model | Univariate Model | Multivariate Model | |||||
| OR (95% CI) | p-value | OR (95% CI) | p-value | OR (95% CI) | p-value | OR (95% CI) | p-value | |
| Age | 0.954 | 0.800 | ||||||
| 50-59 | 1.00 (Reference) | 1.00 (Reference) | ||||||
| 60-69 | 1.061 [0.406,2.772] | 0.903 | 1.25 [0.451,3.459] | 0.667 | ||||
| 70-79 | 0.946 [0.332,2.698] | 0.917 | 1.602 [0.594,4.32] | 0.351 | ||||
| 80- | 0.578 [0.063,5.296] | 0.627 | 1.301 [0.331,5.121] | 0.706 | ||||
| BMI | 0.112 | |||||||
| < 18.5 | 1.00 (Reference) | 1.00 (Reference) | ||||||
| 18.5≤ <23.0 | NA* | NA* | 0.143 [0.025,0.807] | 0.027 | ||||
| 23.0≤ <25 | NA* | NA* | 0.265 [0.048,1.471] | 0.129 | ||||
| ≥ 25 | NA* | NA* | 0.175 [0.033,0.935] | 0.041 | ||||
| Current Smoking | 0.359 | 0.852 | ||||||
| (Current vs. Never) | 4.765 [0.559,40.64] | 0.153 | 0.777 [0.169,3.577] | 0.746 | ||||
| (Past vs. Never) | 4.125 [0.522,32.568] | 0.178 | 1.444 [0.289,7.204] | 0.654 | ||||
| Alcohol intake >3 Unit/d | 1.667 [0.672 , 4.133] | 0.270 | NA# | NA# | ||||
| Physical activity | 0.566 [0.203,1.575] | 0.275 | 1.167 [0.501,2.716] | 0.720 | ||||
| Diabetes | 3.529 [1.584,7.865] | 0.002 | 3.531 [1.421,8.774] | 0.006 | 1.197 [0.564,2.54] | 0.639 | ||
| Dyslipidaemia | 2.126 [0.854,5.29] | 0.104 | 1.537 [0.779,3.033] | 0.215 | ||||
| History of CVD | 1.957 [0.81,4.727] | 0.135 | 0.919 [0.36,2.344] | 0.859 | ||||
| Metabolic syndrome | 2.883 [1.175,7.075] | 0.020 | 1.743 [0.605,5.025] | 0.303 | 0.631 [0.322,1.236] | 0.179 | ||
| Vitamin D deficiency (<20 ng/ml)) | 1.012 [0.947,1.082] | 0.722 | 1.017 [0.971,1.065] | 0.472 | ||||
| Estrogen replacement | _ | _ | _ | _ | 0.72 [0.265,1.958] | 0.520 | ||
| eGFR <60ml/min/1.73m2 | 0.969 [0.946,0.993] | 0.010 | 0.983 [0.964,1.002] | 0.080 | ||||
| Skeletal muscle mass | 0.0009 | 0.639 | ||||||
| Normal SMI | 1.00 (Reference) | 1.00 (Reference) | ||||||
| Mild LMM | 1.448 [0.605,3.466] | 0.405 | 1.182 [0.464,3.006] | 0.726 | 0.778 [0.378,1.6] | 0.494 | ||
| Severe LMM | 10.954 [3.108,38.61] | 0.0002 | 11.449 [3.037,43.156] | 0.0003 | 0.667 [0.253,1.754] | 0.411 | ||
* In men, the number of subjects with BMI < 18.5 (the reference group) was 16 (3.25%), which was a too small number that an odds ratio for the other groups cannot be calculated.
# In women, the number of subjects taking alcohol >3Unit/d was too small, that an odds ratio for the other groups cannot be calculated.
Table 5
Subgroup Analysis of Non-diabetes Patients: Univariate and Multivariate Analyses of Factors Associated with Increased Albuminuria.
| Men (n = 417) | Women (n = 512) | |||||||
|---|---|---|---|---|---|---|---|---|
| Univariate Model | Multivariate Model | Univariate Model | Multivariate Model | |||||
| OR (95% CI) | p-value | OR (95% CI) | p-value | OR (95% CI) | p-value | OR (95% CI) | p-value | |
| Age | 0.504 | 0.583 | ||||||
| 50-59 | 1.00 (Reference) | 1.00 (Reference) | ||||||
| 60-69 | 1.385 [0.6,3.198] | 0.445 | 1.403 [0.693,2.84] | 0.346 | ||||
| 70-79 | 1.786 [0.743,4.294] | 0.195 | 1.547 [0.735,3.258] | 0.250 | ||||
| 80- | 2.273 [0.579,8.917] | 0.239 | 1.851 [0.624,5.485] | 0.266 | ||||
| BMI | 0.283 | 0.525 | ||||||
| < 18.5 | 1.00 (Reference) | 1.00 (Reference) | ||||||
| 18.5≤ <23.0 | 1.469 [0.18,11.96] | 0.719 | 0.441 [0.114,1.703] | 0.235 | ||||
| 23.0≤ <25 | 0.921 [0.106,8.013] | 0.941 | 0.481 [0.121,1.914] | 0.299 | ||||
| ≥ 25 | 2.222 [0.275,17.988] | 0.454 | 0.635 [0.168,2.399] | 0.503 | ||||
| Current Smoking | 0.292 | 0.485 | ||||||
| (Current vs. Never) | 3.262 [0.724,14.696] | 0.124 | 0.342 [0.045,2.579] | 0.297 | ||||
| (Past vs. Never) | 2.548 [0.577,11.255] | 0.217 | 1.57 [0.335,7.358] | 0.567 | ||||
| Alcohol intake >3 Unit/d | 0.540 [0.185,1.572] | 0.258 | NA* | NA* | ||||
| Physical activity | 0.885 [0.391,2] | 0.768 | 0.904 [0.439,1.862] | 0.784 | ||||
| Hypertension | 1.754 [0.893,3.445] | 0.103 | 2.266 [1.288,3.987] | 0.005 | ||||
| Dyslipidaemia | 2.312 [1.116,4.791] | 0.024 | 1.462 [0.634,3.375] | 0.373 | 1.638 [0.923,2.905] | 0.091 | ||
| History of CVD | 2.188 [0.847,5.647] | 0.105 | 0.657 [0.196,2.208] | 0.497 | ||||
| Metabolic syndrome | 2.453 [1.248,4.823] | 0.009 | 1.257 [0.541,2.921] | 0.594 | 1.071 [0.611,1.877] | 0.811 | ||
| Vitamin D deficiency (<20 ng/ml)) | 1.049 [0.993,1.108] | 0.086 | 1.028 [0.984,1.074] | 0.218 | ||||
| Estrogen replacement | _ | _ | _ | _ | 0.547 [0.211,1.42] | 0.215 | ||
| eGFR <60ml/min/1.73m2 | 0.962 [0.94,0.984] | 0.0008 | 0.976 [0.952,1] | 0.055 | 0.998 [0.98,1.016] | 0.844 | ||
| Skeletal muscle mass | 0.0003 | 0.009 | ||||||
| Normal SMI | 1.00 (Reference) | 1.00 (Reference) | ||||||
| Mild LMM | 1.313 [0.583,2.958] | 0.511 | 1.174 [0.475,2.903] | 0.728 | 1.146 [0.622,2.113] | 0.662 | ||
| Severe LMM | 8.782 [3.046,25.322] | <.0001 | 6.185 [1.889,20.251] | 0.003 | 0.784 [0.292,2.102] | 0.629 | ||
* In women, the number of subjects taking alcohol >3Unit/d was too small, that an odds ratio for the other groups cannot be calculated.
Table 6
Subgroup Analysis of Non-metabolic Syndrome Patients: Univariate and Multivariate Analyses of Factors Associated with Increased Albuminuria.
| Men (n = 317) | Women (n - 310) | |||||||
|---|---|---|---|---|---|---|---|---|
| Univariate Model | Multivariate Model | Univariate Model | Multivariate Model | |||||
| OR (95% CI) | p-value | OR (95% CI) | p-value | OR (95% CI) | p-value | OR (95% CI) | p-value | |
| Age | 0.696 | 0.031 | 0.164 | |||||
| 50-59 | 1.00 (Reference) | 1.00 (Reference) | ||||||
| 60-69 | 1.234 [0.446,3.412] | 0.685 | 2.823 [1.019,7.816] | 0.045 | 2.014 [0.698,5.806] | 0.195 | ||
| 70-79 | 1.45 [0.504,4.172] | 0.490 | 4.704 [1.674,13.219] | 0.003 | 3.229 [1.042,10.003] | 0.042 | ||
| 80- | 2.29 [0.557,9.404] | 0.250 | 3.477 [0.909,13.298] | 0.068 | 3.833 [0.823,17.859] | 0.087 | ||
| BMI | 0.387 | 0.379 | ||||||
| < 18.5 | 1.00 (Reference) | 1.00 (Reference) | ||||||
| 18.5≤ <23.0 | 1.63 [0.202,13.18] | 0.646 | 0.42 [0.106,1.655] | 0.214 | ||||
| 23.0≤ <25 | 0.615 [0.064,5.912] | 0.674 | 0.378 [0.086,1.668] | 0.199 | ||||
| ≥ 25 | 1.167 [0.12,11.301] | 0.894 | 0.72 [0.169,3.071] | 0.657 | ||||
| Current Smoking | 0.531 | 0.814 | ||||||
| (Current vs. Never) | 2.2 [0.466,10.395] | 0.319 | 0.517 [0.066,4.043] | 0.529 | ||||
| (Past vs. Never) | 1.563 [0.338,7.221] | 0.567 | 0.861 [0.106,7.022] | 0.888 | ||||
| Alcohol intake >3 Unit/d | 0.864 [0.286,2.612] | 0.795 | NA* | NA* | ||||
| Physical activity | 0.824 [0.3,2.269] | 0.708 | 0.508 [0.172,1.5] | 0.220 | ||||
| Diabetes | 5.561 [1.946,15.89] | 0.001 | 4.495 [1.495,13.513] | 0.007 | 2.086 [0.424,10.252] | 0.365 | ||
| Hypertension | 1.243 [0.501,3.083] | 0.639 | 3.297 [1.592,6.829] | 0.001 | 3.354 [1.497,7.514] | 0.003 | ||
| Dyslipidaemia | 1.94 [0.851,4.422] | 0.115 | 1.777 [0.838,3.766] | 0.133 | ||||
| History of CVD | 2.182 [0.693,6.871] | 0.182 | 1.703 [0.467,6.214] | 0.420 | ||||
| Vitamin D deficiency (<20 ng/ml)) | 1.017 [0.95,1.089] | 0.629 | 1.069 [1.011,1.13] | 0.018 | 1.067 [1.007,1.13] | 0.027 | ||
| Estrogen replacement | _ | _ | _ | _ | 0.586 [0.171,2.009] | 0.394 | ||
| eGFR <60ml/min/1.73m2 | 0.988 [0.962,1.015] | 0.395 | 0.991 [0.967,1.015] | 0.438 | ||||
| Skeletal muscle mass | 0.007 | 0.030 | 0.546 | |||||
| Normal SMI | 1.00 (Reference) | 1.00 (Reference) | ||||||
| Mild LMM | 2.025 [0.792,5.174] | 0.140 | 1.923 [0.739,5.009] | 0.180 | 1.131 [0.499,2.561] | 0.767 | ||
| Severe LMM | 11.063 [2.278,53.722] | 0.002 | 8.183 [1.539,43.495] | 0.013 | 0.345 [0.045,2.665] | 0.307 | ||
* In women, the number of subjects taking alcohol >3Unit/d was too small, that an odds ratio for the other groups cannot be calculated.
The pathophysiological mechanism underlying the male-specific association between low skeletal muscle mass and increased albuminuria is unclear but there are several possible contributors. One relates to the well-known differences between men and women in terms of their levels of the sex hormones and how these levels change during aging. In particular, testosterone increases both skeletal muscle and bone mass whereas estrogen only affects the bone [22]. Moreover, in healthy males, bioavailable testosterone levels drop by as much as 64% between the ages of 25 and 85 years, whereas in women, it falls by only 28% [23]. Additionally, in postmenopausal women, the conversion of androgens to estrogens occurs in adipose tissue [24]; by contrast, in men, adipose tissue is not a source of androgens [25]. Several lines of evidence suggest that these sex hormone differences between men and women during youth and aging may differentially affect their muscle mass. In particular, in older men, serum testosterone levels correlate positively with muscle strength whereas in older women, the decrease in bioavailable testosterone has not been linked to declines in muscle mass or strength [26, 27]. Several additional lines of evidence also suggest that the changes in sex hormones during aging increases the risk of CVD in men but not women. In particular, it has been shown that low levels of the testosterone precursor dihydroepiandrosterone (DHEA), whose plasma concentrations drop by 5-fold in men at age 85 compared to at age 30 years [28], associate with elevated mortality and CV risk in men but not women [29]. These observations together suggest that the age-related sex hormone changes in men, but not in women, decrease muscle mass in an as yet unclear mechanism that also promotes endothelial dysfunction (as indicated by the increased albuminuria) [10, 30] and CVD.
The male-specific association between low skeletal muscle mass and albuminuria may also relate to gender differences in terms of sarcopaenia pathogenesis. Notably, it was reported that sarcopaenia in men may be driven by the catabolic influence of myostatin whereas in women, sarcopaenia may involve an anabolic hormone, namely, insulin-like growth factor-1 [31]. Moreover, when myostatin is genetically disrupted in LDL receptor-null mice, which are an experimental model of atherogenesis, the development of pro-atherogenic dyslipidaemia and atherogenic lesions is attenuated [32]. In our study, the men with severe LMM were older, more likely to have dyslipidaemia, and had higher total cholesterol and triglyceride levels than the men with normal SMI or mild LMM, whereas the female groups did not differ in terms of these variables. Consistent with this, it has been shown that low levels of DHEA and DHEA-S associate with low HDL-C and elevated total cholesterol and triglyceride levels [29]. Thus, since dyslipidaemia plays a role in the development of albuminuria [33-35], the male-specific relationship between severe LMM and increased albuminuria may reflect the influence of myostatin and androgen on sarcopaenia and dyslipidaemia in men. In relation to the latter point, the men with severe LMM in our study had lower LDL-cholesterol levels than men with normal SMI and mild LMM, despite the fact that they were more likely to have dyslipidaemia. This may be because the subjects who were defined as having dyslipidaemia included subjects taking lipid-lowering medications.
In our study, the characteristics of male and female were different, in terms of social behaviors, dietary habits, metabolic profiles, and muscle mass. These findings are consistent with previous literature in that women are more prone to develop MetS than men [36], and that PTH and vitamin D are differentially associated with metabolic obesity according to sex [37]. These differences may have altogether influenced the association between skeletal muscle mass and albuminuria, although the mechanism cannot be elucidated.
Our subgroup analyses involved categorising our subjects according to whether they had hypertension, diabetes, or MetS. These diseases were chosen because they are known to associate with increased albuminuria [33, 38]. Interestingly, the association between severe LMM and increased albuminuria was significant in hypertensive, but not non-hypertensive, men. One possible explanation for this association is that hypertension-induced endothelial dysfunction promotes sarcopaenia. The evidence for this is as follows. First, it is well known that increased albuminuria is a marker of vascular endothelial damage [10, 30] and that microalbuminuria associates strongly with vascular disease in hypertension [39]. Second, a recent review reported that endothelial dysfunction and impaired muscle protein metabolism contribute to the development of sarcopaenia [40]. Thus, the relationship between severe LMM and increased albuminuria in hypertensive men may reflect endothelial dysfunction. Another possible explanation for the association between severe LMM and albuminuria in hypertensive men is that sarcopaenia promotes the vascular dysfunction that associates with hypertension because in sarcopaenia, the myokines that are secreted by the skeletal muscles are reduced.[40] Thus, since myokines confer anti-inflammatory and protective effects on vascular function, sarcopenia may promote the development of hypertensive vasculopathy (as indicated by the increased albuminuria). A third explanation is that the hypertension-related alterations in the renin-angiotensin-aldosterone system (RAAS) may promote sarcopaenia: there is evidence that inhibiting the RAAS improves skeletal muscle blood flow and muscle metabolism [41]. It is also well known that inhibiting the RAAS reduces albuminuria [42]. Thus, both the severe LMM and albuminuria in hypertensive men may reflect hypertension-related alterations in the RAAS.
Hypertension increases the shear stress and circumferential stretch of the vascular wall, which in turn damages the blood vessels [43]. By contrast, in diabetes, the hyperglycaemia leads to the local production of molecules that increase the membrane permeability of vessels, including the glycocalyx [44]; this causes dysregulation of intracellular metabolic pathways, which in turn damages the glycocalyx and thereby induces glomerular endothelial dysfunction. This ultimately leads to microalbuminuria [21]. Thus, hypertension and diabetes may differ in terms of the effector molecules that promote their associated endothelial dysfunction. In our study, severe LMM associated with albuminuria in the men who did not have diabetes or MetS: this association was not observed in the diabetic men or the men with MetS. These findings suggest that low skeletal muscle mass may be a risk factor for increased albuminuria in men without diabetes or MetS. The reason for this is unclear but it is possible that the link between low skeletal muscle mass, insulin resistance, and endothelial dysfunction in diabetes and MetS involves a different pathway from the pathway that links hyperglycaemia, hyperinsulinaemia and microalbuminuria. Further studies are needed to confirm the mechanism for this.
There are limitations of this study. First, it is a cross-sectional analysis, which cannot prove any causal relationship between low skeletal muscle mass and albuminuria. Second, only single measurements of albuminuria were available, which is not as desirable as using the mean of several measurements. Third, the mechanisms of the relationship between low skeletal muscle mass and albuminuria were not proved. Fourth, the effect of medications which may affect albuminuria or dyslipidaemia, such as RAAS blockers or statins, was not considered in the analyses, since the specific information of medications was not included in KNHANES data. Fifth, we used the weight-adjusted skeletal muscle mass instead of height-adjusted skeletal muscle mass, which the working group for sarcopenia guidelines recommended [45-47]. We used the weight-adjusted definition because many Korean studies have most often used weight-adjusted muscle mass to define low skeletal muscle mass when evaluating the association with CVD [4, 48-55]. Despite these limitations, our study had some strengths: it was the first to evaluate the gender-specific association between low skeletal muscle mass and albuminuria, and the effect of hypertension, diabetes and MetS was analyzed. Until recently, the association between low skeletal muscle mass and albuminuria was poorly understood. However, this year, Kim et al. used the 2011 KNHANES data and found that there is a relationship between low skeletal muscle mass and albuminuria [52]. Our study results are consistent with those of Kim et al. in that we observed that subjects with low skeletal muscle mass have an increased risk of elevated albuminuria. However, there are also several differences between our study and that of Kim et al. First, the study by Kim et al. included all subjects aged over 19 years [52] whereas our study included subjects who were 50 or more years old. We sought to explore the significance of low skeletal muscle mass in the middle-aged and elderly population who has increased CVD risk. Another difference between the two studies is that our study, but not the study by Kim et al., excluded subjects with chronic diseases that may affect muscle wasting, including liver, renal, neoplastic, and thyroid diseases. Yet another difference was that our study examined the relationship between low skeletal muscle mass and albuminuria by categorising subjects on the basis of gender and the presence or absence of hypertension, diabetes, and MetS.
In conclusion, we observed a gender-specific difference in the association between low skeletal muscle mass and increased albuminuria. Moreover, this association was only observed in men with hypertension and in men without diabetes or MetS. This study suggests that assessing older men, especially those with hypertension and those without diabetes or MetS, for the presence of low skeletal muscle mass and then applying preventive or therapeutic strategies may help to prevent or attenuate albuminuria and the possibly associated CVD.
Supplementary Material
Supplementary tables.
Acknowledgements
This research was supported by the Basic Science Research Program through the National Research Foundation of Korea (NRF) that is funded by the Ministry of Science, ICT and future Planning (2014R1A1A3A04050919) and the Basic Science Research Program through NRF that is funded by the Ministry of Education, Science, and Technology (NRF-2014R1A1A1006695).
Author contributions
HEY and KYK: performed the data analysis, participated in the study design, and wrote the manuscript; YN, EK, HSH, SJS, and YSK: participated in the study design and data collections.
Competing Interests
The authors have declared that no competing interest exists.
References
1. Ryall JG, Schertzer JD, Lynch GS. Cellular and molecular mechanisms underlying age-related skeletal muscle wasting and weakness. Biogerontology. 2008;9:213-28
2. Kim TN, Choi KM. The implications of sarcopenia and sarcopenic obesity on cardiometabolic disease. J Cell Biochem. 2015;116:1171-8
3. Snijder MB, Henry RM, Visser M. et al. Regional body composition as a determinant of arterial stiffness in the elderly: The Hoorn Study. J Hypertens. 2004;22:2339-47
4. Byeon CH, Kang KY, Kang SH, Bae EJ. Sarcopenia is associated with Framingham risk score in the Korean population: Korean National Health and Nutrition Examination Survey (KNHANES) 2010-2011. J Geriatr Cardiol. 2015;12:366-72
5. Coelho Junior HJ, Aguiar Sda S, Goncalves Ide O. et al. Sarcopenia Is Associated with High Pulse Pressure in Older Women. J Aging Res. 2015;2015:109824
6. Onoue Y, Izumiya Y, Hanatani S. et al. A simple sarcopenia screening test predicts future adverse events in patients with heart failure. Int J Cardiol. 2016;215:301-6
7. Gerstein HC, Mann JF, Yi Q. et al. Albuminuria and risk of cardiovascular events, death, and heart failure in diabetic and nondiabetic individuals. Jama. 2001;286:421-6
8. Targher G, Zoppini G, Chonchol M. et al. Glomerular filtration rate, albuminuria and risk of cardiovascular and all-cause mortality in type 2 diabetic individuals. Nutr Metab Cardiovasc Dis. 2011;21:294-301
9. Yuyun MF, Khaw KT, Luben R. et al. Microalbuminuria independently predicts all-cause and cardiovascular mortality in a British population: The European Prospective Investigation into Cancer in Norfolk (EPIC-Norfolk) population study. Int J Epidemiol. 2004;33:189-98
10. Verhave JC, Hillege HL, Burgerhof JG, Navis G, de Zeeuw D, de Jong PE. Cardiovascular risk factors are differently associated with urinary albumin excretion in men and women. J Am Soc Nephrol. 2003;14:1330-5
11. Muiesan ML, Ambrosioni E, Costa FV. et al. Sex differences in hypertension-related renal and cardiovascular diseases in Italy: the I-DEMAND study. J Hypertens. 2012;30:2378-86
12. De Cosmo S, Minenna A, Ludovico O. et al. Increased urinary albumin excretion, insulin resistance, and related cardiovascular risk factors in patients with type 2 diabetes: evidence of a sex-specific association. Diabetes Care. 2005;28:910-5
13. Romundstad S, Holmen J, Hallan H, Kvenild K, Ellekjaer H. Microalbuminuria and all-cause mortality in treated hypertensive individuals: does sex matter? The Nord-Trondelag Health Study (HUNT), Norway. Circulation. 2003;108:2783-9
14. Karatas A, Hegner B, de Windt LJ. et al. Deoxycorticosterone acetate-salt mice exhibit blood pressure-independent sexual dimorphism. Hypertension. 2008;51:1177-83
15. Kim Y. The Korea National Health and Nutrition Examination Survey (KNHANES): current status and challenges. Epidemiol Health. 2014;36:e2014002
16. Grundy SM, Cleeman JI, Daniels SR. et al. Diagnosis and management of the metabolic syndrome: an American Heart Association/National Heart, Lung, and Blood Institute Scientific Statement. Circulation. 2005;112:2735-52
17. Levey AS, Bosch JP, Lewis JB, Greene T, Rogers N, Roth D. A more accurate method to estimate glomerular filtration rate from serum creatinine: a new prediction equation. Modification of Diet in Renal Disease Study Group. Ann Intern Med. 1999;130:461-70
18. Heymsfield SB, Smith R, Aulet M. et al. Appendicular skeletal muscle mass: measurement by dual-photon absorptiometry. Am J Clin Nutr. 1990;52:214-8
19. Janssen I, Heymsfield SB, Ross R. Low relative skeletal muscle mass (sarcopenia) in older persons is associated with functional impairment and physical disability. J Am Geriatr Soc. 2002;50:889-96
20. Kim BJ, Ahn SH, Kim HM, Lee SH, Koh JM. Low skeletal muscle mass associates with low femoral neck strength, especially in older Korean women: the Fourth Korea National Health and Nutrition Examination Survey (KNHANES IV). Osteoporos Int. 2015;26:737-47
21. Satchell SC, Tooke JE. What is the mechanism of microalbuminuria in diabetes: a role for the glomerular endothelium? Diabetologia. 2008;51:714-25
22. Lee KC, Lanyon LE. Mechanical loading influences bone mass through estrogen receptor alpha. Exerc Sport Sci Rev. 2004;32:64-8
23. Vermeulen A. Clinical review 24: Androgens in the aging male. J Clin Endocrinol Metab. 1991;73:221-4
24. Thomas T, Burguera B. Is leptin the link between fat and bone mass? J Bone Miner Res. 2002;17:1563-9
25. Mudali S, Dobs AS. Effects of testosterone on body composition of the aging male. Mech Ageing Dev. 2004;125:297-304
26. Waters DL, Yau CL, Montoya GD, Baumgartner RN. Serum Sex Hormones, IGF-1, and IGFBP3 Exert a Sexually Dimorphic Effect on Lean Body Mass in Aging. J Gerontol A Biol Sci Med Sci. 2003;58:648-52
27. Schaap LA, Pluijm SM, Smit JH. et al. The association of sex hormone levels with poor mobility, low muscle strength and incidence of falls among older men and women. Clin Endocrinol (Oxf). 2005;63:152-60
28. Herbert J. The age of dehydroepiandrosterone. Lancet. 1995;345:1193-4
29. Tchernof A, Labrie F. Dehydroepiandrosterone, obesity and cardiovascular disease risk: a review of human studies. Eur J Endocrinol. 2004;151:1-14
30. Salmon AH, Ferguson JK, Burford JL. et al. Loss of the endothelial glycocalyx links albuminuria and vascular dysfunction. J Am Soc Nephrol. 2012;23:1339-50
31. Tay L, Ding YY, Leung BP. et al. Sex-specific differences in risk factors for sarcopenia amongst community-dwelling older adults. Age (Dordr). 2015;37:121
32. Tu P, Bhasin S, Hruz PW. et al. Genetic disruption of myostatin reduces the development of proatherogenic dyslipidemia and atherogenic lesions in Ldlr null mice. Diabetes. 2009;58:1739-48
33. Chen F, Yang W, Weng J. et al. Albuminuria: Prevalence, associated risk factors and relationship with cardiovascular disease. J Diabetes Investig. 2014;5:464-71
34. Hovind P, Tarnow L, Rossing P. et al. Predictors for the development of microalbuminuria and macroalbuminuria in patients with type 1 diabetes: inception cohort study. Bmj. 2004;328:1105
35. Nam GE, Han K, Kim do H. et al. Relationship between dyslipidemia and albuminuria in prediabetic adults: the Korea National Health and Nutrition Examination Survey 2011-2012. Endocrine. 2015;48:557-65
36. Pucci G, Alcidi R, Tap L, Battista F, Mattace-Raso F, Schillaci G. Sex- and gender-related prevalence, cardiovascular risk and therapeutic approach in metabolic syndrome: A review of the literature. Pharmacol Res. 2017;120:34-42
37. Ha J, Jo K, Lim DJ. et al. Parathyroid hormone and vitamin D are associated with the risk of metabolic obesity in a middle-aged and older Korean population with preserved renal function: A cross-sectional study. PLoS One. 2017;12:e0175132
38. Palaniappan L, Carnethon M, Fortmann SP. Association between microalbuminuria and the metabolic syndrome: NHANES III. Am J Hypertens. 2003;16:952-8
39. Jensen JS, Feldt-Rasmussen B, Strandgaard S, Schroll M, Borch-Johnsen K. Arterial hypertension, microalbuminuria, and risk of ischemic heart disease. Hypertension. 2000;35:898-903
40. Timmerman KL, Volpi E. Endothelial function and the regulation of muscle protein anabolism in older adults. Nutr Metab Cardiovasc Dis. 2013;23(Suppl 1):S44-50
41. Sumukadas D, Struthers AD, McMurdo ME. Sarcopenia-a potential target for Angiotensin-converting enzyme inhibition? Gerontology. 2006;52:237-42
42. Heerspink HJ, Kropelin TF, Hoekman J, de Zeeuw D. Drug-Induced Reduction in Albuminuria Is Associated with Subsequent Renoprotection: A Meta-Analysis. J Am Soc Nephrol. 2015;26:2055-64
43. Anwar MA, Shalhoub J, Lim CS, Gohel MS, Davies AH. The effect of pressure-induced mechanical stretch on vascular wall differential gene expression. J Vasc Res. 2012;49:463-78
44. Perrin RM, Harper SJ, Bates DO. A role for the endothelial glycocalyx in regulating microvascular permeability in diabetes mellitus. Cell Biochem Biophys. 2007;49:65-72
45. Cruz-Jentoft AJ, Baeyens JP, Bauer JM. et al. Sarcopenia: European consensus on definition and diagnosis: Report of the European Working Group on Sarcopenia in Older People. Age Ageing. 2010;39:412-23
46. Fielding RA, Vellas B, Evans WJ. et al. Sarcopenia: an undiagnosed condition in older adults. Current consensus definition: prevalence, etiology, and consequences. International working group on sarcopenia. J Am Med Dir Assoc. 2011;12:249-56
47. Chen LK, Lee WJ, Peng LN, Liu LK, Arai H, Akishita M. Recent Advances in Sarcopenia Research in Asia: 2016 Update From the Asian Working Group for Sarcopenia. J Am Med Dir Assoc. 2016;17:767.e1-7
48. Park S, Ham JO, Lee BK. A positive association between stroke risk and sarcopenia in men aged >/= 50 years, but not women: results from the Korean National Health and Nutrition Examination Survey 2008-2010. J Nutr Health Aging. 2014;18:806-12
49. Kim JH, Cho JJ, Park YS. Relationship between sarcopenic obesity and cardiovascular disease risk as estimated by the Framingham risk score. J Korean Med Sci. 2015;30:264-71
50. Kim Y, Han BD, Han K. et al. Optimal cutoffs for low skeletal muscle mass related to cardiovascular risk in adults: The Korea National Health and Nutrition Examination Survey 2009-2010. Endocrine. 2015;50:424-33
51. Han E, Kim G, Hong N. et al. Association between dietary acid load and the risk of cardiovascular disease: nationwide surveys (KNHANES 2008-2011). Cardiovasc Diabetol. 2016;15:122
52. Kim TN, Lee EJ, Hong JW. et al. Relationship Between Sarcopenia and Albuminuria: The 2011 Korea National Health and Nutrition Examination Survey. Medicine (Baltimore). 2016;95:e2500
53. Ko BJ, Chang Y, Jung HS. et al. Relationship Between Low Relative Muscle Mass and Coronary Artery Calcification in Healthy Adults. Arterioscler Thromb Vasc Biol. 2016;36:1016-21
54. Chin SO, Rhee SY, Chon S. et al. Sarcopenia is independently associated with cardiovascular disease in older Korean adults: the Korea National Health and Nutrition Examination Survey (KNHANES) from 2009. PLoS One. 2013;8:e60119
55. Han K, Park YM, Kwon HS. et al. Sarcopenia as a determinant of blood pressure in older Koreans: findings from the Korea National Health and Nutrition Examination Surveys (KNHANES) 2008-2010. PLoS One. 2014;9:e86902
Author contact
![]() Corresponding author: Kwi Young Kang MD, PhD, Division of Rheumatology, Department of Internal Medicine, The Catholic University of Korea, Incheon St. Mary's Hospital, 56 Dongsu-ro, Bupyeong-gu, Incheon, 21431, South Korea. E-mail: kykangac.kr
Corresponding author: Kwi Young Kang MD, PhD, Division of Rheumatology, Department of Internal Medicine, The Catholic University of Korea, Incheon St. Mary's Hospital, 56 Dongsu-ro, Bupyeong-gu, Incheon, 21431, South Korea. E-mail: kykangac.kr
Citation styles
APA
Yoon, H.E., Nam, Y., Kang, E., Hwang, H.S., Shin, S.J., Hong, Y.S., Kang, K.Y. (2017). Gender-Specific Associations between Low Skeletal Muscle Mass and Albuminuria in the Middle-Aged and Elderly Population. International Journal of Medical Sciences, 14(11), 1054-1064. https://doi.org/10.7150/ijms.20286.
ACS
Yoon, H.E.; Nam, Y.; Kang, E.; Hwang, H.S.; Shin, S.J.; Hong, Y.S.; Kang, K.Y. Gender-Specific Associations between Low Skeletal Muscle Mass and Albuminuria in the Middle-Aged and Elderly Population. Int. J. Med. Sci. 2017, 14 (11), 1054-1064. DOI: 10.7150/ijms.20286.
NLM
Yoon HE, Nam Y, Kang E, Hwang HS, Shin SJ, Hong YS, Kang KY. Gender-Specific Associations between Low Skeletal Muscle Mass and Albuminuria in the Middle-Aged and Elderly Population. Int J Med Sci 2017; 14(11):1054-1064. doi:10.7150/ijms.20286. https://www.medsci.org/v14p1054.htm
CSE
Yoon HE, Nam Y, Kang E, Hwang HS, Shin SJ, Hong YS, Kang KY. 2017. Gender-Specific Associations between Low Skeletal Muscle Mass and Albuminuria in the Middle-Aged and Elderly Population. Int J Med Sci. 14(11):1054-1064.
This is an open access article distributed under the terms of the Creative Commons Attribution (CC BY-NC) license (https://creativecommons.org/licenses/by-nc/4.0/). See http://ivyspring.com/terms for full terms and conditions.