International Journal of Medical Sciences 3.2
Impact Factor
ISSN: 1449-1907
Impact Factor
ISSN: 1449-1907
- Issue 4; 2026
- Issue 3; 2026
- Issue 2; 2026
- Issue 1; 2026
- Issue 16; 2025
- Volume 23; 2026
- Past Issues
- Editorial Board
- Cover Images
- Index & Coverage
- Cover Suggestion
- Special Issues
Top
Introduction
Material and Methods
Results
Discussion
Conclusion
Abbreviations
Acknowledgements
References
Introduction
Material and Methods
Results
Discussion
Conclusion
Abbreviations
Acknowledgements
References

 Global reach, higher impact
Int J Med Sci 2017; 14(11):1040-1048. doi:10.7150/ijms.20388 This issue Cite
Research Paper
Sports and HDL-Quality Reflected By Serum Amyloid A and Surfactant Protein B
Michael Sponder1 ![]() , Chantal Kopecky2, Ioana-Alexandra Campean1, Michael Emich3, Monika Fritzer-Szekeres4, Brigitte Litschauer5, Senta Graf1, Marcus D. Säemann2, Jeanette Strametz-Juranek1
, Chantal Kopecky2, Ioana-Alexandra Campean1, Michael Emich3, Monika Fritzer-Szekeres4, Brigitte Litschauer5, Senta Graf1, Marcus D. Säemann2, Jeanette Strametz-Juranek1
1. Medical University of Vienna, Department of Cardiology, Währinger Gürtel 18-20, 1090 Vienna, Austria;
2. Medical University of Vienna, Department of Nephrology and Dialysis, Währinger Gürtel 18-20, 1090 Vienna, Austria;
3. Austrian Federal Ministry of Defence and Sports, Austrian Armed Forces, Brünnerstraße 238, 1210 Vienna, Austria;
4. Medical University of Vienna, Department of Medical-Chemical Laboratory Analysis, Währinger Gürtel 18-20, 1090 Vienna, Austria;
5. Medical University of Vienna, Department of Pharmacology, Währinger Gürtel 18-20, 1090 Vienna, Austria.
Received 2017-4-3; Accepted 2017-7-24; Published 2017-9-3
Citation:
Sponder M, Kopecky C, Campean IA, Emich M, Fritzer-Szekeres M, Litschauer B, Graf S, Säemann MD, Strametz-Juranek J. Sports and HDL-Quality Reflected By Serum Amyloid A and Surfactant Protein B. Int J Med Sci 2017; 14(11):1040-1048. doi:10.7150/ijms.20388. https://www.medsci.org/v14p1040.htm
Other stylesAbstract
Background: The aim of this prospective study was to investigate the influence of long-term physical activity on HDL quality, reflected by serum amyloid A (SAA) and surfactant protein B (SPB).
Methods and results: 109 healthy subjects were recruited, 98 completed the study. Participants perform within the calculated training pulse for 8 months. The performance gain was measured/quantified by bicycle stress tests at the beginning and end of the observation period. SAA and SPB were measured at baseline and after 4 and 8 months by ELISA. In contrary to HDL-quantity, there was no sports-induced change in SAA or SPB observable. However, significant predictors for SPB-levels were smoking status, BMI and weekly alcohol consumption and for SAA weekly alcohol consumption together with sex and hsCRP-levels.
Conclusions: Long-term physical activity increases HDL-quantity but has no impact on HDL-quality reflected by SAA and SPB. Smoking is associated with higher SPB-levels and the weekly alcohol intake is associated with both higher SAA and SPB-levels suggesting a damaging effect of smoking and drinking alcohol on the HDL-quality. We assume that HDL-quality is at least as important as HDL-quantity when investigating the role of HDL in (cardiovascular) disease and should receive attention in further studies dealing with HDL.
Keywords: high-density lipoprotein, serum amyloid A, surfactant protein B, physical activity, HDL-quality.
Introduction
Physical activity has emerged as essential interventional therapeutic strategy against cardiovascular disease (CVD) due to its impact on several metabolic systems (e.g. lipid and glucose metabolism [1]) and its influence on angiogenesis [2], inflammation [3] and atherosclerosis/calcification [4]. Total cholesterol (TC), low-density lipoprotein-cholesterol (LDL-C), high-density lipoprotein-cholesterol (HDL-C) and triglycerides (TG) represent the most important targets of the lipid metabolism for lifestyle and/or drug therapy-based treatment of cardiovascular disease.
To date, favourable effects of physical activity and exercise on lipid and lipoprotein profiles have been suggested [5]. Apart from quantitative changes of serum lipids, a positive impact of exercise on HDL particle maturation, composition and functionality has been reported [6]. In view of the well-established role of dyslipidemia in the pathogenesis of CVD, there has been substantial interest to elucidate lipid and lipoprotein metabolism and mechanisms related to the beneficial effects of exercise on CV health [7]. Metabolic adaptations affecting lipid levels and homeostasis, induced by life-style change composed of physical activity, diet and weight control can have substantial impact on the management of CVD.
Despite the long known inverse relationship between HDL-C levels and cardiovascular risk in the general population [8], there is accumulating evidence that the quality, rather than the quantity, of HDL plays a central role in CVD risk protection [9, 10]. In this regard, HDL quality is evolving as a promising diagnostic marker for cardiovascular outcome [11] and the protein composition of HDL plays a key role in mediating its cardioprotective functions [12]. The HDL proteome is profoundly altered in acute phase or chronic conditions [13] and, importantly, is associated with clinical outcomes [14]. Specifically, accumulation of serum amyloid A (SAA) or surfactant protein B (SPB) occurs in different patient populations at high cardiovascular risk [15, 16]. SAA is a major acute-phase protein and its levels rise rapidly during inflammatory processes. Increased incorporation of SAA into HDL was shown to be a marker of on-going systemic inflammation and to be directly associated with dysfunctional HDL properties [12]. SPB is crucial to lung function by maintaining surface tension and stability on the alveolar-capillary membranes. SPB flowing into the circulation caused by membrane leakage has been reported to occur in several diseases and plasma SPB has been identified as biomarker in chronic heart failure [17, 18]. Importantly, we have shown previously that high amounts of HDL-bound SAA and SPB contribute to cardiovascular events and mortality in a high risk population [19].
It is well known that physical activity increases HDL-quantity however there is no data available concerning the influence of sports on HDL-quality. Thus, determining the effect of physical activity on SAA and SPB levels as well as the identification of other factors that might have an impact on SAA and SPB was the aim of the present prospective study.
Material and Methods
In total 109 subjects were recruited. Inclusion criteria were: age between 30-65 years and physical ability to perform endurance exercise. Exclusion criteria were: age <30 or >65 years, no ability to perform endurance exercise, current oncologic or infectious disease (anamnestic or increased inflammation parameters at baseline). 11 subjects did not complete the study for different reasons (accidents, loss of motivation, etc.). Finally, 98 subjects completed the study. The study population therefore consisted of 38 female and 60 male subjects aged 30-65 years with at least one classic cardiovascular risk factor: overweight (BMI >25.0 kg/m2), hypertension (SBP > 140 +/- DBP > 85 mmHg at rest / antihypertensive medication), hyper/dyslipidemia (anamnestic statin therapy), diabetes mellitus (HbA1c > 6.5 rel% / DM medication), current smoking, known CHD (anamnestic MI, PCI, CABG, stroke) and positive family anamnesis for MI/CVD/stroke of mother and/or father. The anamnestic weekly alcohol intake was measured in units: 1 unit corresponds to 0.33 l beer, 0.125 l red/white wine or 0.02 l spirits.
The study was carried out in adherence to the Declaration of Helsinki and its later amendments as well as to the ethical standards in sports and exercise research [20]. The protocol has been approved by the Ethical Commission of the Medical University of Vienna (EC-number: 1830/2013) and informed consent was obtained from all subjects before inclusion.
Measurement of anthropometric data and bicycle stress test (ergometry)
After detailed anamnesis and physical examination including the measurement of height, weight, body water, body muscle mass and body fat (with a diagnostic scale, Beurer BG 16, Beurer GmbH, Ulm, Germany), subjects had to perform a bicycle stress test (ergometry) at the beginning of the study to define their performance level and to calculate their individual training pulse/target heart rate (using the Karvonen formula with an intensity level of 65-75 % for moderate and 76-93 % for vigorous intensity). Subjects were let to decide the kind of physical activity/sports, however, they were asked to perform at least 75 minutes/week of vigorous or 150 minutes/week of moderate intensity endurance training (or a mixture; strength training was allowed but not mandatory) within the calculated training pulse. A second ergometry was performed at the end of the study (after 8 months) to prove and also quantify exactly and objectively the change/gain in performance. Therefore, we relinquished the leading of a training protocol. Bicycle stress tests were always ECG-monitored and performed with the same system (Ergometer eBike comfort, GE Medical Systems, Freiburg, Germany) starting with 25 watts and increasing every 2 minutes by 25 watts (according to the protocol of the Austrian Society of Cardiology which is equal to the guidelines of the European Society of Cardiology). Blood pressure and heart rate were taken every 2 minutes. Subjects were told to cycle with 50-70 revolutions/min until exhaustion occurred. The target performance was calculated using body surface (calculated according to DuBois formula: body surface (m2) = 0.007184 x height [cm] 0.725 x weight [kg] 0.425 ) [21], sex and age. An individual target performance of 100 % represents the performance of an untrained collective. We estimate that a performance gain of at least 8% is necessary to manifest measurable and clinically relevant changes concerning the lipid profile. Therefore, the study population was divided into 4 groups according to the baseline performance and to the performance gain over the observation period:
- group 1 consisted of participants with a performance ≤99 % at baseline and a performance gain ≤ 7.9 %;
- group 2 consisted of participants with a performance ≤99 % at baseline and a performance gain > 7.9 %;
- group 3 consisted of participants with a performance >100 % at baseline and a performance gain ≤ 7.9 %
- and group 4 consisted of participants with a performance >100 % at baseline and a performance gain > 7.9 %.
Routine laboratory analysis
Blood samples were drawn in a not starving state. Blood samples for the determination of SAA and SPB were taken at baseline, after 4 months and after 8 months. All other samples were taken at baseline and every 2 months. All blood samples were taken after 10 minutes of still lying from an arm vein with a tube/adapter system. Samples for determination of routine laboratory parameters were analysed immediately after drawing. Analysis was performed according to the manufacturer's instructions.
Quantification of HDL proteins
Sample preparation and quantification of HDL proteins were performed as described previously [19]. Briefly, apolipoprotein B (apoB)-depleted serum was prepared from thawed serum samples by precipitation of apoB-containing lipoprotein fractions with 20 % polyethyleneglycol (Sigma-Aldrich, USA) in 200 mM glycine buffer, pH 7.4, diluted at 1:2.5. After incubation for 20 min, samples were centrifuged at 16.000xg for 30 min. The supernatant (apoB-depleted serum) was collected and stored at -80°C until further use. HDL-bound SAA and SPB were measured according to a self-developed ELISA protocol [19]. Binding of HDL directly from apoB-depleted serum samples onto ELISA plates was accomplished using a coating antibody against HDL (Sigma-Aldrich, USA) at 1µg/ml. HDL samples (10µg/ml) with defined high and low amounts of SAA and SPB were used as positive and negative controls on every plate. Serum samples were added in triplicates (diluted at 1:50) for 90 min, followed by 60 min incubation with primary antibodies against SAA and SPB (Santa Cruz Biotechnologies, USA) and respective secondary biotin-conjugated antibodies (Southern Biotech, USA) for further 60 min. After addition of streptavidin-peroxidase (Roche, Switzerland) to the plate for 30 min, protein levels were detected with tetramethylbenzidine substrate (Sigma-Aldrich, USA) and optical density was measured at 450 nm. Data is expressed as values normalized to the ratio of positive to negative control. The intra-assay CV for SAA and SPB were 6.2% and 4.7%, respectively. The interassay CV was 9.3% for SAA and 14.5% for SPB.
Statistical analysis
Statistical analysis was accomplished using SPSS 20.0. Continuous and normally distributed data is described by mean ± standard deviation (SD). Non-normally distributed data is described by median/25th quartile/75th quartile. Single correlations involving only two normally distributed data were calculated using Pearson Correlation, single correlations involving two non-parametric data and/or ordinal data were calculated using Spearman's rho analysis. Backwards multiple linear regression analysis was performed to investigate the association of co-variables such as age, BMI, packyears, body fat and apolipoproteins with baseline SAA and SPB. To further investigate the correlation of baseline SPB with the smoking status we added a Bonferoni adjusted post hoc analysis.
As it was expected that not all of the subjects would reach an adequate performance gain during the observation period we defined in the forefront a minimum threshold of 8 % performance gain as significant and divided the study population into the 4 mentioned groups. To investigate the difference between baseline and 8 month levels we used a parametric test for 2 related samples (paired sample t-test). To investigate trends over the observation period of 8 months we used the Friedman test. All tests were performed in accordance with two-sided testing and p values ≤0.05 were considered significant.
Results
The study population consisted of 38 female and 60 male subjects. Baseline anamnestic, anthropometric and laboratory parameters for the 4 groups are shown in Table 1. As mentioned in the material and methods section the classification of the groups is based on the baseline performance and the performance gain. Although dyslipidemia was very prevalent (29 of 98 participants; 29.6%), only 5 participants were under statin therapy.
Table 1
Baseline risk factor profile, anthropometric and routine laboratory parameters
| Initially non-sportive (n=42) | Initially sportive (n=56) | |||||
|---|---|---|---|---|---|---|
| Group 1 (n=21) | Group 2 (n=21) | p-value | Group 3 (n=27) | Group 4 (n=29) | p-value | |
| Hypertension | n=7/35% | n=10/48% | n=8/29% | n=7/24% | ||
| Dyslipidaemia | n=5/25% | n=6/29% | n=12/43% | n=6/21% | ||
| Diabetes mellitus | n=2/10% | n=0/0% | n=1/4% | n=1/3% | ||
| Overweight | n=15/75% | n=13/62% | n=18/64% | n=18/62% | ||
| Ex-Smoking | n=9/45% | n=7/33% | n=16/57% | n=10/35% | ||
| Smoking | n=7/35% | n=6/29% | n=3/11% | n=4/14% | ||
| Known CHD/stroke | n=3/15% | n=3/14% | n=2/7% | n=8/28% | ||
| Family anamnesis | n=10/50% | n=10/48% | n=13/46% | n=11/38% | ||
| Alcohol (units/week) | 1.3±1.7 | 3.4±3.6 | 0.030 | 3.0±3.4 | 3.5±4.9 | 0.677 |
| Age (years) | 49.2±7.3 | 48.7±7.9 | 0.839 | 49.6±6.9 | 49.5±5.6 | 0.907 |
| BMI (kg/m2) | 28.4±4.2 | 28.2±5.7 | 0.897 | 26.9±3.8 | 27.0±3.0 | 0.958 |
| Body water (%) | 48.6±3.5 | 51.3±5.1 | 0.068 | 53.4±6.2 | 54.7±6.1 | 0.405 |
| Body fat (%) | 33.9±4.8 | 30.4±6.9 | 0.066 | 29.5±12.9 | 25.6±8.3 | 0.182 |
| Body muscle (%) | 32.2±3.3 | 34.8±4.1 | 0.030 | 34.4±4.0 | 36.7±3.7 | 0.030 |
| SBP (mmHg) | 140±15 | 145±14 | 0.137 | 140±16 | 144±13 | 0.580 |
| DBP (mmHg) | 85±8 | 85±8 | 0.685 | 83±13 | 85±7 | 0.182 |
| Performance gain (%) | 1.6±5.0 | 15.8±6.0 | <0.001 | -0.6±5.9 | 14.5±4.3 | <0.001 |
| Erythrocytes (T/l) | 4.7±0.4 | 4.8±0.5 | 0.407 | 4.5±0.4 | 4.8±0.4 | 0.004 |
| Haemoglobin (g/dl) | 13.9±1.6 | 14.1±1.5 | 0.635 | 13.7±1.1 | 14.4±1.1 | 0.023 |
| Haematocrit (%) | 39.8±4.0 | 40.4±3.4 | 0.613 | 39.6±2.9 | 41.1±2.9 | 0.062 |
| Thrombocytes (G/l) | 248±67 | 238±53 | 0.584 | 255±55 | 244±38 | 0.408 |
| Leukocytes (G/l) | 7.7±1.9 | 6.2±1.4 | 0.005 | 6.5±1.7 | 6.1±1.1 | 0.361 |
| Na (mmol/l) | 141±2 | 141±1 | 1.000 | 141±2 | 142±2 | 0.215 |
| K (mmol/l) | 4.1±0.3 | 4.6±0.2 | 0.268 | 4.3±0.2 | 4.2±0.3 | 0.534 |
| Cl (mmol/l) | 101±2 | 101±2 | 0.502 | 101±2 | 101±2 | 0.928 |
| Ca (mmol/l) | 2.3±0.1 | 2.3±0.1 | 0.386 | 2.3±0.1 | 2.3±0.1 | 0.432 |
| Phosphate (mmol/l) | 1.1±0.2 | 1.0±0.1 | 0.296 | 1.1±0.2 | 1.1±0.1 | 0.346 |
| Mg (mmol/l) | 0.83±0.05 | 0.85±0.06 | 0.468 | 0.83±0.07 | 0.85±0.05 | 0.311 |
| Creatinine (mg/dl) | 0.83±0.17 | 0.86±0.12 | 0.531 | 0.92±0.18 | 0.94±0.16 | 0.517 |
| BUN (mg/dl) | 17.3±18.8 | 18.1±24.5 | 0.901 | 14.0±3.8 | 14.2±3.8 | 0.846 |
| Uric acid (md/dl) | 5.3±2.0 | 5.2±1.2 | 0.892 | 5.2±1.5 | 5.3±1.1 | 0.605 |
| Lipasis (U/l) | 32.4±10.7 | 38.4±15.3 | 0.150 | 42.4±19.3 | 44.3±18.5 | 0.697 |
| Cholinesterasis (kU/l) | 8.2±1.4 | 8.5±1.8 | 0.491 | 7.6±1.7 | 8.7±1.6 | 0.015 |
| Alcalic Phosphat. (U/l) | 64±18 | 73±73 | 0.580 | 56±15 | 60±14 | 0.335 |
| GOT (U/l) | 26±8 | 23±9 | 0.300 | 26±6 | 25±6 | 0.472 |
| GPT (U/l) | 27±14 | 30±16 | 0.589 | 27±9 | 24±9 | 0.377 |
| Gamma-GT (U/l) | 22±14 | 46±85 | 0.215 | 22±13 | 27±19 | 0.198 |
| LDH (U/l) | 179±30 | 172±24 | 0.395 | 174±26 | 170±22 | 0.580 |
Baseline risk factor profile, anthropometric and routine laboratory parameters of the 4 groups. CHD: coronary heart disease; BMI: body mass index; SBP: systolic blood pressure; DBP: diastolic blood pressure; BUN: blood urea nitrogen; GOT: glutamat-oxalacetat-transaminasis; GPT: glutamat-pyruvat-transaminasis;
Baseline parameters (sex, smoking status, weekly alcohol intake, apolipoproteins, Il-6, hsCRP) and SAA/SPB-levels
At baseline, when analysing the entire cohort, female participants had significantly higher HDL-levels (68±20 vs. 53±13 mg/dl; p<0.001) and SAA-levels compared to men (0.12±0.06 vs. 0.09±0.06; p=0.024) but there was no sex-specific difference in SPB-levels (0.13±0.07 vs. 0.14±0.09; p=0.658).
Individuals with a basic performance >100 % (group 3+4) showed higher HDL-levels compared to initially non-sportive individuals from group 1+2 with a basic performance ≤99 % but without statistically significant difference (60.91±14.06 vs. 55.24±21.01 mg/dl; p=0.115). Concerning baseline SAA, SPB, ApoA1 and ApoB levels there was no statistically significant difference between group 3+4 and group 1+2 too.
Figure 1 shows SAA and SPB-levels dependent on the smoking status. Smokers showed only minimally higher levels of SAA compared to non- and never-smokers while SPB-levels were significantly higher in smokers (0.21±0.11) compared to ex-smokers (0.10±0.06 and 0.13±0.05) and never-smokers (0.11±0.05) (ANOVA F=12.7; p<0.001).
We next determined clinical predictors for the HDL proteins SAA and SPB (Table 2). Significant predictors for SPB-levels were smoking status, BMI and weekly alcohol consumption (F=9.4; p<0.001), whereas age, sex, body fat, apolipoprotein, hsCRP and Il-6-levels were not significant.
Weekly alcohol consumption also significantly predicted SAA-levels together with sex and hsCRP-levels (F= 13.6 p<0.001) whereas age, sex, body fat, apolipoprotein and Il-6-levels were not significant.
Figure 1
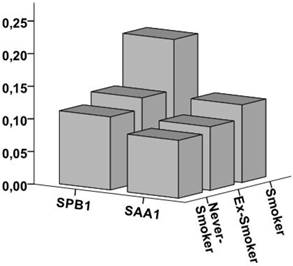
SPB and SAA-levels dependent on the smoking status Figure 1 shows the SPB and SAA-levels dependent on the smoking status. SPB-levels were significantly higher in smokers (0.21±0.11) compared to ex-smokers (0.10±0.06 and 0.13±0.05) and never-smokers (0.11±0.05) while the difference in SAA-levels was minimal.
Influence of physical activity on HDL-cholesterol, apolipoproteins, SAA and SPB
Levels of HDL-cholesterol, apolipoprotein (Apo) A1, ApoB, SAA and SPB at the different points of measurement are shown in Table 3. Concerning HDL-cholesterol, group 2 showed a significant increase from 52±13 to 57±16 mg/dl (≙ 9.6 %; p=0.004); the increase in group 1 (≙ 1.7 %; p=0.710), group 3 (≙ 6.6 %; p=0.064) and group 4 (≙ 3.3 %; p=0.370) was not significant.
Similar results were observed for ApoA1: group 2 showed a significant increase from 146±24 to 160±36 mg/dl (≙ 11.0 %; p=0.002), group 1 from 157±42 to 162±32 mg/dl (≙ 3.2 %; p=0.154), group 3 from 159±18 to 170±23 mg/dl (≙ 6.9 %; p=0.025) and group 4 from 157±22 to 164±24 mg/dl (≙ 4.5 %; p=0.040).
Table 2
Backwards multiple linear regression analysis
| SPB | Regression coefficient Bb | Standard error | β | T | significance |
|---|---|---|---|---|---|
| (Constant) | 0.189 | 0.051 | 3.702 | <0.001 | |
| Smoking | 0.041 | 0.010 | 0.393 | 4.222 | <0.001 |
| BMI | -0.003 | 0.002 | -0.180 | -1.925 | 0.057 |
| Alcohol cons. | 0.004 | 0.002 | 0.179 | 1.904 | 0.060 |
| F=9.4; p<0.001 | |||||
| SAA | |||||
| (Constant) | 0.123 | 0.019 | 6.499 | <0.001 | |
| Sex | -0.026 | 0.011 | -0.209 | -2.298 | 0.024 |
| hsCRP | 0.143 | 0.026 | 0.493 | 5.555 | <0.001 |
| Alcohol cons. | -0.003 | 0.001 | -0.173 | -1.889 | 0.062 |
| F= 13.6; p<0.001 |
Table 2 shows the results of the backwards multiple linear regression analysis for SPB and SAA. Sex, BMI, age, body fat, apolipoprotein A1, apolipoprotein B, weekly alcohol consumption, hsCRP and Il-6 were inserted as independent variables.
Table 3
Influence of physical activity on the lipid profile
| Initially non-sportive (n=42) | Initially sportive (n=56) | ||||
|---|---|---|---|---|---|
| Group 1 (n=21) | Group 2 (n=21) | Group 3 (n=27) | Group 4 (n=29) | ||
| HDL baseline | 59±27 | 52±13 | 61±12 | 61±16 | |
| HDL 2 months | 59±28 | 55±15 | 67±15 | 63±18 | |
| HDL4 months | 64±28 | 54±17 | 65±12 | 64±17 | |
| HDL 6 months | 63±24 | 53±14 | 66±14 | 61±15 | |
| HDL 8 months | 60±23 | 57±16 | 65±14 | 63±18 | |
| p-value | 0.710 | 0.004 | 0.064 | 0.370 | |
| SAA baseline | 0.11±0.05 | 0.11±0.07 | 0.10±0.07 | 0.08±0.05 | |
| SAA 4 months | 0.12±0.07 | 0.10±0.06 | 0.10±0.06 | 0.08±0.06 | |
| SAA 8 months | 0.11±0.06 | 0.10±0.06 | 0.10±0.06 | 0.08±0.05 | |
| p-value | 0.769 | 0.484 | 0.839 | 0.297 | |
| SPB baseline | 0.15±0.08 | 0.13±0.09 | 0.14±0.06 | 0.13±0.08 | |
| SPB 4 months | 0.16±0.08 | 0.13±0.08 | 0.15±0.07 | 0.14±0.08 | |
| SPB 8months | 0.16±0.08 | 0.12±0.07 | 0.15±0.07 | 0.14±0.08 | |
| p-value | 0.454 | 0.209 | 0.588 | 0.173 | |
| ApoA1 baseline | 157±42 | 146±24 | 159±18 | 157±22 | |
| ApoA1 2 months | 161±41 | 155±31 | 171±23 | 164±28 | |
| ApoA1 4 months | 165±37 | 161±40 | 170±19 | 164±28 | |
| ApoA1 6 months | 170±37 | 155±36 | 171±24 | 161±23 | |
| ApoA1 8 months | 162±32 | 160±36 | 170±23 | 164±24 | |
| p-value | 0.156 | 0.002 | 0.025 | 0.040 | |
| ApoB baseline | 103±29 | 110±22 | 96±19 | 102±29 | |
| ApoB 2 months | 111±36 | 108±25 | 104±26 | 102±24 | |
| ApoB 4 months | 102±31 | 109±18 | 103±21 | 99±26 | |
| ApoB 6 months | 106±39 | 104±23 | 100±21 | 95±24 | |
| ApoB 8 months | 104±32 | 103±24 | 97±19 | 97±24 | |
| p-value | 0.910 | 0.101 | 0.674 | 0.096 | |
Table 3 shows HDL, SAA, SPB, ApoA1 and ApoB levels at the different points of measurement and p-values of the significance between the first and last point of measurement. HDL: high-density lipoprotein; SAA: serum amyloid A; SPB: surfactant protein B; Apo: apolipoprotein
Figure 2
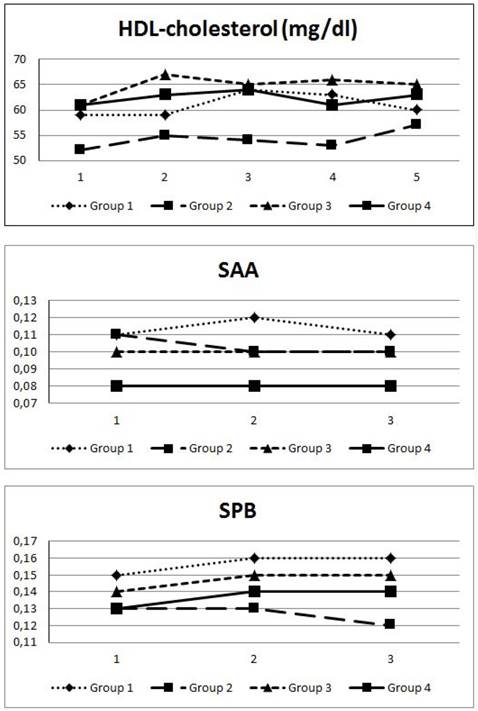
Progression of HDL, SAA and SPB levels over 8 months Figure 2 shows the progression (measurement every 2 months) of HDL (mg/dl), SAA and SPB-levels over the observation period of 8 months in the 4 groups. Group 2 showed a significant increase in HDL-levels from 52±13 to 57±16 mg/dl. There was no significant change in SAA or SPB-levels in any of the groups.
Figure 2 demonstrates the course of HDL-C, SAA and SPB during the study period according to the groups. HDL-C only increased significantly in group 2 which had low baseline HDL-levels compared to group 4. However, we found no considerable changes in SAA in group 2 and 3. Intriguingly, SAA levels in group 1 increased after 3 months, but declined to baseline values after 8 months, whereas group 2 displayed decreased SAA after the first 4 months of intervention. In contrary, SPB levels increased mildly after 4 months with no further increase at the end of the study period.
Concerning ApoB, SAA and SPB, paired sample t-test and Friedman test showed no significant change in any of the groups and no significant difference between the values at the beginning and the end of the study.
Discussion
In addition to hypertension, smoking, adipositas/overweight, diabetes mellitus and physical inactivity, hyper- and/or dyslipidaemia have been recognized for decades to be one of the most important cardiovascular risk factors. The term dyslipidaemia covers a spectrum of numerous lipid abnormalities however, research and prevention are mostly focused on changes in plasma lipoprotein function and/or levels. Due to their strong relation to CVD and outcome total cholesterol (TC), low-density lipoprotein (LDL), high-density lipoprotein (HDL) and triglycerides (TG) have evolved as key players regarding the possibility of modification by lifestyle and/or drug therapy. Although several prospective studies suggested apolipoprotein B (ApoB), the major apolipoprotein of very low-density lipoprotein (VLDL), intermediate-density lipoprotein (IDL) and LDL, to be equal to LDL-C in risk prediction [22], it constitutes only a minor part in CVD risk calculation similar to Apo A1, the major protein component of HDL.
Although we could show that long-term physical activity leads to a significant increase in HDL-quantity in previously non-sportive individuals, we did not observe an influence on SAA and SPB-levels reflecting HDL-quality. The role of dietary CVD-prevention has been extensively investigated and reviewed. Numerous studies showed a strong beneficial effect of reduction of saturated fat [23] and trans fat [24] on TC, LDL-C and HDL-C levels. Concerning sports similar effects were observed. It was shown that increased habitual physical activity leads to a significant increase in HDL [25] and PCSK9 levels [26] in addition to a decrease of TC and LDL-C [27] and also TG levels [25] underlining the protective effect of physical activity on the lipid profile and CVD risk. It was further shown that an energy expenditure of about 1500-2200 kcal/week (corresponding e.g. 25-30 km of brisk walking) may increase HDL levels by 3-6 mg/dl.
The vasoprotective effect of HDL is mostly mediated by its stimulating effect on endothelial nitric oxide-production, thereby reducing the production of endothelial reactive oxygen species (ROS). HDL carries several protein components which are crucial for its intrinsic functional properties such as the apolipoproteins ApoA1 and ApoB or paraoxonase-1 [28, 29]. Furthermore, HDL also presents a carrier of serum amyloid A (SAA), however, SAA is an acute-phase protein and able to replace Apo A1 and consequently to impair HDL-mediated anti-oxidative effects [30], reverse cholesterol transport [31] and anti-inflammatory properties [12]. For example, Dullaart et al. [32] could show that the anti-oxidative function of HDL is inversely correlated with circulating SAA levels in patients with metabolic syndrome. This indicates that higher SAA levels detain HDL in exerting its full anti-oxidative activity. In this regards, we found elevated SAA levels in the female participants and smokers in addition to a positive correlation of SAA with hsCRP, a marker of a permanently prevalent chronic inflammation. Females are known to have higher HDL-levels compared to men however, the association of female sex with higher SAA-levels in our study population might be a sign of impairment of the beneficial effect of HDL in women.
The association of smoking and SPB-levels was a further interesting finding. Increased levels of circulating SPB have been reported in smoke exposure due to alveolar inflammation and increased lung permeability [33]. In our study, smokers showed 91 % higher SPB levels compared to never-smokers and 62 % higher levels compared to ex-smokers indicating that smoking is associated with an impairment of the molecular composition of HDL. The authors of the “Dallas Heart Study” [17] even suggested SPB to be a useful marker of the dose-dependent vascular effects of smoking. It is well known that smoking has a damaging effect on the vascular endothelium however, we speculate that this impairing impact might partly be mediated by affecting HDL composition.
In addition, we observed an association between the weekly alcohol intake and both SAA and SPB. The influence of alcohol intake on the lipid profile has been discussed for centuries but to our knowledge, SAA and SPB have never been in the spotlight of this discussion. Light to moderate alcohol intake has been shown to ameliorate the quantitative lipid profile, in particular by increasing HDL and reducing LDL-levels, however, as mentioned above, not only HDL quantity but also HDL quality seems to be important for the beneficial effect of HDL on the cardiovascular outcome. We could demonstrate that the weekly alcohol intake was a significant predictor for both SAA and SPB levels. Schwartz et al. could show that adding dalcetrapib, a cholesterylester transfer protein inhibitor, to the standard therapy after an acute coronary syndrome raised HDL and apolipoprotein A1-levels but did not significantly alter the major cardiovascular outcome [34]. Voight et al. even speculate that lifestyle interventions and pharmacologic treatment raising plasma HDL levels cannot be assumed to lead to a corresponding benefit with respect to risk of myocardial infarction [35]. In this light, our results relativize the beneficial effect of alcohol intake on the lipids. Light and moderate alcohol consumption might increase HDL levels but this protective effect might be mitigated by impairing HDL-quality.
Conclusion
Long-term physical activity increases ApoA1 levels up to 11 % and HDL-quantity up to 10 % but seems to have no influence on its composition reflected by SAA and SPB as markers of HDL-quality. Smoking is associated with higher SPB-levels and the weekly alcohol intake is associated with both higher SAA and SPB-levels suggesting a damaging effect of drinking alcohol on the HDL-quality. It seems reasonable to assume that HDL-quality is at least as important as HDL-quantity when investigating the role of HDL in (cardiovascular) disease. Therefore, HDl-quality should receive much more attention in further studies dealing with HDL.
Limitations
First, although the number of participants is relatively high for a prospective study investigating the role of long-term physical activity on specific laboratory parameters, there might have been uncontrolled influencing factors. Second, the assumptions dealing with the associations between sex/smoking status/alcohol intake/Il-6/hsCRP and SAA/SPB were assessed only at inclusion time and thus are non-prospective data. Third, due to the low number of female participants it was not possible to perform a sex-specific analysis.
Abbreviations
CABG: coronary artery bypass graft
CVD: cardiovascular disease
DBP: diastolic blood pressure
FT: Friedman test
HbA1c: hemoglobin A1c, glycated hemoglobin
HR: heart rate
K: potassium
MI: myocardial infarction
Na: sodium
NO: nitric oxygen
PCI: percutaneous coronary intervention
PCSK9: proprotein convertase subtilisin/kexin type 9
ROS: reactive oxygen species
SAA: serum amyloid A
SPB: surfactant protein B
SBP: systolic blood pressure
TC: total cholesterol
TG: triglycerides
Acknowledgements
We give special thanks to Heidi Kieweg, Alexander Deli, Maximilian Eisserer, Hans Riedmann, Andreas Rupp, Inkar Asanova and Klaus Koska for their support.
Funding
The study was funded by means of the Medical University of Vienna and the Austrian Federal Ministry of Defence and Sports.
Author contribution
Michael Sponder: study design, clinical investigation, performing bicycle stress tests/follow-up, statistical analysis, manuscript preparation
Chantal Kopecky: laboratory analysis, manuscript preparation
Ioana-Alexandra Campean: clinical investigation, performing bicycle stress tests/follow-up
Michael Emich: study design
Monika Fritzer-Szekeres: laboratory analysis
Brigitte Litschauer: statistical analysis
Senta Graf: clinical investigation, performing bicycle stress tests/follow-up
Marcus D. Säemann: laboratory analysis, manuscript preparation
Jeanette Strametz-Juranek: study design, manuscript preparation
Registration
Clinical trials registration: NCT02097199
Competing Interests
The authors have declared that no competing interest exists.
References
1. Sponder M, Dangl D, Kampf S, Fritzer-Szekeres M, Strametz-Juranek J. Exercise increases serum endostatin levels in female and male patients with diabetes and controls. Cardiovasc Diabetol. 2014;13:6
2. Sponder M, Sepiol K, Lankisch S, Priglinger M, Kampf S, Litschauer B. et al. Endostatin and physical exercise in young female and male athletes and controls. Int J Sports Med. 2014;35:1138-42
3. Sponder M, Campean IA, Emich M, Fritzer-Szekeres M, Litschauer B, Bergler-Klein J. et al. Long-term endurance training increases serum cathepsin S and decreases IL-6 and hsCRP levels. J Sports Sci. 2016;21:1-6
4. Sponder M, Fritzer-Szekeres M, Marculescu R, Litschauer B, Strametz-Juranek J. Physical inactivity increases endostatin and osteopontin in patients with coronary artery disease. Heart Vessels. 2016;31(10):1603-8
5. Durstine JL, Grandjean PW, Davis PG, Ferguson MA, Alderson NL, DuBose KD. Blood lipid and lipoprotein adaptations to exercise: a quantitative analysis. Sports Med. 2001;31:1033-62
6. Halverstadt A, Phares DA, Wilund KR, Goldberg AP, Hagberg JM. Endurance exercise training raises high-density lipoprotein cholesterol and lowers small low-density lipoprotein and very low-density lipoprotein independent of body fat phenotypes in older men and women. Metabolism. 2007;56:444-50
7. Trejo-Gutierrez JF, Fletcher G. Impact of exercise on blood lipids and lipoproteins. J Clin Lipidol. 2007;1:175-81
8. Gordon DJ, Probstfield JL, Garrison RJ, Neaton JD, Castelli WP, Knoke JD. et al. High-density lipoprotein cholesterol and cardiovascular disease. Four prospective American studies. Circulation. 1989;79:8-15
9. van Capelleveen JC, Bochem AE, Motazacker MM, Hovingh GK, Kastelein JJ. Genetics of HDL-C: a causal link to atherosclerosis? Curr Atheroscler Rep. 2013;15:326
10. Toth PP, Barter PJ, Rosenson RS, Boden WE, Chapman MJ, Cuchel M. et al. High-density lipoproteins: a consensus statement from the National Lipid Association. J Clin Lipidol. 2013;7:484-525
11. Riwanto M, Landmesser U. High density lipoproteins and endothelial functions: mechanistic insights and alterations in cardiovascular disease. J Lipid Res. 2013;54:3227-43
12. Weichhart T, Kopecky C, Kubicek M, Haidinger M, Doller D, Katholnig K. et al. Serum amyloid A in uremic HDL promotes inflammation. J Am Soc Nephrol. 2012;23:934-47
13. Kingwell BA, Chapman MJ, Kontush A, Miller NE. HDL-targeted therapies: progress, failures and future. Nat Rev Drug Discov. 2014;13:445-64
14. Shah AS, Tan L, Long JL, Davidson WS. Proteomic diversity of high density lipoproteins: our emerging understanding of its importance in lipid transport and beyond. J Lipid Res. 2013;54:2575-85
15. Kopecky C, Haidinger M, Birner-Grunberger R, Darnhofer B, Kaltenecker CC, Marsche G. et al. Restoration of renal function does not correct impairment of uremic HDL properties. J Am Soc Nephrol. 2015;26:565-75
16. Riwanto M, Rohrer L, Roschitzki B, Besler C, Mocharla P, Mueller M. et al. Altered activation of endothelial anti- and proapoptotic pathways by high-density lipoprotein from patients with coronary artery disease: role of high-density lipoprotein-proteome remodeling. Circulation. 2013;127:891-904
17. Nguyen AB, Rohatgi A, Garcia CK, Ayers CR, Das SR, Lakoski SG. et al. Interactions between smoking, pulmonary surfactant protein B, and atherosclerosis in the general population: the Dallas Heart Study. Arterioscler Thromb Vasc Biol. 2011;31:2136-43
18. De Pasquale CG, Arnolda LF, Doyle IR, Aylward PE, Chew DP, Bersten AD. Plasma surfactant protein-B: a novel biomarker in chronic heart failure. Circulation. 2004;110:1091-6
19. Kopecky C, Genser B, Drechsler C, Krane V, Kaltenecker CC, Hengstschlager M. et al. Quantification of HDL proteins, cardiac events, and mortality in patients with type 2 diabetes on hemodialysis. Clin J Am Soc Nephrol. 2015;10:224-31
20. Harriss DJ, Atkinson G. Ethical Standards in Sport and Exercise Science Research: 2016 Update. Int J Sports Med. 2015;36:1121-4
21. Du Bois D, Du Bois EF. A formula to estimate the approximate surface area if height and weight be known. Nutrition. 1989;5:303-11 discussion 12-3
22. Charlton-Menys V, Betteridge DJ, Colhoun H, Fuller J, France M, Hitman GA. et al. Targets of statin therapy: LDL cholesterol, non-HDL cholesterol, and apolipoprotein B in type 2 diabetes in the Collaborative Atorvastatin Diabetes Study (CARDS). Clin Chem. 2009;55:473-80
23. Mensink RP, Zock PL, Kester AD, Katan MB. Effects of dietary fatty acids and carbohydrates on the ratio of serum total to HDL cholesterol and on serum lipids and apolipoproteins: a meta-analysis of 60 controlled trials. Am J Clin Nutr. 2003;77:1146-55
24. Mozaffarian D, Aro A, Willett WC. Health effects of trans-fatty acids: experimental and observational evidence. Eur J Clin Nutr. 2009;63(Suppl 2):S5-21
25. Kraus WE, Houmard JA, Duscha BD, Knetzger KJ, Wharton MB, McCartney JS. et al. Effects of the amount and intensity of exercise on plasma lipoproteins. N Engl J Med. 2002;347:1483-92
26. Sponder M, Campean IA, Dalos D, Emich M, Fritzer-Szekeres M, Litschauer B. et al. Influence of long-term physical activity on PCSK9, HDL/LDL-C and Lp(a) - a prospective observational trial. Pol Arch Intern Med. 2017 [Epub ahead of print]
27. Shaw K, Gennat H, O'Rourke P, Del Mar C. Exercise for overweight or obesity. Cochrane Database Syst Rev. 2006:CD003817
28. Kontush A, Chapman MJ. Functionally defective high-density lipoprotein: a new therapeutic target at the crossroads of dyslipidemia, inflammation, and atherosclerosis. Pharmacol Rev. 2006;58:342-74
29. Chetty PS, Mayne L, Lund-Katz S, Stranz D, Englander SW, Phillips MC. Helical structure and stability in human apolipoprotein A-I by hydrogen exchange and mass spectrometry. Proc Natl Acad Sci U S A. 2009;106:19005-10
30. Coetzee GA, Strachan AF, van der Westhuyzen DR, Hoppe HC, Jeenah MS, de Beer FC. Serum amyloid A-containing human high density lipoprotein 3. Density, size, and apolipoprotein composition. J Biol Chem. 1986;261:9644-51
31. Annema W, Nijstad N, Tolle M, de Boer JF, Buijs RV, Heeringa P. et al. Myeloperoxidase and serum amyloid A contribute to impaired in vivo reverse cholesterol transport during the acute phase response but not group IIA secretory phospholipase A(2). J Lipid Res. 2010;51:743-54
32. Dullaart RP, de Boer JF, Annema W, Tietge UJ. The inverse relation of HDL anti-oxidative functionality with serum amyloid a is lost in metabolic syndrome subjects. Obesity (Silver Spring). 2013;21:361-6
33. Robin M, Dong P, Hermans C, Bernard A, Bersten AD, Doyle IR. Serum levels of CC16, SP-A and SP-B reflect tobacco-smoke exposure in asymptomatic subjects. Eur Respir J. 2002;20:1152-61
34. Schwartz GG, Olsson AG, Abt M, Ballantyne CM, Barter PJ, Brumm J. et al. Effects of dalcetrapib in patients with a recent acute coronary syndrome. N Engl J Med. 2012;367:2089-99
35. Voight BF, Peloso GM, Orho-Melander M, Frikke-Schmidt R, Barbalic M, Jensen MK. et al. Plasma HDL cholesterol and risk of myocardial infarction: a mendelian randomisation study. Lancet. 2012;380:572-80
Author contact
![]() Corresponding author: Michael Sponder, MD, PhD, MPH, Medical University of Vienna, Department of Cardiology, Währinger Gürtel 18-20, 1090 Vienna, Austria e-mail: michael.sponderac.at Tel.: +43 650 261 93 93 Fax: +43 40400 42 16
Corresponding author: Michael Sponder, MD, PhD, MPH, Medical University of Vienna, Department of Cardiology, Währinger Gürtel 18-20, 1090 Vienna, Austria e-mail: michael.sponderac.at Tel.: +43 650 261 93 93 Fax: +43 40400 42 16
Citation styles
APA
Sponder, M., Kopecky, C., Campean, I.A., Emich, M., Fritzer-Szekeres, M., Litschauer, B., Graf, S., Säemann, M.D., Strametz-Juranek, J. (2017). Sports and HDL-Quality Reflected By Serum Amyloid A and Surfactant Protein B. International Journal of Medical Sciences, 14(11), 1040-1048. https://doi.org/10.7150/ijms.20388.
ACS
Sponder, M.; Kopecky, C.; Campean, I.A.; Emich, M.; Fritzer-Szekeres, M.; Litschauer, B.; Graf, S.; Säemann, M.D.; Strametz-Juranek, J. Sports and HDL-Quality Reflected By Serum Amyloid A and Surfactant Protein B. Int. J. Med. Sci. 2017, 14 (11), 1040-1048. DOI: 10.7150/ijms.20388.
NLM
Sponder M, Kopecky C, Campean IA, Emich M, Fritzer-Szekeres M, Litschauer B, Graf S, Säemann MD, Strametz-Juranek J. Sports and HDL-Quality Reflected By Serum Amyloid A and Surfactant Protein B. Int J Med Sci 2017; 14(11):1040-1048. doi:10.7150/ijms.20388. https://www.medsci.org/v14p1040.htm
CSE
Sponder M, Kopecky C, Campean IA, Emich M, Fritzer-Szekeres M, Litschauer B, Graf S, Säemann MD, Strametz-Juranek J. 2017. Sports and HDL-Quality Reflected By Serum Amyloid A and Surfactant Protein B. Int J Med Sci. 14(11):1040-1048.
This is an open access article distributed under the terms of the Creative Commons Attribution (CC BY-NC) license (https://creativecommons.org/licenses/by-nc/4.0/). See http://ivyspring.com/terms for full terms and conditions.