International Journal of Medical Sciences 3.2
Impact Factor
ISSN: 1449-1907
Impact Factor
ISSN: 1449-1907
- Issue 4; 2026
- Issue 3; 2026
- Issue 2; 2026
- Issue 1; 2026
- Issue 16; 2025
- Volume 23; 2026
- Past Issues
- Editorial Board
- Cover Images
- Index & Coverage
- Cover Suggestion
- Special Issues
Top
Introduction and Background
Data Description
Analytical Methods
Results
Conclusion
Future Study
Acknowledgements
References
Introduction and Background
Data Description
Analytical Methods
Results
Conclusion
Future Study
Acknowledgements
References

 Global reach, higher impact
Int J Med Sci 2017; 14(3):201-212. doi:10.7150/ijms.16974 This issue Cite
Research Paper
Prevalence and Risk Factors of Comorbidities among Hypertensive Patients in China
Jiaojiao Wang1*, Jian James Ma2*, Jiaqi Liu1*, Daniel Dajun Zeng1, 3*, Cynthia Song4, Zhidong Cao1 ![]()
1. The State Key Laboratory of Management and Control for Complex Systems, Institute of Automation, Chinese Academy of Sciences, Beijing, China.
2. College of Business, University of Colorado, Colorado Springs, CO, USA.
3. University of Chinese Academy of Sciences, Beijing, China.
4. Internal Medicine Physician, Abington Hospital - Jefferson Health, Abington, PA, USA.
* These authors contributed equally to this work
Received 2016-7-25; Accepted 2017-1-23; Published 2017-2-23
Citation:
Wang J, Ma JJ, Liu J, Zeng DD, Song C, Cao Z. Prevalence and Risk Factors of Comorbidities among Hypertensive Patients in China. Int J Med Sci 2017; 14(3):201-212. doi:10.7150/ijms.16974. https://www.medsci.org/v14p0201.htm
Other stylesAbstract
Hypertension is a severe threat to human being's health due to its association with many comorbidities. Many research works have explored hypertension's prevalence and treatment. However, few considered impact of patient's socioeconomic status and geographical disparities. We intended to fulfill that research gap by analyzing the association of the prevalence of hypertension and three important comorbidities with various socioeconomic and geographical factors. We also investigated the prevalence of those comorbidities if the patient has been diagnosed with hypertension. We obtained a large collection of medical records from 29 hospitals across China. We utilized Bayes' Theorem, Pearson's chi-squared test, univariate and multivariate regression methods and geographical detector methods to analyze the association between disease prevalence and risk factors. We first attempted to quantified and analyzed the spatial stratified heterogeneity of the prevalence of hypertension comorbidities by q-statistic using geographical detector methods. We found that the demographic and socioeconomic factors, and hospital class and geographical factors would have an enhanced interactive influence on the prevalence of hypertension comorbidities. Our findings can be leveraged by public health policy makers to allocate medical resources more effectively. Healthcare practitioners can also be benefited by our analysis to offer customized disease prevention for populations with different socioeconomic status.
Keywords: Hypertension, Prevalence, Comorbidity, Bayes' Theorem, Geographical Detector, Public Health, Risk Factor.
Introduction and Background
Non-communicable diseases have become major threats to global health [1]. Over 36 million people die annually from non-communicable diseases, making up nearly two-thirds of deaths worldwide each year. Cardiovascular diseases, along with diabetes mellitus, cancer, and respiratory diseases, are one of the main causes of non-communicable disease-related deaths [2]. More importantly, when a patient is diagnosed with multiple comorbidities, it induces more challenges to the patient's health condition [3]. Some researchers have implied that comorbidities should have been paid sufficient attention in the differential diagnosis of patients, and that focusing treatment on comorbidities may be more beneficial for the treatment and control of diseases [4].
Hypertension has been proved a major co-existing disease with cardiovascular diseases in many countries since the 1970s [5-11]. In China, there has been a steady increase in the prevalence of hypertension during the past decade. Interestingly the increasing trend of hypertension prevalence varies across different populations [12-18]. That trend induces researchers' interests and effort in investigating possible risk factors of hypertension, and in turn analyzing the risk factors of cardiovascular diseases as hypertension's comorbidities. In our study, we investigated the prevalence and risk factors of coronary heart disease [19-21] when the patient was diagnosed with hypertension as well. To make our investigation more comprehensive, we also analyzed diabetes mellitus [22-24] and hyperlipidemia [20, 25] as hypertension's comorbidities. The reason why those two diseases were chosen as hypertension's major comorbidities was because, just like hypertension, those two diseases were also were considered strong indicating factors of coronary heart disease [26].
The hazards, importance, and risk factors of the comorbidities of hypertension have been extensively studied [9-11, 27-37]. However, most studies have been confined to a limited geographical region [38]. China is a large country with the biggest population in the world. Understanding the differences of prevalence of hypertension and its comorbidities across different geographic areas in China is vital to make strategic public health policy and to allocate public health-related resources.
In addition to patient's geographical region, patient's sex, age, and several other characteristics (e.g., income, education, occupation, control of tobacco consumption, and obesity, etc.) may also play a role in disease's prevalence [2, 37, 39-41]. The nature of hypertension-related health risk is similar in all populations, but the distribution of diseases with regard to those risk factors may vary [38, 42].
In this study, we collected a large sample of patient's electronic medical data from 29 cities across different areas in China. We aimed to examine the relationship between the prevalence and distribution of hypertension and its three comorbidities and the associated factors such as hospital reputation, demographic factors, patient socioeconomic status, and geographical disparities (zone type, topography, etc). Our analysis revealed important risk factors that are associated to the prevalence of those diseases being studied. Our work can be leveraged by health policy decision makers to better control hypertension and its comorbidities for specific populations and geographic areas in China.
Data Description
We describe the real medical data set that we utilized, the challenges that we encountered during data analysis, and the risk factors that we chose to investigate the disease prevalence.
Ethical statement
This study was approved by the institutional review board of the Institute of Automation, Chinese Academy of Sciences. The data set was collected by the Chinese government for disease control. All patients gave their informed consent. The patient's privacy was strictly preserved in our study. We only used the patient's sex, age, and clinical diagnostic information to perform our analysis. Patients' identity-related information was masked before we started our study.
Data collection
The Electronic Medical Records (EMRs) being used in this study were obtained from a national level health information organization in China. Specifically EMRs from 29 hospitals in 29 different cities in China from January 1, 2011, to December 31, 2013 were collected. The entire data cleaning and analysis procedure was completed using the very computer provided by the data provider in a monitored room at the data provider's facility. Throughout the process, we were not permitted to transfer or make copy of the data off of the computer that we were utilizing.
In total, 2,122,703 hypertensive outpatients were identified out of all the EMRs in the data set. Each EMR included patient's medical records, such as patient id, date of treatment, sex, age, diagnosis, and the information about hospital, e.g. hospital class and location, etc. EMRs with incomplete information were excluded from this study.
Original medical data was collected by the attending physicians, then proofed and summarized by trained staff before the data was submitted to the national health information organization. Patient's information was collected for diagnostic purposes, and was thus highly reliable and objective. In China, the disease diagnostic process is fairly standard with regard to common diseases such as hypertension and the three comorbidities in our study [43]. Note that throughout this study, a hypertensive patient was said to have comorbidity, i.e. hyperlipidemia, meant that patient was simultaneously diagnosed with both hypertension and hyperlipidemia on at least one medical record while the patient was in hospital.
Since some data fields were input via free text, physicians from different hospitals sometimes chose slightly different terms to describe patient's conditions. Before we could start data analysis, we had to spend a great deal of time consolidating the data format. Data cleaning and consolidation process was the most time-consuming and labor-intensive step in this study.
Risk factors
To investigate disease prevalence and distribution, we chose the following six dimensions as the possible risk factors, namely patient's gender, age, income level, hospital class, zone type, and topography. In each risk factor dimension, we categorized patients in several groups based on the patient's or the hospital's information. Each patient belonged to one and exactly one group in each factor dimension.
To study the age impact on the prevalence of hypertension and the three comorbidities, we leveraged WHO criteria (http://www.who.int/topics/ageing/en/). Specifically we defined people aged 0-44 as young group, 45-59 as middle-aged group, and ≥60 as elderly group.
Instead of using patient's individual income level, we categorized patients based on the average income of the city where the patient resided. We then compared the city average income to the national average income of China (http://www.stats.gov.cn/). Each patient was either in the group whose city income average was higher or lower than the national income average.
The hospital class in China recognizes a hospital's quality and capacity of providing medical service, delivering medical education, and conducting medical research. Based on the current Chinese health care policy, Chinese hospitals are categorized in 3 tiers. Tier 1 hospitals are typically located in small towns and have less than 100 inpatient beds. Tier 2 hospitals tend to be at median-sized cities or districts. Their inpatient bed counts are between 100 and 500. Tier 3 hospitals are usually comprehensive or general hospitals at large cities with a bed count exceeding 500. Furthermore, based on the quality of medical services, infrastructure, equipment, and management efficiency, each tier is further categorized into 3 subsidiary levels, A, B, and C, with A being the highest and C the lowest. The 29 hospitals that we chose to perform our study involved five classes, namely 3A, 3B, 3C, 2A, and 2C.
Hospital locations were matched to the geocode of city-level divisions. Based on socioeconomic status and geographical nature of the city where the hospital was located, we categorized the 29 hospitals into 7 geographical zones, namely Northeast, North, East, South, Central, Northwest, and Southwest. Figure 1 showed the map of the 7 geographical zones and the locations of the 29 cities.
The topography factor captured the altitude feature of the hospital. The altitude data was from the GIS data sets published by The National Geomatics Center of China. Four groups of hospitals were considered, namely plain (0~200 meters), hill (201~500 meters), mountain (501~1000 meters), and plateau (>1000 meters).
Analytical Methods
We emphasized three important comorbidities among the hypertensive patients from our data set, namely diabetes mellitus, hyperlipidemia, and coronary heart disease. We intended to conduct our analysis in two folds. Firstly, we aimed to analyze the prevalence of a comorbidity given the patient diagnosed with hypertension. We adopted Bayes' Theorem to calculate the disease prevalence. Our second goal was to investigate the correlation between associated risk factors and disease prevalence by using non-conditional logistic regression method. ArcGIS v10.1 (Environmental Systems Research Institute Inc., Redlands, CA, USA) was used to visualize the prevalence of comorbidities of hypertension.
Figure 1
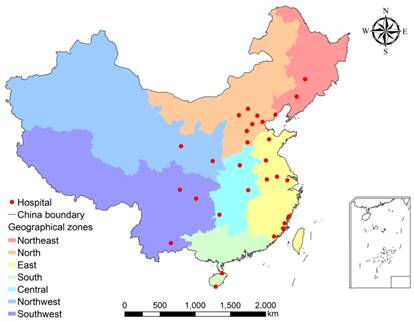
Hospital locations and geographical zones. Figure generated by ESRI ArcMap v10.1.
Bayes' theorem
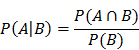
Bayes' Theorem is a famous probability theorem named after the renowned Thomas Bayes [44]. It calculates the probability of a random event A given the fact that another random event B occurs. Bayes' Theorem has been widely utilized in analyzing disease prevalence, spread forecasting, and other public health problems [45-47]. The following formula is one of the frequently referred representations of Bayes' Theorem.

Where  is the probability that random event A occurs.
  is the probability of A given B occurs.
  denotes the intersection of random events A and B. Thus
  is the probability that both events A and B occur.
From the above formula, we have
We adopted Bayes' Theorem to analyze the probability that a patient would be diagnosed with a comorbidity given that the same patient had been diagnosed with hypertension. Note that the probability that a patient is diagnosed with a disease is usually estimated to be the prevalence of that disease. We then derived
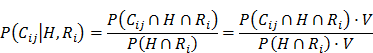
Where
H: The event that a hypertensive patient is diagnosed.
Ri: The event that a patient is with risk factor i.
Cij: The event that a patient with risk factor i is diagnosed with comorbidity j.
V: The overall population.
P(E): The probability of event E occurs.
V(E): The overall number of instances of event E.
For example, the prevalence of coronary heart disease given the patient is both male and diagnosed with hypertension equals the total number of male hypertensive patients with coronary heart disease divided by the total number of male hypertensive patients. The results were in Table 2.
Statistical analyses
The correlation analysis between the associate risk factors and disease prevalence was performed using non-conditional logistic regression method. To fully understand the correlation, we conducted both univariate and multivariate regression analysis. The associated risk factors were considered independent variables in the regression analysis. The dependent variable was a binary variable where 1 indicated a hypertensive patient with at least one of the three comorbidities and 0 a hypertensive patient without. Differences in prevalence of hypertension comorbidities by the associated factors were compared among subgroups by using Pearson's chi-squared test. Data was entered and reviewed by two different researchers. For descriptive analysis, the prevalence of hypertension comorbidities and other categorical variables were expressed in percentages. Results were presented in Tables 4 and 5.
All the categorical variables used in the study were coded as dummy variables, namely, hypertension comorbidities (positive = 1, negative = 0); gender (male = 1, female = 0); age (45-59 = 1, 60+ = 2, 0-44 = 0); the city average of per capita disposable income of urban households during 2011-2013 (higher than national average = 1, lower than national average = 0); hospital class (3A = 1, 3B = 2, 3C = 3, 2A = 4, 2C = 0); zone type (North = 1, East = 2, South = 3, Central = 4, Northwest = 5, Southwest = 6, Northeast = 0); topography (hill = 1, mountain = 2, plateau = 3, plain = 0). Odd ratios (OR) and 95% confidence intervals (CI) were calculated using univariate and multivariable logistic regression analyses. P value < 0.05 was considered statistically significant.
Geographical detector methods
The geographical detector method [48, 49] is a spatial variance analysis method developed in the context of medical geography to assess the associations between a health outcome and feasible risk factors. Spatial stratified heterogeneity is a universal driver of biological diversity and evolution, environmental patterns and tyranny, and inter-regional conflicts and cooperation. The geographical detector method computes the power of determinant (q) that quantitatively measures the affinity between the risk factors and disease prevalence. The geographical detector method is based on analysis of the variance of disease prevalence by the categories of each risk factor under consideration. The key underlying assumption is the following: if the factor F is associated with disease prevalence P, then P would exhibit a spatial distribution similar to that of F. In the perfect case in which factor F completely explains pattern of P, the value of P would be uniform across each category of F and spatial variance of P within all categories would be 0 in a realistic case, the degree of spatial correspondence between layers F and P is measured by the power of determinant (q) for a factor F which is defined as
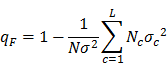
Where  is the variance of P within category c of the risk factor F, Nc is number of sample units in category c,
  is global variance of P in the entire study area, N is the number of total samples in the entire study area, and L is the number of categories of the factor F. The standard definition of
  and
and  apply here
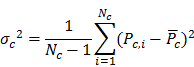
Where Pc,i is the value of ith sample unit of P in category c and  is the mean of P in category c.
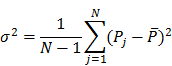
Where Pj is the value of the jth sample unit from the entire study area and  is the global mean of P over the entire study area.
Note that the term 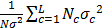 is a ratio of the weighted sum of local variance (weighted by the number of samples in each category) to the global variance. If factor F completely controls the spatial distribution of P, local variance is 0 and qF = 1 (assuming
  ). If factor F is completely unrelated to the spatial distribution of P, the weighted sum of local variance is the same as the global variance and qF = 0. In general,
  reflects the proportion of spatial variation of P explained by the factor F. Higher values of qF indicate higher affinity of F and P. Note that this method assesses degree of affinity or spatial association and not specifically a degree of causal relation between F and P. The power of determinant (qF) is termed the “factor detector” and addresses the question “which risk factor is more strongly associated with the spatial distribution of P and thus could be a controlling factor?” The free software for conducting geographical detector analysis can be downloaded from http://www.sssampling.org/Excel-Geodetector/.
Results
Here we summarize the results that we obtained from the above analysis.
Prevalence of hypertension and its comorbidities
Table 1 showed the occurrence distribution of hypertension and the three important comorbidities, diabetes mellitus, hyperlipidemia, and coronary heart disease. The numbers of patients in each group of each risk factor category were presented. The numbers in the parentheses were the percentage values. In terms of patient's income, the higher income patients accounted for the majority of hypertension (68.24%) and all the three comorbidities (69.36% for diabetes mellitus, 77.39% for hyperlipidemia, and 57.32% for coronary heart disease). Note that observation might be due to the fact that higher income population tended to go to hospital more often than lower income population did. For hospital class, while it was reasonable to assume more patients tended to go to better and bigger hospitals, we did observe that for hyperlipidemia, 17.02% patients went to 2A hospitals which was significantly higher than 3B (3.47%) and 3C (0.29%) hospitals. Hospital's zone type showed some interesting patterns too. East zone accounted for the largest portion of prevalence for hypertension (35.56%) and diabetes mellitus (35.29%), but north zone was by far the biggest contributor in hyperlipidemia (69.82%) and coronary heart disease (40.16%).
Table 1
Disease distribution of hypertension and three comorbidities
| Characteristic (Number and %) | Hypertension | Hypertension and Diabetes mellitus | Hypertension and Hyperlipidemia | Hypertension and Coronary heart disease |
|---|---|---|---|---|
| Gender | ||||
| Male | 1146218 (54.00) | 209121 (54.44) | 108929 (55.63) | 163156 (54.44) |
| Female | 976485 (46.00) | 174984 (45.56) | 86876 (44.37) | 136538 (45.56) |
| Age | ||||
| 0-44 | 265554 (12.51) | 15222 (3.96) | 20557 (10.50) | 7444 (2.48) |
| 45-59 | 653872 (30.80) | 100263 (26.10) | 62154 (31.74) | 56712 (18.92) |
| 60+ | 1203277 (56.69) | 268620 (69.93) | 113094 (57.76) | 235538 (78.59) |
| Income | ||||
| higher than national average | 1448506 (68.24) | 266401 (69.36) | 151541 (77.39) | 171784 (57.32) |
| lower than national average | 674197 (31.76) | 117704 (30.64) | 44264 (22.61) | 127910 (42.68) |
| Hospital class | ||||
| 3A | 1771120 (83.44) | 340968 (88.77) | 154595 (78.95) | 261746 (87.34) |
| 3B | 131428 (6.19) | 23749 (6.18) | 6790 (3.47) | 17863 (5.96) |
| 3C | 12221 (0.58) | 2063 (0.54) | 570 (0.29) | 1502 (0.50) |
| 2A | 197455 (9.30) | 16119 (4.20) | 33320 (17.02) | 18180 (6.07) |
| 2C | 10479 (0.49) | 1206 (0.31) | 530 (0.27) | 403 (0.13) |
| Zone type | ||||
| Northeast | 54983 (2.59) | 10521 (2.74) | 681 (0.35) | 4115 (1.37) |
| North | 621662 (29.29) | 129063 (33.60) | 136712 (69.82) | 120361 (40.16) |
| East | 750531 (35.36) | 135533 (35.29) | 17864 (9.12) | 72028 (24.03) |
| South | 29300 (1.38) | 3848 (1.00) | 2761 (1.41) | 4648 (1.55) |
| Central | 179844 (8.47) | 19477 (5.07) | 7998 (4.08) | 20445 (6.82) |
| Northwest | 189209 (8.91) | 20471 (5.33) | 9433 (4.82) | 17724 (5.91) |
| Southwest | 297174 (14.00) | 65192 (16.97) | 20356 (10.40) | 60373 (20.14) |
| Topography | ||||
| Plain(0-200 meters) | 1549047 (72.98) | 291380 (75.86) | 159679 (81.55) | 203607 (67.94) |
| Hill(201-500 meters) | 426324 (20.08) | 77709 (20.23) | 26261 (13.41) | 73954 (24.68) |
| Mountain(501-1000 meters) | 51807 (2.44) | 3874 (1.01) | 5217 (2.66) | 14298 (4.77) |
| Plateau( >1000 meters) | 95525 (4.50) | 11142 (2.90) | 4648 (2.37) | 7835 (2.61) |
| Total | 2122703 (100) | 384105 (100) | 195805 (100) | 299694 (100) |
Values in parentheses referred to the percentage of patients in the corresponding group.
Table 2
Prevalence of comorbidities among hypertensive patients.
| Characteristics | Hypertension and Diabetes mellitus | Hypertension and Hyperlipidemia | Hypertension and Coronary heart disease | |||
|---|---|---|---|---|---|---|
| Prevalence, % | P value | Prevalence, % | P value | Prevalence, % | P value | |
| Gender | ||||||
| Male | 18.24 | <0.001 | 9.50 | <0.001 | 14.23 | <0.001 |
| Female | 17.92 | 8.90 | 13.98 | |||
| Age | ||||||
| 0-44 | 5.73 | <0.001 | 7.74 | <0.001 | 2.80 | <0.001 |
| 45-59 | 15.33 | 9.51 | 8.67 | |||
| 60+ | 22.32 | 9.40 | 19.57 | |||
| Income | ||||||
| higher than national average | 18.39 | <0.001 | 10.46 | <0.001 | 11.86 | <0.001 |
| lower than national average | 17.46 | 6.57 | 18.97 | |||
| Hospital class | ||||||
| 3A | 19.25 | <0.001 | 8.73 | <0.001 | 14.78 | <0.001 |
| 3B | 18.07 | 5.17 | 13.59 | |||
| 3C | 16.88 | 4.66 | 12.29 | |||
| 2A | 8.16 | 16.87 | 9.21 | |||
| 2C | 11.51 | 5.06 | 3.85 | |||
| Zone type | ||||||
| Northeast | 19.14 | <0.001 | 1.24 | <0.001 | 7.48 | <0.001 |
| North | 20.76 | 21.99 | 19.36 | |||
| East | 18.06 | 2.38 | 9.60 | |||
| South | 13.13 | 9.42 | 15.86 | |||
| Central | 10.83 | 4.45 | 11.37 | |||
| Northwest | 10.82 | 4.99 | 9.37 | |||
| Southwest | 21.94 | 6.85 | 20.32 | |||
| Topography | ||||||
| Plain (0-200 meters) | 18.81 | <0.001 | 10.31 | <0.001 | 13.14 | <0.001 |
| Hill (201-500 meters) | 18.23 | 6.16 | 17.35 | |||
| Mountain (501-1000 meters) | 7.48 | 10.07 | 27.60 | |||
| Plateau ( >1000 meters) | 11.66 | 4.87 | 8.20 | |||
| Total | 18.10 | 9.22 | 14.12 | |||
Differences in prevalence of hypertension's comorbidities were compared among groups using Bayes' Theorem and Pearson's chi-squared test.
Table 2 presented the prevalence of hypertension's comorbidities by the associated risk factors. The prevalence percentages were calculated by using Bayes' Theorem. For example, the probability, or the prevalence, of coronary heart disease given the patient was both male and diagnosed with hypertension was 14.23%. That was the number of male hypertensive patients with coronary heart disease (163,156) divided by the number of male hypertensive patients (1,146,218).
Table 2 showed many different patterns as indicated in Table 1. That was because Table 1 did not consider population differences in each group. For example, unlike in Table 1, the prevalence of coronary heart disease in Table 2 showed that lower income patients (18.97%) were actually higher than that of higher income patients (11.86%). This result indicated that lower income hypertensive patients were more likely to develop coronary heart disease than higher income hypertensive patients did. Table 1 failed to reveal this pattern because it did not consider the fact that higher income patients were much more likely to do a checkup on coronary heart disease. In later sections, more interesting patterns will be presented in Tables 4 and 5 which showed similar patterns as Table 2 did. Using Pearson's chi-squared test, Table 2 also showed that the prevalence among groups in all risk factors differed significantly for all the three comorbidities (p < 0.001).
The prevalence of hypertension comorbidities with regard to Chinese cities was shown in Table 3. Across the 29 cities, the prevalence (%) ranged from 4.92 in Kaiyuan City (Yunnan province) to 34.64 in Xiapu City (Fujian province) for diabetes mellitus, from 0.97 in Shenyang (Liaoning province) to 30.15 in Beijing for hyperlipidemia, and from 3.83 in Datong (Shanxi province) to 39.62 in Shijiazhuang (Hebei province) for coronary heart disease. Figure 2 visualized the geographical distribution of prevalence of hypertension comorbidities based on Table 3.
Associated factors of the prevalence of hypertension's comorbidities
The univariate analysis of the six associated factors with hypertension's three comorbidities were illustrated in Table 4. The prevalence of hypertension comorbidities for male were all slightly larger than those for female as indicated by the Odds Ratios (OR) (diabetes mellitus = 1.02, hyperlipidemia = 1.08, and coronary heart disease = 1.02). With regard to the age impact, older groups had much larger OR values for diabetes mellitus (2.98 and 4.73) and coronary heart disease (3.29 and 8.44) than hyperlipidemia (1.25 and 1.24). Note that the middle-aged group (1.25) had higher OR than the elder group (1.24) which showed a different trend from those of the other two comorbidities.
There was a significant discrepancy regarding patient income's impact on the three comorbidities. Hyperlipidemia's OR (1.66) was larger than 1 while coronary heart disease's OR (0.57) was less than 1 and diabetes mellitus' OR (1.07) was close to 1.
Hospital class also exhibited strong association with regard to the prevalence of comorbidities. Note we explained previously that tier 3 hospitals were much larger than tier 2 hospitals in terms of hospital size. Within the same class, the sub-class, A, B, or C, differentiated hospitals by the quality of the hospital's medical service and management. In Table 4, a common pattern was recognized that the OR values were monotonically decreasing according to hospital class with one exception. Hyperlipidemia's OR for 2A hospitals (3.81) was significantly higher than those for all Class 3 hospitals (1.80, 1.02, and 0.92).
Figure 2
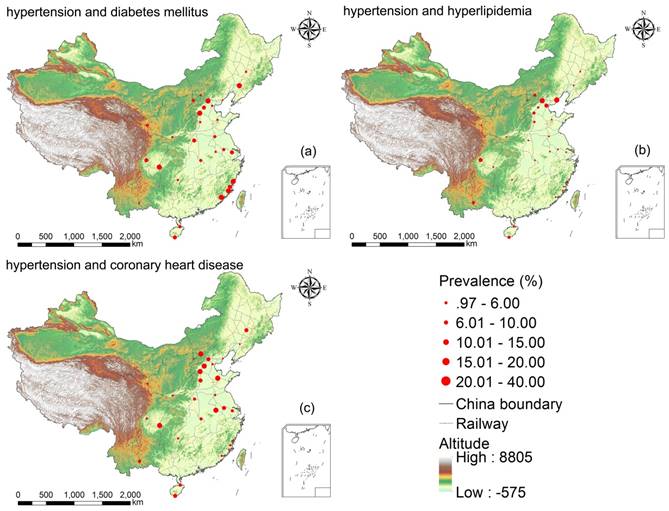
Geographical distribution of disease prevalence from 29 hospitals across 29 cities in China. Figure generated by ESRI ArcMap v10.1.
Table 3
Prevalence of hypertension's comorbidities in 29 cities across China.
| Order | Hypertension and Diabetes mellitus | Hypertension and Hyperlipidemia | Hypertension and Coronary heart disease |
|---|---|---|---|
| 1 | Xiapu 34.64 [33.30,35.98] | Beijing 30.15 [29.98,30.32] | Shijiazhuang 39.62 [39.24,40.00] |
| 2 | Beijing 31.24 [31.08,31.41] | Beidaihe 27.53 [27.12,27.93] | Hefei 37.96 [37.47,38.44] |
| 3 | Chongqing 24.62 [24.43,24.81] | Chengdu 19.70 [19.43,19.97] | Zibo 29.93 [29.04,30.83] |
| 4 | Shenyang 22.32 [21.93,22.71] | Tianjin 15.72 [15.51,15.93] | Zhangjiakou 27.60 [27.22,27.99] |
| 5 | Shijiazhuang 22.24 [21.92,22.57] | Shijiazhuang 13.31 [13.05,13.58] | Chongqing 25.56 [25.37,25.75] |
| 6 | Zhangzhou 20.75 [20.49,21.02] | Kaiyuan 10.73 [10.17,11.28] | Baoding 25.53 [25.08,25.99] |
| 7 | Putian 20.61 [20.31,20.92] | Sanya 10.30 [9.83,10.77] | Beijing 19.73 [19.58,19.87] |
| 8 | Fuzhou 19.30 [19.18,19.42] | Zhangjiakou 10.07 [9.81,10.33] | Sanya 18.19 [17.60,18.78] |
| 9 | Chengdu 17.70 [17.43,17.96] | Haikou 8.37 [7.90,8.84] | Changchun 16.95 [16.27,17.63] |
| 10 | Pingdingshan 16.89 [16.23,17.56] | Baoding 8.09 [7.80,8.37] | Nanjing 15.37 [15.04,15.69] |
| 11 | Baoding 16.67 [16.28,17.06] | Handan 7.99 [7.34,8.64] | Handan 15.01 [14.15,15.87] |
| 12 | Wuxi 15.96 [15.68,16.24] | Xi'an 5.67 [5.54,5.80] | Haikou 13.02 [12.44,13.59] |
| 13 | Sanya 15.46 [14.91,16.02] | Datong 5.07 [4.65,5.49] | Pingdingshan 12.30 [11.72,12.88] |
| 14 | Xuzhou 14.24 [13.61,14.87] | Pingdingshan 4.68 [4.30,5.05] | Wuhan 11.43 [11.27,11.59] |
| 15 | Lanzhou 12.77 [12.53,13.01] | Wuhan 4.60 [4.50,4.70] | Kaiyuan 11.04 [10.47,11.61] |
| 16 | Nanjing 12.41 [12.12,12.71] | Xiapu 4.19 [3.63,4.76] | Wuxi 10.77 [10.53,11.00] |
| 17 | Datong 11.52 [10.91,12.13] | Lanzhou 3.91 [3.77,4.05] | Xi'an 10.00 [9.83,10.17] |
| 18 | Wuhan 10.56 [10.41,10.72] | Putian 3.57 [3.43,3.71] | Huaihua 9.81 [9.31,10.32] |
| 19 | Haikou 10.28 [9.76,10.80] | Xuzhou 3.21 [2.89,3.52] | Tianjin 9.62 [9.45,9.79] |
| 20 | Xi'an 9.59 [9.42,9.76] | Zhangzhou 2.80 [2.69,2.91] | Chengdu 8.58 [8.39,8.77] |
| 21 | Huaihua 8.39 [7.91,8.86] | Huaihua 2.49 [2.22,2.75] | Lanzhou 8.37 [8.17,8.58] |
| 22 | Tianjin 8.32 [8.16,8.48] | Fuzhou 2.30 [2.26,2.35] | Zhangzhou 7.32 [7.15,7.49] |
| 23 | Zibo 8.01 [7.48,8.54] | Changchun 2.25 [1.98,2.52] | Xuzhou 7.14 [6.68,7.61] |
| 24 | Zhangjiakou 7.48 [7.25,7.71] | Zibo 2.11 [1.83,2.39] | Fuzhou 6.88 [6.80,6.96] |
| 25 | Changchun 7.45 [6.98,7.92] | Wuxi 2.02 [1.92,2.13] | Putian 5.81 [5.63,5.99] |
| 26 | Handan 6.94 [6.33,7.55] | Hefei 1.52 [1.40,1.65] | Shenyang 4.91 [4.71,5.12] |
| 27 | Hefei 6.27 [6.03,6.52] | Chongqing 1.47 [1.42,1.53] | Beidaihe 4.01 [3.83,4.19] |
| 28 | Beidaihe 5.34 [5.14,5.55] | Nanjing 1.47 [1.36,1.57] | Xiapu 3.88 [3.34,4.42] |
| 29 | Kaiyuan 4.92 [4.53,5.31] | Shenyang 0.97 [0.88,1.06] | Datong 3.86 [3.49,4.23] |
| Overall | 18.10 [18.04, 18.15] | 9.22 [9.19, 9.26] | 14.12 [14.07, 14.17] |
Numbers in brackets refer to 95% Confidence Interval (CI) of hypertension comorbidities. The 29 hospitals are from 29 different cities in China. Text in the table is city names. For instance, Xiapu is Xiapu City in Fujian Province.
Table 4
Univariate analysis of factors associated with hypertension's comorbidities.
| Variables | Hypertension and Diabetes mellitus | Hypertension and Hyperlipidemia | Hypertension and Coronary heart disease | ||||||
|---|---|---|---|---|---|---|---|---|---|
| OR | 95% CI | P | OR | 95% CI | P | OR | 95% CI | P | |
| Gender | Female as reference | ||||||||
| Male | 1.02 | 1.02, 1.03 | 0.00 | 1.08 | 1.07, 1.09 | 0.00 | 1.02 | 1.01, 1.03 | 0.00 |
| Age | 0-44 as reference | ||||||||
| 45-59/0-44 | 2.98 | 2.93, 3.03 | 0.00 | 1.25 | 1.23, 1.27 | 0.00 | 3.29 | 3.21, 3.38 | 0.00 |
| 60+/0-44 | 4.73 | 4.65, 4.81 | 0.00 | 1.24 | 1.22, 1.26 | 0.00 | 8.44 | 8.24, 8.64 | 0.00 |
| Income | Lower than national average as reference | ||||||||
| higher than national average | 1.07 | 1.06, 1.07 | 0.00 | 1.66 | 1.64, 1.68 | 0.00 | 0.57 | 0.57, 0.58 | 0.00 |
| Hospital class | 2C as reference | ||||||||
| 3A | 1.83 | 1.73, 1.95 | 0.00 | 1.80 | 1.64, 1.96 | 0.00 | 4.34 | 3.92, 4.79 | 0.00 |
| 3B | 1.70 | 1.60, 1.80 | 0.00 | 1.02 | 0.93, 1.12 | 0.63 | 3.93 | 3.56, 4.35 | 0.00 |
| 3C | 1.56 | 1.45, 1.69 | 0.00 | 0.92 | 0.81, 1.04 | 0.17 | 3.50 | 3.13, 3.92 | 0.00 |
| 2A | 0.68 | 0.64, 0.73 | 0.00 | 3.81 | 3.49, 4.16 | 0.00 | 2.54 | 2.29, 2.80 | 0.00 |
| Zone type | Northeast as reference | ||||||||
| North | 1.11 | 1.08, 1.13 | 0.00 | 22.48 | 20.8, 24.3 | 0.00 | 2.97 | 2.87, 3.07 | 0.00 |
| East | 0.93 | 0.91, 0.95 | 0.00 | 1.94 | 1.80, 2.10 | 0.00 | 1.31 | 1.27, 1.36 | 0.00 |
| South | 0.64 | 0.61, 0.67 | 0.00 | 8.30 | 7.62, 9.03 | 0.00 | 2.33 | 2.23, 2.44 | 0.00 |
| Central | 0.51 | 0.50, 0.53 | 0.00 | 3.71 | 3.43, 4.02 | 0.00 | 1.59 | 1.53, 1.64 | 0.00 |
| Northwest | 0.51 | 0.50, 0.53 | 0.00 | 4.18 | 3.87, 4.53 | 0.00 | 1.28 | 1.23, 1.32 | 0.00 |
| Southwest | 1.19 | 1.16, 1.22 | 0.00 | 5.86 | 5.43, 6.33 | 0.00 | 3.15 | 3.05, 3.26 | 0.00 |
| Topography | Plain (0-200 meters) as reference | ||||||||
| Hill (201-500 meters) | 0.96 | 0.95, 0.97 | 0.00 | 0.57 | 0.56, 0.58 | 0.00 | 1.39 | 1.37, 1.40 | 0.00 |
| Mountain (501-1000 meters) | 0.35 | 0.34, 0.36 | 0.00 | 0.97 | 0.95, 1.00 | 0.08 | 2.52 | 2.47, 2.57 | 0.00 |
| Plateau ( >1000 meters) | 0.57 | 0.56, 0.58 | 0.00 | 0.45 | 0.43, 0.46 | 0.00 | 0.59 | 0.58, 0.60 | 0.00 |
OR: Odds Ratio. CI: Confidence Interval. P: P value. Female, age group 0-44 years, income lower than national average, 2C hospitals, northeast zone, and plain were taken as the baseline in calculation of OR, and 95% CI, and P value.
There was also a significantly strong association between the prevalence of hypertension comorbidities and the location of the hospital. Once again, hyperlipidemia showed different OR pattern than the other two comorbidities. Specifically its OR value for north zone was 22.48 which was significantly larger than any other OR values in zone type section. South zone also showed a high OR with the value 8.30.
Hospital's topography did not show clear and consistent trend of association with the prevalence of comorbidities. But we did realize an interesting and contradictory trend for hospitals in the areas of mountains. For mountains, the OR values were 0.35 for diabetes mellitus which was significantly less than 1 and 2.52 for coronary heart disease which was significantly greater than 1.
Risk factors of the prevalence of hypertension's comorbidities
While univariate analysis assumes one depend and one independent variable, for our study, we believed a multivariate analysis would fit our needs better. We performed a multivariate logistic regression analysis to investigate the importance of different risk factors for the prevalence of hypertension's comorbidities. The result was shown in Table 5. Most findings were similar to those of the univariate analysis as shown in Table 4. We presented below some different findings obtained from the multivariate analysis.
The adjusted OR for patient income higher than national average significantly increased for hyperlipidemia (2.28) compared with the corresponding crude OR (1.66) in the univariate analysis.
For hyperlipidemia, all of the adjusted OR values for hospital class significantly increased with 3C hospital being the most dramatic increase (from 0.92 to 38.96). For diabetes mellitus, 3C hospital's adjusted OR value also experienced an increase from 1.56 to 4.46.
In terms of hospital zone type, most adjusted OR values showed similar trends in both Tables 4 and 5. For hyperlipidemia, north (OR = 47.51) and south (OR = 94.77) remained the two strongest risk factors for the prevalence comorbidities. But the two OR values increased dramatically. In the multivariate analysis, south zone was the strongest risk factor whereas north zone was in the univariate analysis. South zone also became the highest OR value (OR = 15.64) for coronary heart disease.
Topography was the factor that changed the most in the multivariate analysis. For hyperlipidemia, the adjusted OR values became 2.82 for hill and 5.70 for plateau. Both OR values were significantly less than 1 in the univariate analysis (0.57 for hill and 0.45 for plateau). For coronary heart disease, the adjusted OR value for mountain experienced a decrease from 2.52 to 0.68.
Table 5
Multivariate analysis of factors associated with hypertension's comorbidities.
| Variables | Hypertension and Diabetes mellitus | Hypertension and Hyperlipidemia | Hypertension and Coronary heart disease | ||||||||||
|---|---|---|---|---|---|---|---|---|---|---|---|---|---|
| ORadj | 95% CI | P | ORadj | 95% CI | P | ORadj | 95% CI | P | |||||
| Gender | Female as reference | ||||||||||||
| Male | 1.06 | 1.05, 1.07 | 0.00 | 1.13 | 1.12, 1.14 | 0.00 | 1.17 | 1.16, 1.17 | 0.00 | ||||
| Age | 0-44 as reference | ||||||||||||
| 45-59 | 2.84 | 2.79, 2.89 | 0.00 | 1.07 | 1.06, 1.09 | 0.00 | 3.37 | 3.29, 3.45 | 0.00 | ||||
| 60+ | 4.24 | 4.16, 4.31 | 0.00 | 1.06 | 1.04, 1.07 | 0.00 | 8.86 | 8.65, 9.07 | 0.00 | ||||
| Income | Lower than national average as reference | ||||||||||||
| Higher than national average | 1.06 | 1.04, 1.07 | 0.00 | 2.28 | 2.25, 2.32 | 0.00 | 0.49 | 0.48, 0.49 | 0.00 | ||||
| Hospital class | 2C as reference | ||||||||||||
| 3A | 1.81 | 1.67, 1.97 | 0.00 | 17.79 | 15.6, 20.4 | 0.00 | 3.42 | 3.04, 3.85 | 0.00 | ||||
| 3B | 1.49 | 1.37, 1.63 | 0.00 | 13.02 | 11.3, 14.9 | 0.00 | 2.84 | 2.52, 3.20 | 0.00 | ||||
| 3C | 4.46 | 4.04, 4.94 | 0.00 | 38.96 | 33.0, 46.0 | 0.00 | 1.41 | 1.24, 1.62 | 0.00 | ||||
| 2A | 0.45 | 0.41, 0.49 | 0.00 | 12.03 | 10.5, 13.7 | 0.00 | 1.62 | 1.45, 1.82 | 0.00 | ||||
| Zone type | Northeast as reference | ||||||||||||
| North | 1.92 | 1.84, 2.01 | 0.00 | 47.51 | 43.1, 52.3 | 0.00 | 2.32 | 2.20, 2.45 | 0.00 | ||||
| East | 0.46 | 0.44, 0.48 | 0.00 | 4.35 | 3.90, 4.84 | 0.00 | 7.45 | 7.04, 7.88 | 0.00 | ||||
| South | 0.68 | 0.62, 0.74 | 0.00 | 94.77 | 80.9, 111.0 | 0.00 | 15.64 | 14.2, 17.3 | 0.00 | ||||
| Central | 0.39 | 0.37, 0.41 | 0.00 | 7.92 | 7.06, 8.88 | 0.00 | 3.79 | 3.55, 4.06 | 0.00 | ||||
| Northwest | 0.94 | 0.85, 1.02 | 0.00 | 3.45 | 3.02, 3.93 | 0.00 | 0.87 | 0.80, 0.94 | 0.00 | ||||
| Southwest | 1.56 | 1.41, 1.72 | 0.00 | 9.62 | 8.32, 11.13 | 0.00 | 1.40 | 1.28, 1.53 | 0.00 | ||||
| Topography | Plain (0-200 meters) as reference | ||||||||||||
| Hill (201-500 meters) | 0.82 | 0.78, 0.87 | 0.00 | 2.82 | 2.57, 3.09 | 0.00 | 1.32 | 1.26, 1.38 | 0.00 | ||||
| Mountain (501-1000 meters) | 0.27 | 0.26, 0.28 | 0.00 | 0.63 | 0.60, 0.65 | 0.00 | 0.68 | 0.66, 0.69 | 0.00 | ||||
| Plateau ( >1000 meters) | 0.87 | 0.82, 0.92 | 0.00 | 5.70 | 5.10, 6.37 | 0.00 | 0.23 | 0.21, 0.24 | 0.00 | ||||
ORadj: Adjusted Odds Ratio. CI: Confidence Interval. P: P value. Female, age group 0-44 years, income lower than national average, 2C hospitals, northeast zone, and plain were taken as the baseline in calculation of ORadj, and 95% CI, and P value.
Spatial stratified heterogeneity tests
The factor detector showed that the effect of risk factors on the prevalence of hypertension's comorbidities was ranked by q-statistic (P value < 0.001) as follows: (1) For diabetes mellitus, Age (2.13%) > Zone type (0.92%) > Hospital class (0.71%) > Topography (0.34%) > Income (0.01%) > Gender (0.002%); (2) For hyperlipidemia, Zone type (8.39%) > Hospital class (0.82%) > Topography (0.43%) > Income (0.39%) >Age (0.04%) > Gender (0.01%); (3) For coronary heart disease, Age (3.47%) > Zone type (2.02%) > Income (0.90%) > Topography (0.73%) > Hospital class (0.26%) > Gender (0.0013%). The results above suggested that the risk factor age and zone type could predominantly explain spatial stratified heterogeneity of the prevalence of diabetes mellitus and coronary heart disease, meanwhile zone type could predominantly explain spatial variability of the prevalence of hyperlipidemia.
The interaction detector showed some interesting phenomena. All risk factors were found to enhance the others' impacts and thus increased their individual representativeness in the distribution of the prevalence of three types of hypertension comorbidities. The results of interactive effects for diabetes mellitus were: Age and Zone type (2.98%), Age and Gender (2.16%), Age and Income (2.15%), Age and Hospital class (2.73%), Age and Topography (2.44%), Zone type and Hospital class (2.43%), Zone type and Income (1.7%), Topography and Zone type (1.47%), Topography and Hospital class (1.16%). The results of interactive effects for hyperlipidemia were: Zone type and Income (10.6%), Zone type and Hospital class (9.27%), Zone type and Topography (9.06%), Zone type and Age (8.65%), Zone type and Gender (8.54%), Income and Hospital class (1.57%), Topography and Hospital class (1.28%), Age and Hospital class (1.11%), Topography and Income (1.02%). The results of interactive effects for coronary heart disease were: Age and Zone type (5.8%), Age and Income (4.69%), Age and Topography (4.55%), Age and Hospital class (3.66%), Age and Gender (3.49%), Zone type and Hospital class (3.29%), Zone type and Income (3%), Zone type and Topography (2.36%), Zone type and Gender (2.04%), Income and Topography (1.83%), Income and Hospital class (1.5%). This indicated that interactions between risk factors would play an important role in the distribution of the prevalence of hypertension comorbidities.
Conclusion
This work focused on three types of hypertension's comorbidities, namely diabetes mellitus, hyperlipidemia, and coronary heart disease. We analyzed the prevalence of the three comorbidities given the patient was already diagnosed with hypertension. We then assessed the impact of several associated factors (patient's demographic and socioeconomic factors, and hospital class and geographical factors) for those three comorbidities. The methods that we utilized were Bayes' Theorem, Pearson's chi-squared test, and logistic regression method (univariate and multivariate analysis). Our results showed that the associated risk factors such as patient's gender, age, income level, hospital's class, zone type, and topography played an important role in the prevalence of hypertension's comorbidities. Our findings suggested that socioeconomic and geographical factors should be taken into consideration when analyzing the prevalence of hypertension and its comorbidities.
Gender and age had been proved as important risk factors for hypertension comorbidities from previous studies. Our results concurred with most previous findings. Specifically we found that being male significantly increased the risk of hypertension comorbidities, respectively, by 1.06-fold for diabetes mellitus, 1.13-fold for hyperlipidemia, and 1.17-fold for coronary heart disease.
It was also well known that compared with the young group, the middle-aged group and the elderly group had a significantly higher prevalence of hypertension comorbidities. However it was worth noticing that, for hyperlipidemia, the middle-aged group showed greater prevalence than the young and even the elder group did. A possible reason might be because the middle-aged group in China lacked physical activities the most due to their busy working schedule. Another possible explanation was that the middle-aged population in China had to attend lots of business related dinner gatherings which usually involved high fat foods [50, 51].
Tables 2, 4, and 5 all indicated the same impact of patient income level to the three comorbidities. They all showed that higher income level tended to lead to higher prevalence of hyperlipidemia and lower prevalence of coronary heart disease. As we explained previously, higher income population in the current Chinese society usually had to attend lots of business dinners which might lead to higher chances of hyperlipidemia [50, 51]. Interestingly hyperlipidemia and coronary heart disease showed reversed trends in prevalence. We suspected that was due to the fact that the higher income patients were more likely to intervene in coronary heart disease at an early stage than the lower income patients were. But our hypothesis is still in need of more concrete evidence and further investigation. It seemed that diabetes mellitus was not heavily impacted by patient income factor.
The hypertensive patients with diabetes mellitus and coronary heart disease were more likely to visit higher-classed hospitals, while those with hyperlipidemia might not. In our analysis, tier 2A hospitals seemed quite popular to patients with both hypertension and hyperlipidemia. In China, most higher-classed hospitals, though contain better medical resources, are usually crowded and hard to get sufficient personal attention from the medical service provider. Since most hypertensive patients with diabetes mellitus or coronary heart disease were in the elderly group, those patients tended to have more flexible personal schedule and thus were willing to seek for abundant medical resources over convenience. On the other hand, lots of hyperlipidemia patients were middle-aged professionals with higher income. For them convenience might be the most important factor when they chose which hospital to go to.
The odds of achieving hyperlipidemia were significantly greater for the patients living in south China and north China. The hypertensive patients located in south China and east China zones had greater odds of achieving coronary heart disease. The higher prevalence of diabetes mellitus among hypertensive patients occurred in north China. A possible reason for that would lie in that the economic power was stronger in the areas of south, north, and east than other zones in China, where the most developed zones such as Pearl River Delta, Beijing-Tianjin-Hebei urban agglomeration, and Yangtze River Delta were located. The rapid development of economics simultaneously resulted in high fat diet, unhealthy lifestyle, and greater stress that might lead to the above diseases [52, 53].
This study first attempted to quantify and analyze the spatial stratified heterogeneity of the prevalence of hypertension comorbidities by q-statistic and revealed the interactive effects of the multiple risk factors on the prevalence of hypertension comorbidities using geographical detector methods. It was found that age and zone type could predominantly explain spatial variability of the prevalence of the three kinds of hypertension comorbidities. The demographic and socioeconomic factors, and hospital class and geographical factors would have an enhanced interactive influence on the prevalence of hypertension comorbidities.
Future Study
Besides the many interesting findings that we reported, there are several limitations to our study. Firstly, the 29 hospitals that we collected data from were in 29 different cities. It would be interesting if we could utilize data from multiple hospitals within a city. Secondly, we were limited in our analyses to a set of comorbidities, but several other diseases that were not assessed may also have important associated patterns using the univariate and multivariate analysis. Thirdly, we had only collected a limited set of clinical data and some basic hospital related data. Some important characteristics of the patient (e.g., occupation, residential address, height, weight, and blood pressure, etc.) or the International Classification of Diseases code of the diagnosed symptoms were missing. More detailed information about the patient and the standardized diagnosed symptoms could play a very important role in examining the risk factors of diseases, and provide much more extensive and reliable clues for interpretation.
Despite those limitations, our study demonstrated significant disparities by the risk factors associated with the prevalence of hypertension and its comorbidities across multiple cities in China. Our analysis results provided public health decision makers that specific and differential attention should be paid to a specific population in a specific geographical region so that medical resources can be allocated rationally and effectively. Our analysis could also be leveraged by public health practitioners to offer different disease prevention plan for population who had different risk factors of hypertension and its comorbidities.
Acknowledgements
In particular, we would like to thank Chengdong Xu and Zhoupeng Ren at IGSNRR (Institute of Geographic Sciences and Natural Resources Research), Chinese Academy of Sciences and Jixia Huang at Beijing Forestry University for making valuable suggestions. This work was supported by National Major Research Program of China (Grant No. 2016YFC1200702), the Key Research Program of the Chinese Academy of Sciences (Grant NO. ZDRW-XH-2017-3), National Natural Science Foundation of China (Grant No.71603253, 71621002, 91546112, 71402177), and the Early Career Development Award of SKLMCCS(Y3S9021F37).
Competing Interests
The authors have declared that no competing interest exists.
References
1. WHO. Global status report on noncommunicable diseases 2014. 2014.
2. Millett C, Agrawal S, Sullivan R, Vaz M, Kurpad A, Bharathi AV. et al. Associations between Active Travel to Work and Overweight, Hypertension, and Diabetes in India: A Cross-Sectional Study. PLoS Med. 2013;10:e1001459
3. Parekh AK, Barton MB. THe challenge of multiple comorbidity for the us health care system. JAMA. 2010;303:1303-4
4. Edelmann F, Stahrenberg R, Gelbrich G, Durstewitz K, Angermann CE, Dungen HD. et al. Contribution of comorbidities to functional impairment is higher in heart failure with preserved than with reduced ejection fraction. Clin Res Cardiol. 2011;100:755-64
5. Chow CK, Teo KK, Rangarajan S. et al. PRevalence, awareness, treatment, and control of hypertension in rural and urban communities in high-, middle-, and low-income countries. JAMA. 2013;310:959-68
6. Fuentes R, Ilmaniemi N, Laurikainen E, Tuomilehto J, Nissinen A. Hypertension in developing economies: a review of population-based studies carried out from 1980 to 1998. J Hypertens. 2000;18:521-9
7. Paeratakul S, Lovejoy JC, Ryan DH, Bray GA. The relation of gender, race and socioeconomic status to obesity and obesity comorbidities in a sample of US adults. Int J Obes Relat Metab Disord. 2002;26:1205-10
8. Mannino DM, Thorn D, Swensen A, Holguin F. Prevalence and outcomes of diabetes, hypertension and cardiovascular disease in COPD. Eur Respir J. 2008;32:962-9
9. WHO. World health statistics 2013. 2013.
10. Jiang B, Liu H, Ru X, Zhang H, Wu S, Wang W. Hypertension Detection, Management, Control and Associated Factors Among Residents Accessing Community Health Services In Beijing. Sci Rep. 2014:4
11. Murai S, Tanaka S, Dohi Y, Kimura G, Ohte N. The prevalence, characteristics, and clinical significance of abnormal albuminuria in patients with hypertension. Sci Rep. 2014:4
12. Chen X, Wei W, Zou S, Wu X, Zhou B, Fu L. et al. Trends in the Prevalence of Hypertension in Island and Coastal Areas of China: A Systematic Review With Meta-Analysis. Am J Hypertens. 2014
13. Ma L, Li M, Wang H, Li Y, Bai B. High prevalence of cardiovascular risk factors in patients with moderate or severe psoriasis in northern China. Arch Dermatol Res. 2014;306:247-51
14. He J, Gu D, Chen J, Wu X, Kelly TN, Huang J-f. et al. Premature deaths attributable to blood pressure in China: a prospective cohort study. The Lancet. 2009;374:1765-72
15. Lu Q-B, Zhang X-A, Wo Y, Xu H-M, Li X-J, Wang X-J. et al. Circulation of Coxsackievirus A10 and A6 in Hand-Foot-Mouth Disease in China, 2009-2011. Plos One. 2012:7
16. Wang RJ, Lu LJ, Jin LB, Li HY, Ren GS, Wu KN. et al. Clinicopathologic features of breast cancer patients with type 2 diabetes mellitus in southwest of China. Med Oncol. 2014;31:788
17. Wang X, Bots ML, Yang F, Hoes AW, Vaartjes I. Prevalence of hypertension in China: a systematic review and meta-regression analysis of trends and regional differences. J Hypertens. 2014 doi: 10.1097/HJH.0000000000000252
18. Lu Y, Lu M, Dai H, Yang P, Smith-Gagen J, Miao R. et al. Lifestyle and Risk of Hypertension: Follow-Up of a Young Pre-Hypertensive Cohort. International journal of medical sciences. 2015;12:605
19. Roger VL, Go AS, Lloyd-Jones DM, Benjamin EJ, Berry JD, Borden WB. et al. Heart disease and stroke statistics-2012 update: a report from the American Heart Association. Circulation. 2012;125:e2-e220
20. Sorrentino G, Migliaccio R, Bonavita V. Treatment of vascular dementia: the route of prevention. Eur Neurol. 2008;60:217-23
21. Mathers CD, Loncar D. Projections of global mortality and burden of disease from 2002 to 2030. PLoS Med. 2006;3:e442
22. International Diabetes Federation. IDF Diabetes Atlas, 6th edn. Brussels, Belgium: International Diabetes Federation. 2013
23. Yang SH, Dou KF, Song WJ. Prevalence of diabetes among men and women in China. N Engl J Med. 2010;362:2425-6 author reply 6
24. Alhyas L, McKay A, Majeed A. Prevalence of type 2 diabetes in the States of the co-operation council for the Arab States of the Gulf: a systematic review. Plos One. 2012;7:e40948
25. Tarride JE, Lim M, DesMeules M, Luo W, Burke N, O'Reilly D. et al. A review of the cost of cardiovascular disease. Can J Cardiol. 2009;25:e195-202
26. Liu J, Ma J, Wang J, Zeng DD, Song H, Wang L. et al. Comorbidity analysis according to sex and age in hypertension patients in China. International journal of medical sciences. 2016;13:99
27. Callender T, Woodward M, Roth G, Farzadfar F, Lemarie J-C, Gicquel S. et al. Heart Failure Care in Low- and Middle-Income Countries: A Systematic Review and Meta-Analysis. PLoS Med. 2014;11:e1001699
28. Burch D. Heart Failure: Gaps in Knowledge and Failures in Treatment. PLoS Med. 2014;11:e1001702
29. Xu F, Ware RS, Tse LA, Wang Y, Wang Z, Hong X. et al. Joint associations of physical activity and hypertension with the development of type 2 diabetes among urban men and women in Mainland China. Plos One. 2014;9:e88719
30. Lin JD, Wu TY, Lin LP, Hsu SW, Liu CT, Wu CL. An exploratory study of health behaviors and the risks for triple H (hypertension, hyperlipidemia, and hyperglycemia) in young adults with disabilities between 20 and 39 years of age. Res Dev Disabil. 2013;34:3211-7
31. Willard-Grace R, DeVore D, Chen EH, Hessler D, Bodenheimer T, Thom DH. The effectiveness of medical assistant health coaching for low-income patients with uncontrolled diabetes, hypertension, and hyperlipidemia: protocol for a randomized controlled trial and baseline characteristics of the study population. BMC Fam Pract. 2013;14:27
32. Chuang CS, Yang TY, Muo CH, Su HL, Sung FC, Kao CH. Hyperlipidemia, statin use and the risk of developing depression: a nationwide retrospective cohort study. Gen Hosp Psychiatry. 2014
33. Parikh NH, Parikh PK, Kothari C. Indigenous plant medicines for health care: treatment of Diabetes mellitus and hyperlipidemia. Chin J Nat Med. 2014;12:335-44
34. Castilla-Guerra L, Fernandez-Moreno Mdel C, Alvarez-Suero J. Secondary stroke prevention in the elderly: new evidence in hypertension and hyperlipidemia. Eur J Intern Med. 2009;20:586-90
35. Polymeris A, Karoutsou E, Michalakis K. The impact of bariatric surgery procedures on type 2 diabetes, hyperlipidemia and hypertension. Hellenic J Cardiol. 2013;54:212-7
36. Ricci C, Gaeta M, Rausa E, Macchitella Y, Bonavina L. Early impact of bariatric surgery on type II diabetes, hypertension, and hyperlipidemia: a systematic review, meta-analysis and meta-regression on 6,587 patients. Obes Surg. 2014;24:522-8
37. Channanath AM, Farran B, Behbehani K, Thanaraj TA. Impact of hypertension on the association of BMI with risk and age at onset of type 2 diabetes mellitus: age- and gender-mediated modifications. Plos One. 2014;9:e95308
38. Reynolds K, Gu D, Muntner P, Wu X, Chen J, Huang G. et al. Geographic variations in the prevalence, awareness, treatment and control of hypertension in China. J Hypertens. 2003;21:1273-81
39. Lv J, Neal B, Ehteshami P, Ninomiya T, Woodward M, Rodgers A. et al. Effects of Intensive Blood Pressure Lowering on Cardiovascular and Renal Outcomes: A Systematic Review and Meta-Analysis. PLoS Med. 2012;9:e1001293
40. Maimaris W, Paty J, Perel P, Legido-Quigley H, Balabanova D, Nieuwlaat R. et al. The Influence of Health Systems on Hypertension Awareness, Treatment, and Control: A Systematic Literature Review. PLoS Med. 2013;10:e1001490
41. Muehlenbachs A, Mutabingwa TK, Edmonds S, Fried M, Duffy PE. Hypertension and Maternal-Fetal Conflict during Placental Malaria. PLoS Med. 2006;3:e446
42. Shuaib FM, Durant RW, Parmar G, Brown TM, Roth DL, Hovater M. et al. Awareness, treatment and control of hypertension, diabetes and hyperlipidemia and area-level mortality regions in the Reasons for Geographic and Racial Differences in Stroke (REGARDS) study. J Health Care Poor Underserved. 2012;23:903-21
43. Wang W. et al. Hypertension management guide in China. 2014.
44. Papoulis A. Bayes' Theorem in Statistics. Probability, Random Variables, and Stochastic Processes. 2nd Edition ed. New York: McGraw-Hill. 1984
45. Spiegelhalter D, Myles J, Jones D, Abrams K. Bayesian methods in health technology assessment: a review. Health Technology Assessment. 2000;4:130
46. Elderd BD, Dukic VM, Dwyer G. Uncertainty in predictions of disease spread and public health responses to bioterrorism and emerging diseases. Proceedings of the National Academy of Sciences. 2006;103:15693-7
47. ZENG G, THACKER SB, HU Z, LAI X, WU G. An Assessment of the use of Bayes' Theorem for Forecasting in Public Health: the Case of Epidemic Meningitis in China. International Journal of Epidemiology. 1988;17:673-9
48. Wang JF, Li XH, Christakos G, Liao YL, Zhang T, Gu X. et al. Geographical Detectors-Based Health Risk Assessment and its Application in the Neural Tube Defects Study of the Heshun Region, China. International Journal of Geographical Information Science. 2010;24:107-27
49. Wang J-F, Zhang T-L, Fu B-J. A measure of spatial stratified heterogeneity. Ecological Indicators. 2016;67:250-6
50. Zhou Y, Du S, Su C, Zhang B, Wang H, Popkin BM. The food retail revolution in China and its association with diet and health. Food Policy. 2015;55:92-100
51. Sun Y, Jiang CQ, Cheng KK, Zhang WS, Leung GM, Lam TH. et al. Fruit and Vegetable Consumption and Cardiovascular Risk Factors in Older Chinese: The Guangzhou Biobank Cohort Study. Plos One. 2015:10
52. Zhen D, Liu L, Guan C, Zhao N, Tang X. High prevalence of vitamin D deficiency among middle-aged and elderly individuals in northwestern China: Its relationship to osteoporosis and lifestyle factors. Bone. 2015;71:1-6
53. Jiang X, Zhang L, Xiong C, Wang R. Transportation and Regional Economic Development: Analysis of Spatial Spillovers in China Provincial Regions. Netw Spat Econ. 2015:1-22
Author contact
![]() Corresponding author
Corresponding author
Citation styles
APA
Wang, J., Ma, J.J., Liu, J., Zeng, D.D., Song, C., Cao, Z. (2017). Prevalence and Risk Factors of Comorbidities among Hypertensive Patients in China. International Journal of Medical Sciences, 14(3), 201-212. https://doi.org/10.7150/ijms.16974.
ACS
Wang, J.; Ma, J.J.; Liu, J.; Zeng, D.D.; Song, C.; Cao, Z. Prevalence and Risk Factors of Comorbidities among Hypertensive Patients in China. Int. J. Med. Sci. 2017, 14 (3), 201-212. DOI: 10.7150/ijms.16974.
NLM
Wang J, Ma JJ, Liu J, Zeng DD, Song C, Cao Z. Prevalence and Risk Factors of Comorbidities among Hypertensive Patients in China. Int J Med Sci 2017; 14(3):201-212. doi:10.7150/ijms.16974. https://www.medsci.org/v14p0201.htm
CSE
Wang J, Ma JJ, Liu J, Zeng DD, Song C, Cao Z. 2017. Prevalence and Risk Factors of Comorbidities among Hypertensive Patients in China. Int J Med Sci. 14(3):201-212.
This is an open access article distributed under the terms of the Creative Commons Attribution (CC BY-NC) License. See http://ivyspring.com/terms for full terms and conditions.