Impact Factor ISSN: 1449-1907

 Global reach, higher impact
Int J Med Sci 2014; 11(12):1228-1233. doi:10.7150/ijms.10008 This issue Cite
Short Research Communication
Detection of Platelet-Monocyte Aggregates by the ADAM® Image Cytometer
Bo Kyeung Jung1#, Chi Hyun Cho1#, Kyung Chul Moon1, Dae sung Hur2, Jeong-Ah Yoon1, Soo-Young Yoon1 ![]()
1. Department of Laboratory Medicine, College of Medicine, Korea University Guro Hospital, Seoul 152-703, South Korea
2. Nanoentek Incorp., Seoul, Korea
# These authors contributed equally to this study.
Received 2014-6-30; Accepted 2014-8-31; Published 2014-9-18
Abstract
Background: Inappropriate platelet activation is known to be associated with various thrombotic disorders. Platelet-monocyte aggregates (PMAs), whose formation is mediated by platelet surface P-selectin (CD62P), can be used as a reliable marker to detect platelet activation. Previous studies have generally detected PMAs through flow cytometry-based approaches. Recently, the ADAM® image cytometer (Nanoentek Inc., Seoul, Korea) was developed for image-based cellular analysis. In this study, we detected PMAs with the ADAM® cytometer, evaluated the reproducibility of the measurements made by the ADAM® cytometer, and compared the abilities of the ADAM® cytometer and a flow cytometric assay to detect PMAs.
Methods: Whole blood samples were collected from patients. Within 5 minutes of collection, anticoagulated whole blood samples were fixed in 10% paraformaldehyde and 5% glyoxal. Nineteen clinical specimens were collected; each was analyzed three times with the ADAM® cytometer in order to assess the reproducibility of its measurements. To compare the ability of the ADAM® cytometer with that of a flow cytometer to detect PMAs, each cytometer was used for 23 clinical samples and the correlation of the measurements was determined.
Results: The PMA measurements made by the ADAM® cytometer showed good reproducibility (CV < 10% for all specimens). Moreover, the PMA measurements made by the ADAM® cytometer exhibited a high correlation with those made by a flow cytometric assay (R = 0.944).
Conclusions: The ADAM® cytometer is a suitable alternative method to the flow cytometry-based assays. Since the ADAM cytometer does not need specialized instrument knowledge or software proficiency (unlike flow cytometry), the ADAM® cytometer can be used as a rapid and reliable POCT device to measure platelet activation in peripheral blood. This, in turn, will provide valuable information regarding patient propensities to thrombotic diseases.
Keywords: image cytometer, ADAM®, platelet-monocyte aggregates, platelet activation
INTRODUCTION
Platelet activation is associated with various thrombotic disorders, such as atherosclerosis, coronary vascular disease, cerebrovascular disease, peripheral vascular disease, and deep vein thrombosis (1). Thus, platelet activation status has been proposed as a suitable metric for the identification of patients who are at high risk for these diseases.
Platelet activation may be detected by changes in platelet shape, the level of platelet aggregation, and the levels of platelet metabolic products (1). However, no ideal method for measuring platelet activation has yet been established. Changes in platelet shape can be easily influenced by venipuncture and incubation temperature (2); moreover, the aggregation level of platelets has been shown to be an inaccurate measure of in vivo platelet activity (3). The plasma levels of the contents of platelet α-granules, such as β-thromboglobulin and platelet factor 4, are also not as reliable as in vivo platelet activation markers since platelet activation can be induced in vitro through centrifugation and the addition of anticoagulants during the preparation of plasma samples (4,5).
Platelet surface P-selectin (CD62P) is a membrane-associated protein that is commonly used as a marker for in vivo platelet activation in flow cytometric assays (4). However, several studies have demonstrated a loss of platelet surface CD62P expression soon after an activating event, which is followed by a concomitant increase in the level of soluble (s) plasma P-selectin (4,6,7). Thus, flow cytometric analysis of CD62P is an unsuitable measurement for platelet activation in clinical settings, in which a chronic stimulus is generally present (4).
For these reasons, the development of a rapid, accurate, and affordable method to detect and quantify platelet activation is necessary. Several studies have revealed that platelet-monocyte aggregates (PMAs), whose formation is mediated by platelet surface P-selectin (CD62P), could be an alternative, sensitive, and reliable marker for platelet activation (8-10). Previous studies have detected platelet-monocyte aggregates by flow cytometric assays (4).
Recently, the ADAM® image cytometer was developed for cellular analysis using images that are generally captured on slides or microfabricated chips (11). The ADAM® cytometer detects cellular components with fluorescent dyes, similar to a flow cytometer. However, unlike a flow cytometer, the ADAM® cytometer can detect stationary cellular samples, making it possible to observe cells or cellular aggregates through recognition software. However, to the best of our knowledge, the ADAM® cytometer has not yet been used for the detection of PMAs.
The aims of this study were: 1) to evaluate the reproducibility of PMA measurements made by the ADAM® cytometer, and 2) to determine the extent to which the ADAM® measurements correlate with flow cytometry measurements.
MATERIALS AND METHODS
Blood specimens
This study was approved by the Institutional Review Board of Korea University Hospital in May 2010. Whole blood specimens were collected from patients who were receiving treatment at Korea University Ansan Hospital from June 2010 to August 2010. All blood samples were obtained between 6:00 a.m. and 9:00 a.m. Venipuncture of a forearm vein was performed with minimal stasis to avoid artificial aggregate forming. A syringe with a 22-gauge needle was used for collection.
Flow Cytometric Assay
The pretreatment protocol for blood specimens is given in Table 1. The time required to process specimens for flow cytometry was approximately 1 hour and 30 minutes. Processed specimens were analyzed using a Cytomics FC500 flow cytometer (Beckman Coulter, Brea, CA, USA) and CXP software. Anti-CD45-PC5, anti-CD14-PE, and anti-CD41-FITC antibodies (Becton Dickinson, NJ, USA) were used for immunostaining.
Pretreatment protocol used in this study for the flow cytometric assay
| 1. Prepare whole blood from anticoagulated human blood |
| 2. Add 10 μl of 10% paraformaldehyde and 10 μl of 5% glyoxal to 500 μl of whole blood for fixation |
| 3. Incubate for 10 min at room temperature |
| 4. Add 540 μl of 0.2% glycine to 60 μl of fixed whole blood |
| 5. Add 8 μl of CD41-FITC, 8 μl of CD14-PE, and 8 μl of CD45-PC5 to 200 μl of the fixed and diluted whole blood |
| 6. Incubate for 30 min in the dark at room temperature |
| 7. Lyse with 600 μl of Versalyse for 15 min |
| 8. Add 3176 μl of PBS and mix |
| 9. Centrifuge at 120 g for 10 min and discard supernatant |
| 10. Add 500 μl of PBS, 10 μl of 10% paraformaldehyde, and 10 μl of 5% glyoxal; resuspend with vortexing |
| 11. Perform flow cytometric analysis |
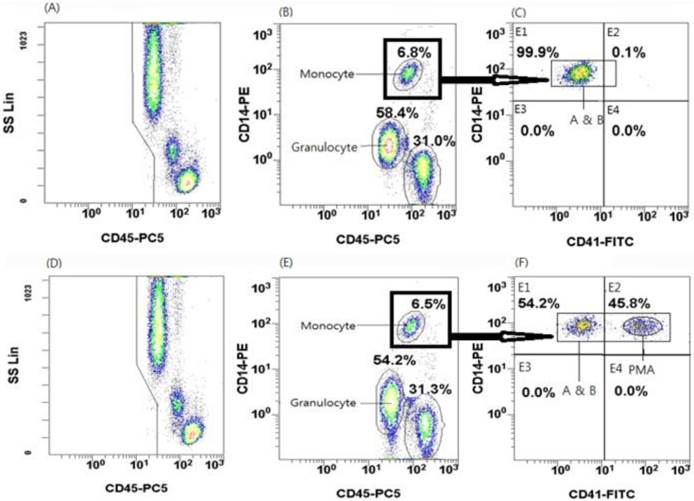
The gating strategy to identify platelet-monocyte aggregates (PMAs) is shown in Figure 1. Flow cytometric analysis of negative controls is shown in Figure 1(A), 1(B), and 1(C), whereas flow cytometric analysis of a patient sample (the first to be analyzed) is shown in Figure 1(D), 1(E), and 1(F). The numbers labeling the gates represent the percentages of events inside each gate. The target cell populations gated in the SSC and CD45-PC5 plot were transferred into the CD14-PE and CD45-PC5 plot. In this plot, monocytes, granulocytes, and lymphocytes were differentiated from one another according to the expression levels of CD14 (a monocyte marker) and CD45 (a ubiquitous marker of white blood cells). Among these cells, monocytes were identified as CD14high and CD45high cells. Then, CD14high and CD45high cells (gate B) were plotted on a CD14 vs. CD41 graph [Figure 1(C) and 1(F)], whereas the CD14high and the CD41high subpopulation was considered to represent PMAs, as shown in a previous study (11). The patient sample shown in Figure 1(F) exhibited 45.8% PMAs.
Flow cytometric features of leukocytes, monocytes, and platelet-monocyte aggregates (PMAs). Flow cytometric analysis of negative controls is shown in (A), (B), and (C), whereas flow cytometric analysis of a patient sample (the first to be analyzed) is shown in (D), (E), and (F). (A) All events were acquired by flow cytometry after lysing RBCs in whole blood specimens. In this plot, monocytes are characterized by high CD45 expression and intermediate side scatter. (B) All events shown in (A) were represented in a CD14 and CD45 plot. The monocytic region is characterized by high CD14 and CD45 expression (region within black box). (C) All events within black box in (B) were represented in a CD14 and CD41 plot. Events characterized by high expression of both CD14 and CD41 designate the PMAs.
ADAM® Image Cytometer
The ADAM® image cytometer (Nanoentek) is equipped with green and blue light emitting diodes (LEDs) for fluorescence excitation, a charge-coupled device (CCD) camera for collecting emitted light, and an autofocus feature. An important innovation implemented in the ADAM® image cytometer is the automated movement of the chip, which is controlled by the instrument stage (11). The disposable chips are available in various channel depths to enable the measurement of bacteria, yeast, sperm cells, blood cells, and somatic cells. The analysis software provides information regarding cell size and intensity for concentrations up to 104-106 cells/ml (11). Overall, 80 images were captured in order to reduce sample-to-sample variation (7).
The pretreatment protocol for blood specimens is shown in Table 2. The processing time to prepare samples for measurement with the ADAM® image cytometer was approximately 1 hour and 20 minutes. Fluorescent reagents such as CD45-PC5, CD14-PE, and CD41-FITC (Becton Dickinson, NJ, USA) were used to enhance the detection of platelets and monocytes. For lysing RBCs, the ImmunoPrep Reagent System (Beckman Coulter, Brea, CA, USA) was used, since this system requires only 30 seconds to lyse RBCs. In contrast, the Versalyse system (Immunotech, Marseille, France) requires 20 minutes to lyse RBCs; thus, PE fluorescence can decrease over time. Monocytes were enriched by centrifugation. A total processed specimen volume of approximately 20 μl was injected into the ADAM® chip.
Pretreatment protocol used in this study for the ADAM® image cytometer
| 1. Prepare whole blood from anticoagulated human blood |
| 2. Add 10 μl of 10% paraformaldehyde and 10 μl of 5% glyoxal to 500 μl of whole blood for fixation |
| 3. Incubate for 10 min at room temperature |
| 4. Add 40 μl of CD14-PE, 40 μl of CD41-FITC, and 40 μl of CD45-PC5 to 100 μl of the fixed whole blood |
| 5. Incubate for 30 min in the dark at room temperature |
| 6. Lyse red blood cells using the ImmunoPrep Reagent System |
| 7. Centrifuge for 10 min at 120 g at room temperature |
| 8. Remove the supernatant by aspiration |
| 9. Resuspend the cell pellet in 10 ml of PBS |
| 10. Repeat step 7 |
| 11. Remove the supernatant by aspiration, resuspend the cell pellet in 100 μl of PBS, and add 2 μl of 10% paraformaldehyde and 2 μl of 5% glyoxal |
| 12. Load 20 μl of the specimen into the ADAM® image cytometer |
| 13. Incubate for 3 min at room temperature in the dark |
| 14. Perform the ADAM® analysis |
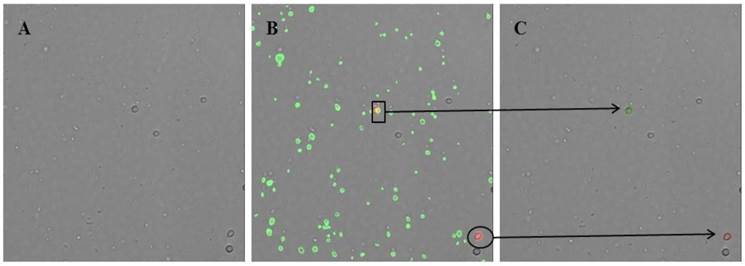
The recognition software algorithm was optimized to eliminate imaging errors such as fluorescent antibody aggregates, stained debris, and double images. Without this optimization, the software program recognizes each particle that is stained with CD14-PE or is attached to red fluorescence protein (RFP), including fluorescent antibody aggregates and stained debris. To solve these technical difficulties with the imaging, the algorithm was modified such that cells are first recognized in the bright-field image screen. Then, this image is merged with an RFP screen. Particles are recognized as monocytes only when a particle is detected both in the bright-field image screen and in the RFP screen (Fig. 2). With this improvement in the program algorithm, erroneous images could be significantly reduced and accounted for less than 5% of the total monocytes.
Image screen captured by the modified recognition software algorithm of the ADAM® cytometer. (A) Image screen in bright field. Cells are first recognized in the bright field image screen. (B) Image screen merged with the red fluorescence protein (RFP) and green fluorescence protein (GFP) screens. Green fluorescence identifies particles attached to CD41-FITC, whereas red fluorescence identifies particles attached to CD14-PE. (C) Final image screen readout on the ADAM® cytometer. The green circle shows a platelet-monocyte aggregate (box, B), whereas the red circle shows a monocyte (ellipse, B).
During the time required to process the specimens, the number of PMAs could potentially increase. To minimize these spurious increases and more accurately determine the platelet activation status, an appropriate fixation method is needed. In a preliminary study, we compared three different modifications from the fixation method used in the flow cytometric assay (12) to determine the optimal fixative condition. The three fixatives tested were: (1) 12.5% paraformaldehyde, (2) 25% paraformaldehyde, and (3) 10% paraformaldehyde with 5% glyoxal. The most stable level of platelet-monocyte aggregates was achieved with 10% paraformaldehyde and 5% glyoxal, which stabilized the level of platelet-monocyte aggregates for 2 hours (data not shown). Cells were fixed in this combination of reagents immediately after the blood draw (see the pretreatment protocol in Table 2).
Analytical methods
To evaluate the reproducibility of the measurements made by the ADAM® image cytometer in whole blood specimens, the % of PMAs was determined three times using the ADAM® image cytometer for each specimen. The coefficient of variation (CV) was also assessed. To compare the ADAM® measurements with those obtained by flow cytometry, the Pearson's correlation coefficient was determined using a scatter diagram. All analyses were performed using Excel (Microsoft Corporation, Redmond, WA, USA).
RESULTS
Specimen characteristics
In total, 24 whole blood specimens were analyzed in this study. The specimens were collected from 24 patients (16 males and 8 females). The ages of the patients ranged from 5 to 70 years (median, 49 years). To examine the extent of correlation between measurements made with the ADAM® image cytometer vs a flow cytometer, 23 sodium citrate-anticoagulated whole blood specimens from 23 patients were used. Of these, 19 whole blood specimens were also used to evaluate the reproducibility of the measurements made by the ADAM® image cytometer. Out of the 24 specimens examined, the PMA measurements made by the ADAM® image cytometer ranged from 1.94 to 60.38%, whereas those made by FCM ranged from 1.62 to 50.37%.
Reproducibility of ADAM® measurements
Nineteen blood specimens were evaluated and categorized into three different subgroups according to their % of PMAs (Table 3). In each subgroup, the CV was less than 10% (Table 3). For three of the nineteen specimens, the CVs of the flow cytometric measurements were also determined. The means (CVs) of the % of PMAs as determined by FCM in these three specimens were 2.88% (10.42%), 26.24% (5.68%), and 44.53% (12.40%), respectively.
Coefficient of variation ranges of measurements made by the ADAM® image cytometer according to platelet-monocyte aggregate subgroup
| PMA (%) | No. of samples | CV (%) |
|---|---|---|
| <20 | n = 7 | 2.75-9.72 |
| 20-40 | n = 7 | 1.99-9.95 |
| >40 | n = 5 | 1.54-4.33 |
Comparison of the ADAM® Image Cytometer with a Flow Cytometric Assay
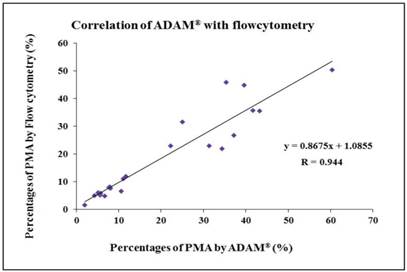
Twenty-three blood samples were evaluated. The measurements made by the ADAM® image cytometer correlated well with those made using the flow cytometric assay to detect PMAs (R = 0.944) (Fig. 3).
Correlation between PMA measurements obtained with the ADAM® cytometer vs those obtained with a flow cytometer. The ADAM® measurements correlated well with the flow cytometric measurements (R = 0.944).
DISCUSSION
Platelet-leukocyte aggregates are a well-known marker of platelet activation. Many studies have demonstrated that the aggregating interaction between platelets and leukocytes is a causative mechanism in thrombogenesis (13). Moreover, patients with acute myocardial infarction have been shown to have higher levels of PMAs compared with normal controls (9,14,15). In addition, the amount of platelet-leukocyte aggregates has been reported to increase significantly in acute stroke patients, especially those who had previous infections (16). Activated platelets bind to polymorphonuclear leukocytes or monocytes through the interaction of P-selectin, which is expressed by platelets, and P-selectin glycoprotein ligand 1 (PSGP-1), which is expressed by white blood cells (9,13,16). However, the increase in circulating neutrophil-platelet aggregates has been shown to be significantly less than the increase in PMAs; moreover, the neutrophil-platelet aggregate counts return to baseline earlier than the PMA counts (4,9). Therefore, PMAs are the most appropriate aggregates to measure for determining platelet activation status (4).
Introduced in the early 1990s, the image cytometer has been used to analyze cells by capturing images and analyzing them with specific software. In particular, the ADAM® image cytometer, which uses fluorescent dyes, has opened the field to various applications such as lymphocyte counting and estimation of cell viability (11). In this study, we evaluated the reproducibility of the measurements made by the ADAM® image cytometer (Nanoentek, Inc., Seoul, South Korea). We also determined the extent to which the measurements of PMAs made with the ADAM cytometer correlated with those made using the flow cytometric assay. Importantly, we performed optimization of fixative conditions in order to achieve a stable level of PMAs throughout the specimen analysis protocol.
The CVs of the measurements made by the ADAM® cytometer (using 19 specimens with various percentages of PMAs) were all within 10%. Since the CVs of the flow cytometry measurements ranged from 5.68% to 12.40%, our study indicates that the ADAM® cytometer exhibits relatively good reproducibility regarding the detection of PMAs in whole blood. In addition, the Pearson correlation coefficient between the PMA measurements made by the ADAM® cytometer vs those made by flow cytometry was 0.944, showing good correlation between the two techniques.
The processing time required to use the ADAM® cytometer is not significantly different from that of the flow cytometric assay (Table 1). Flow cytometry is generally performed on multiple samples to obtain information on a large population of cells, and is undertaken in a high-throughput mode. However, flow cytometry requires experts who are proficient in instrument and software management, which can increase the time required to obtain results. In contrast, the ADAM® image cytometer provides a simpler interface, is easy to handle because of its tabletop size, and yields rapid results. In addition, the ADAM® cytometer can provide more morphological information and can be used even for small-sample analysis. Moreover, the ADAM® image cytometer is less expensive (US $12,000-15,000) than a flow cytometer, and is thus suited to use in peripheral laboratories. The ADAM® image cytometer could be used in clinical settings as a POCT method for screening various thrombotic diseases, as well as for developing antiplatelet medications in clinical research.
In conclusion, this study evaluated the ability of the ADAM® image cytometer to determine the percentage of PMAs, which is indicative of platelet activation status. This study found that the measurements made by the ADAM® cytometer had adequate reproducibility and correlated well with those made by the flow cytometric assay. Thus, the ADAM® image cytometer can potentially be used as a reliable and rapid POCT device for detecting PMAs in various clinical applications, and also promises to have a positive impact on various clinical outcomes associated with thrombotic diseases.
Acknowledgements
This research was supported by Basic Science Research Program through the National Research Foundation of Korea (NRF) funded by the Ministry of Science, ICT & Future Planning (No. 2008-0061891).
Conflict of Interest
The author (Daesung Hur) of this article serves on the QA division of Nanoentek, which is developing products related to the research being reported. The terms of this arrangement have been reviewed and approved by Korea University Ansan Hospital in accordance with its policy on objectivity in research.
References
1. Kamath S, Blann AD, Lip GY. Platelet activation: assessment and quantification. Eur Heart J. 2001;22:1561-1571
2. Bamberg E, Bauer O, Herrmann W. et al. [Primary shape change of platelets in vitro (author's transl)]. Blut. 1978;37:327-339
3. Chen YC, Wu KK. A comparison of methods for the study of platelet hyperfunction in thromboembolic disorders. Br J Haematol. 1980;46:263-268
4. Lane DA, Ireland H, Wolff S, Ranasinghe E, Dawes J. Detection of enhanced in vivo platelet alpha-granule release in different patient groups--comparison of beta-thromboglobulin, platelet factor 4 and thrombospondin assays. Thromb Haemost. 1984;52:183-187
5. Cella G, Scattolo N, Cappellato MG, Girolami A, Strauss WE, Sasahara AA. Platelet factor 4 release induced by intravenous administration of heparin. Folia Haematol Int Mag Klin Morphol Blutforsch. 1985;112:165-174
6. Chong BH, Murray B, Berndt MC, Dunlop LC, Brighton T, Chesterman CN. Plasma P-selectin is increased in thrombotic consumptive platelet disorders. Blood. 1994;83:1535-1541
7. Michelson AD, Barnard MR, Krueger LA, Valeri CR, Furman MI. Circulating monocyte-platelet aggregates are a more sensitive marker of in vivo platelet activation than platelet surface P-selectin: studies in baboons, human coronary intervention, and human acute myocardial infarction. Circulation. 2001;104:1533-1537
8. Yip C, Ignjatovic V, Attard C, Monagle P, Linden MD. First report of elevated monocyte-platelet aggregates in healthy children. PLoS One. 2013;8:e67416
9. Linden MD, Furman MI, Frelinger AL 3rd, Fox ML, Barnard MR, Li Y, Przyklenk K, Michelson AD. Indices of platelet activation and the stability of coronary artery disease. J Thromb Haemost. 2007;5:761-765
10. Kim JS, Hur D, Hwang JK, Chung C, Chang JK. Ongoing development of image cytometers. Bioanalysis. 2010;2:1755-1765
11. Brambilla M, Camera M, Colnago D, Marenzi G, De Metrio M, Giesen PL. et al. Tissue factor in patients with acute coronary syndromes: expression in platelets, leukocytes, and platelet-leukocyte aggregates. Arterioscler Thromb Vasc Biol. 2008;28:947-953
12. Villmow T, Kemkes-Matthes B, Matzdorff AC. Markers of platelet activation and platelet-leukocyte interaction in patients with myeloproliferative syndromes. Thrombosis Research. 2002;108:139-145
13. Shantsila E, Lip GY. The role of monocytes in thrombotic disorders. Insights from tissue factor, monocyte-platelet aggregates and novel mechanisms. Thromb Haemost. 2009;102:916-924
14. Furman MI, Benoit SE, Barnard MR, Valeri CR, Borbone ML, Becker RC. et al. Increased platelet reactivity and circulating monocyte-platelet aggregates in patients with stable coronary artery disease. J Am Coll Cardiol. 1998;31:352-358
15. Furman MI, Barnard MR, Krueger LA, Fox ML, Shilale EA, Lessard DM. et al. Circulating monocyte-platelet aggregates are an early marker of acute myocardial infarction. J Am Coll Cardiol. 2001;38:1002-1006
16. Zeller JA, Lenz A, Eschenfelder CC, Zunker P, Deuschl G. Platelet-leukocyte interaction and platelet activation in acute stroke with and without preceding infection. Arterioscler Thromb Vasc Biol. 2005;25:1519-1523
Author contact
![]() Corresponding author: Soo-Young Yoon, MD, PhD, Department of Laboratory Medicine, College of Medicine, Korea University Guro Hospital, 148, Gurodong-ro, Guro-gu, Seoul, 152-703, Korea. Tel: 02-2626-3246, Fax: 02-2626-1465, E-mail: ysy5613or.kr
Corresponding author: Soo-Young Yoon, MD, PhD, Department of Laboratory Medicine, College of Medicine, Korea University Guro Hospital, 148, Gurodong-ro, Guro-gu, Seoul, 152-703, Korea. Tel: 02-2626-3246, Fax: 02-2626-1465, E-mail: ysy5613or.kr