International Journal of Medical Sciences 3.2
Impact Factor
ISSN: 1449-1907
Impact Factor
ISSN: 1449-1907

 Global reach, higher impact
Int J Med Sci 2014; 11(4):349-355. doi:10.7150/ijms.7104 This issue Cite
Research Paper
The Relationships between Thyroid Hormones and Thyroid-stimulating Hormone with Lipid Profile in Euthyroid Men
Kok-Yong Chin1, Soelaiman Ima-Nirwana1 ![]() , Isa Naina Mohamed1, Amilia Aminuddin2, Mohamad Hanapi Johari3, Wan Zurinah Wan Ngah3,4
, Isa Naina Mohamed1, Amilia Aminuddin2, Mohamad Hanapi Johari3, Wan Zurinah Wan Ngah3,4
1. Pharmacology Department, Faculty of Medicine, Universiti Kebangsaan Malaysia.
2. Physiology Department, Faculty of Medicine, Universiti Kebangsaan Malaysia.
3. Biochemistry Department, Faculty of Medicine, Universiti Kebangsaan Malaysia.
4. UKM Medical Molecular Biology Institute (UMBI), Universiti Kebangsaan Malaysia.
Received 2013-7-5; Accepted 2014-1-6; Published 2014-2-13
Citation:
Chin KY, Ima-Nirwana S, Mohamed IN, Aminuddin A, Johari MH, Ngah WZW. The Relationships between Thyroid Hormones and Thyroid-stimulating Hormone with Lipid Profile in Euthyroid Men. Int J Med Sci 2014; 11(4):349-355. doi:10.7150/ijms.7104. https://www.medsci.org/v11p0349.htm
Other stylesAbstract
Background and Aim: Alteration in lipid profile is a common observation in patients with thyroid dysfunction, but the current knowledge on the relationship between lipids and thyroid hormone levels in euthyroid state is insufficient. The current study aimed to determine the association between thyroid hormones and thyroid-stimulating hormone (TSH) with lipid profile in a euthyroid male population.
Methods: A total of 708 Chinese and Malay men aged 20 years and above were recruited in this cross-sectional study. Their blood was collected for the determination of total cholesterol (TC), low density lipoprotein cholesterol (LDL-C), high density lipoprotein cholesterol (HDL-C), triglyceride (TG), free thyroxine (FT4), free triiodothyronine (FT3) and TSH levels. The association was analyzed using multiple regression and logistic regression models with adjustment for age, ethnicity, body mass index and FT4/FT3/TSH levels.
Results: In multiple regression models, TSH was positively and significantly associated with TG (p<0.05). Free T4 was positively and significantly associated with TC, LDL-C and HDL-C (p<0.05). Free T3 was negatively and significantly associated with HDL-C (p<0.05). In binary logistic models, an increase in TSH was significantly associated with higher prevalence of elevated TG in the subjects (p<0.05), while an increase in FT4 was significantly associated with higher prevalence of elevated TC but a lower prevalence of subnormal HDL in the subjects (p<0.05). Free T3 was not associated with any lipid variables in the logistic regression (p>0.05).
Conclusions: In euthyroid Malaysian men, there are positive and significant relationships between TSH level and TG level, and between FT4 level and cholesterol levels.
Keywords: Cholesterol, Men, Thyroid hormones, Thyroid-stimulating hormone, Triglycerides.
Introduction
Thyroid hormones are recognized as catabolic hormones and they regulate various processes of metabolism (1). The relationship between thyroid hormones and lipid metabolism is clearly displayed in patients suffering from thyroid dysfunctions. Overt hypothyroid patients show elevated cholesterol and triglyceride (TG) levels while overt hyperthyroid patients show reduced lipid levels (2). These observations have been shown to extend into the subclinical hypo/hyperthyroid range (2), suggesting that apart from thyroid hormones, thyroid-stimulating hormone (TSH) exerts independent effects on lipid metabolism. Recent advancement in molecular biology has enlightened us on the potential mechanisms of thyroid hormones and TSH in regulating lipid metabolism. Thyroid hormones have been shown to induce the expressions of 3-hydroxy-3-methyl-glutaryl-CoA reductase (HMG-CoA) reductase (responsible for cholesterol synthesis) (3), low density lipoprotein receptor (LDLR) via sterol regulatory element-binding protein-2 (SREBP-2) (responsible the uptake of cholesterol) (4), lipoprotein lipase (responsible for catabolizing TG-rich lipoprotein) (5), cholesteryl ester transfer protein (responsible for high density lipoprotein (HDL) metabolism) (6) and apolipoprotein AV (which reduces the production of hepatic very low density lipoprotein (VLDL)-TG) (7). Thyroid-stimulating hormone has also been shown to induce adipogenesis (8), lipolysis (9) and increase the activity of HMG-CoA (10).
The relationship between thyroid hormones and lipid profile in the euthyroid population has garnered much interest recently, partly because hypothyroidism and hyperthyroidism are less common conditions in the general population (11). Studies have revealed that free thyroxine (FT4), free triiothyronine (FT3) and TSH are significantly associated with lipid profile in the euthyroid population regardless of gender (12, 13). However, in most of the studies, FT4, FT3 and TSH have not been measured together (14-16). Hence, it is not possible to exclude the effects of interaction between FT4, FT3 and TSH on their association with lipid profile. The effects of TSH on lipid profile have been assumed to be mediated by its effects on thyroid hormones previously. However, there is growing amount of evidence indicating that this association is partially contributed by the direct effect of TSH on lipid profile (17, 18). Additionally, a positive relationship between FT4 and lipid profile among the euthyroid population has been reported (15). This is a deviation from the traditional view that the direction of association between thyroid hormones and lipid profile is negative, as observed in the hypothyroid patients (2). This discrepancy should be examined to decide whether it is an isolated finding or it could be found in other populations.
The present study was conducted as part of the Malaysian Aging Male Study (19, 20). One of the objectives of the study was to evaluate the lipid profile of the subjects with respect to their thyroid status. We hope that the information from this study will lead to a better understanding of the relationship between thyroid hormones and TSH with lipid profile.
Materials and Methods
All subjects participated voluntarily in this cross-sectional study. They were Chinese and Malay men aged 20 years or above residing in Klang Valley (Kuala Lumpur and its surrounding area), Malaysia. The recruitment was conducted from September 2009 to September 2011, via advertisements in major newspapers, radio broadcasts, public announcements in community centers and religious places, and flyers. The inclusion and exclusion criteria were detailed in the advertisement and only subjects who fulfilled these criteria were recruited. Subjects with previous history of thyroid diseases, such as overt hyper/hypothyroidism, thyroid cancer and thyroid nodules were excluded. Subjects taking medications affecting thyroid hormone levels such as thyroid supplementation and antithyroid agents, and hypolipidemic agents like statins were also excluded. The study protocol was reviewed and approved by the Research and Ethics Committee of Universiti Kebangsaan Malaysia Medical Center. Written consent was obtained from all participating subjects after they were briefed thoroughly information pertaining to this study.
History taking and basic physical examination on the subjects were performed by qualified physicians. Their previous medical records, if available, were also examined by the physicians. The physical examination included assessment of cardiovascular and respiratory functions, and examination of the abdomen. Furthermore, we also inspected subject for signs and symptoms of overt hypo/hyperthyroidism. Since the exclusion criteria advertised had mentioned explicitly that only healthy subjects were recruited, this examination was aimed to detect any abnormality that was not noticed by the subjects themselves. The subjects answered a questionnaire on their demographic details. Their age was determined by records on their identification cards. Their ethnicity was self-declared. The height of the subjects without shoes was measured using a portable stadiometer (SECA, Hamburg, Germany) and was recorded to the nearest 0.1 cm. The weight of the subjects with light clothing but without shoes was determined using a weight scale (TANITA, Tokyo, Japan) and was recorded to the nearest 0.1 kg. The body mass index (BMI) of the subjects was calculated as per the convention: BMI .
.
The blood of the subjects was collected after an overnight fast of at least eight hours. The time for blood collection was between 0830 and 1030 on the same day of the screening session. The serum was extracted immediately and stored at -70◦C until analyzed. An ADVIA 2400 analyzer (Siemens Healthcare Diagnostics, Illinois, USA) was used to measure the levels of total cholesterol (TC), triglycerides (TG) and HDL-C based on an enzymatic method. The level of LDL-C was calculated using Friedewald's formula (21). The levels of FT3, FT4 and TSH were determined using an ADVIA Centaur analyzer (Siemens Healthcare Diagnostics, Illinois, USA) based on an immunochemiluminescent method. The interassay coefficient of variation for the assays were 0.48-0.86% for TC, 0.53-1.02% for TG, 0.56-0.79% for HDL-C, 5.34-11.50% for FT4, 1.46-2.57% for FT3, 0.37-3.37% for TSH.
Data analysis
The comparison of the basic characteristics between Chinese and Malay subjects was performed using an independent t-test. The association between TSH, FT3 and FT4 with lipid profile of the subjects was determined using a multiple regression analysis. Multivariate outliers were determined using standardized residuals of the models generated. Data with a standardized residual value of more than 3 or less than -3 were eliminated. The normality of the standardized residual was determined using the Kolmogorov-Smirnov test. The data for lipid profile were logarithm-transformed to ensure the standardized residual generated was normally distributed. The strength of the association assessed by the multiple regression analysis was indicated by the standardized regression coefficient value (β). Next, the subjects were divided according to their lipid status as having high TC (≥ 5.2 mmol/l), high TG (≥ 1.68 mmol/l), high LDL-C (≥ 2.6 mmol/l), high TC/HDL-C ratio (≥ 5.0), low HDL-C (≤ 1.03 mmol/l) or normal. These cut-off points were determined based on the Third Report of the National Cholesterol Education Program (NCEP) - Expert Panel on Detection, Evaluation and Treatment of High Blood Cholesterol in Adults (Adult Treatment Panel III; ATP III) (22). A logistic regression was performed to determine the association between TSH, FT3 and FT4 with the presence of an abnormal lipid status in the subjects. The strength of the association assessed by the logistic regression was indicated by the odds ratio (OR) with 95 % confidence interval (CI). The statistical significance was set at p < 0.05. The statistical analysis was performed using the Statistical Package for Social Sciences version 16.0 (SPSS Inc., Chicago, USA).
Results
The study originally recruited 840 male subjects. Complete demographic, anthropometric and biochemical (thyroid hormones, TSH and lipid profile) data were available for 774 subjects. Of these, 19 subjects were excluded from the analysis due to subclinical hyperthyroidism. Thus, 755 subjects with normal thyroid function (euthyroid with normal TSH level) and no abnormality on physical examination were included in the data screening. After eliminating univariate and multivariate outliers, data from 708 subjects were included in the final analysis. The subjects consisted of 55.5% Chinese and 44.5% Malay men. The two ethnic groups were similar in age, TSH, FT4, TC and TG and LDL-C levels (p>0.05), but were significantly different in other variables studied (p<0.05). The Chinese men were significantly taller, lower in body weight and BMI, and had higher FT3 and HDL-C and lower TC/HDL-C ratio compared to the Malay men (p<0.05) (Table 1). Ethnicity was adjusted for the following analyses in view of these differences. The distribution of the lipid variables was detailed in Figure 1 and Table 2.
Table 1
Characteristics of subjects.
| Variable | Malay (n=315) | Chinese (n=393) | Total (n=708) | p† |
|---|---|---|---|---|
| Age (years) | 46.93 (16.06) | 48.31 (12.99) | 47.69 (14.44) | 0.218 |
| Height (cm) | 165.7 (6.4) | 168.3 (6.2) | 167.17 (6.41) | 0.004 |
| Weight (kg) | 71.13 (13.58) | 68.39 (11.27) | 69.61 (12.42) | <0.001 |
| BMI (kg/m2) | 25.86 (4.50) | 24.12 (3.53) | 24.89 (4.08) | <0.001 |
| TSH (mIU/l) | 1.51 (0.73) | 1.48 (0.68) | 1.49 (0.700) | 0.534 |
| FT4 (pmol/l) | 16.00 (2.06) | 15.82 (1.85) | 15.90 (1.95) | 0.232 |
| FT3 (pmol/l) | 5.06 (0.53) | 5.15 (0.47) | 5.11 (0.50) | 0.017 |
| TC (mmol/l) | 5.59 (1.00) | 5.46 (0.93) | 5.51 (0.96) | 0.075 |
| TG (mmol/l) | 1.50 (0.68) | 1.43 (0.71) | 1.46 (0.70) | 0.217 |
| HDL-C (mmol/l) | 1.21 (0.25) | 1.29 (0.27) | 1.26 (0.26) | <0.001 |
| LDL-C (mmol/l) | 3.68 (0.89) | 3.50 (0.82) | 3.58 (0.86) | 0.005 |
| TC/HDL ratio | 4.76 (1.13) | 4.35 (0.94) | 4.54 (1.05) | <0.001 |
All values are expressed in mean (standard deviation).
†Comparison is made between the Chinese and the Malay subjects. P values less than 0.05 indicates significant difference between the two ethnicities.
Abbreviation: BMI=body mass index; FT3=free triiodothyronine; FT4=free thyroxine; HDL-C=high density lipoprotein cholesterol; LDL-C=low density lipoprotein cholesterol; TC=total cholesterol; TG=triglyceride; TSH=thyroid-stimulating hormone.
Table 2
Distribution of lipid variables in the study population.
| Variable | Value | Number of subject (n) | ||||||
|---|---|---|---|---|---|---|---|---|
| Mean | SD | Median | IQR | Cut-off | Below cut-off | Above cut-off | Total | |
| TC (mmol/l) | 5.51 | 0.96 | 5.40 | 1.28 | ≥ 5.20 | 262 | 446 | 708 |
| TG (mmol/l) | 1.46 | 0.70 | 1.32 | 0.94 | ≥ 1.68 | 487 | 221 | 708 |
| HDL-C (mmol/l) | 1.26 | 0.26 | 1.21 | 0.36 | ≤ 1.03 | 572 | 136 | 708 |
| LDL-C (mmol/l) | 3.58 | 0.86 | 3.53 | 1.12 | ≥ 2.60 | 83 | 625 | 708 |
| TC/HDL ratio | 4.54 | 1.05 | 4.50 | 1.60 | ≥ 5.00 | 467 | 241 | 708 |
Abbreviation: HDL-C=high density lipoprotein cholesterol; IQR=interquartile range; LDL-C=low density lipoprotein cholesterol; SD=standard deviation; TC=total cholesterol; TG=triglyceride.
Figure 1
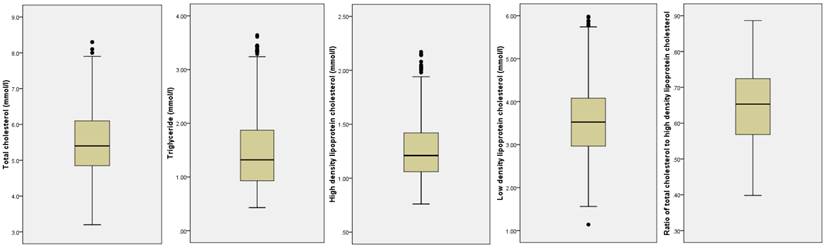
Distribution of the lipid variables in the study population.
When analyzed as continuous data, TSH showed consistently positive and significant association with TG level after multiple adjustments for age, ethnicity, BMI, FT3 and FT4 (p<0.05). Thyroid-stimulating hormone was significantly and positively associated with TC in the unadjusted model (p<0.05), but the significance was lost after adjustment for the confounding variables (p>0.05). The other lipid variables were not significantly associated with TSH (p>0.05) (Table 3). Free T4 was positively and significantly associated with TC and HDL-C levels after multiple adjustments (p<0.05). The positive association between FT4 and LDL-C was only significant after age was adjusted (p<0.05) and the significance persisted after further adjustments. Free T4 was not significantly associated with TG and TC/HDL-C ratio (p>0.05) (Table 4). Free T3 was negatively and significantly associated with HDL-C level after TSH and FT4 were adjusted (p<0.05). Free T3 was also negatively and significantly associated with TC in unadjusted model (p<0.05), but the significance was lost after multiple adjustments (p>0.05). The other lipid variables were not significantly associated with FT3 (p>0.05) (Table 5).
In the logistic regression models, a higher level of TSH was significantly associated with higher prevalence of high TG in the subjects [OR=1.268 (CI=1.004-1.602), p<0.05]. An increase in FT4 level was significantly and positively associated with the presence of high total cholesterol level in the subjects [OR=1.149 (CI=1.052-1.255), p<0.05]. Meanwhile, a lower FT4 level was significantly associated with the presence of a subnormal HDL level in the subjects [OR=0.836 (CI=0.749-0.934), p<0.05]. Free T3 was not significantly associated with any variable in the logistic models (Table 6). All models tested were adjusted for age, ethnicity, BMI and other thyroid hormones.
Discussion
Dyslipidemia has been shown to be a common feature of thyroid dysfunction (1). Patients with overt hypothyroidism exhibit significantly higher TC, LDL-C and TG compared to normal controls (23, 24). The increase in lipid levels can be reversed by thyroid hormone supplementation (25). In subjects with subclinical hypothyroidism, significant increase in the levels of TC, LDL-C, TC/HDL ratio compared to euthyroid subjects has been also observed (26). On the other hand, hyperthyroid patients exhibit lower level of TC, HDL-C and LDL-C (27). However, the relationship between TSH and thyroid hormones with lipid profile within the euthyroid range is less studied.
Table 3
Multiple regression results for the relationship between TSH with variables studied.
| Model 1 | Model 2 | Model 3 | Model 4 | |||||
|---|---|---|---|---|---|---|---|---|
| β | p | β | p | β | p | β | p | |
| logTC | 0.076 | 0.043 | 0.036 | 0.331 | 0.033 | 0.369 | 0.043 | 0.231 |
| logTG | 0.111 | 0.003 | 0.079 | 0.032 | 0.069 | 0.049 | 0.073 | 0.039 |
| logHDL-C | -0.020 | 0.596 | -0.026 | 0.484 | -0.014 | 0.690 | -0.007 | 0.844 |
| logLDL-C | 0.047 | 0.216 | 0.013 | 0.718 | 0.010 | 0.778 | 0.020 | 0.594 |
| logTC/HDL | 0.072 | 0.056 | 0.047 | 0.201 | 0.035 | 0.310 | 0.036 | 0.289 |
Model 1 includes TSH level only. Model 2 includes predictor in model 1, age and ethnicity. Model 3 includes predictors in model 2 and BMI. Model 4 includes predictors in model 3, FT3 and FT4.
Abbreviation: FT3=free triiodothyronine; FT4=free thyroxine; HDL-C=high density lipoprotein cholesterol; LDL-C=low density lipoprotein cholesterol; TC=total cholesterol; TG=triglyceride; TSH=thyroid-stimulating hormone.
Table 4
Multiple regression results for the relationship between FT4 with variables studied.
| Model 1 | Model 2 | Model 3 | Model 4 | |||||
|---|---|---|---|---|---|---|---|---|
| β | p | β | p | β | p | β | p | |
| logTC | 0.081 | 0.031 | 0.138 | <0.001 | 0.145 | <0.001 | 0.162 | <0.001 |
| logTG | -0.028 | 0.452 | 0.013 | 0.725 | 0.035 | 0.321 | 0.039 | 0.293 |
| logHDL-C | 0.126 | 0.001 | 0.152 | <0.001 | 0.127 | <0.001 | 0.152 | <0.001 |
| logLDL-C | 0.069 | 0.068 | 0.111 | 0.003 | 0.118 | 0.002 | 0.126 | 0.001 |
| logTC/HDL | -0.049 | 0.192 | -0.029 | 0.435 | -0.003 | 0.925 | -0.012 | 0.741 |
Model 1 includes FT4 level only. Model 2 includes predictor in model 1, age and ethnicity. Model 3 includes predictors in model 2 and BMI. Model 4 includes predictors in model 3, FT3 and TSH.
Abbreviation: FT3=free triiodothyronine; FT4=free thyroxine; HDL-C=high density lipoprotein cholesterol; LDL-C=low density lipoprotein cholesterol; TC=total cholesterol; TG=triglyceride; TSH=thyroid-stimulating hormone.
Table 5
Multiple regression results for the relationship between FT3 with variables studied.
| Model 1 | Model 2 | Model 3 | Model 4 | |||||
|---|---|---|---|---|---|---|---|---|
| β | p | β | p | β | p | β | p | |
| logTC | -0.087 | 0.021 | 0.003 | 0.927 | -0.003 | 0.943 | -0.049 | 0.218 |
| logTG | -0.038 | -0.311 | 0.039 | 0.309 | 0.015 | 0.675 | 0.009 | 0.819 |
| logHDL-C | -0.069 | 0.067 | -0.07 | 0.075 | -0.042 | 0.246 | -0.089 | 0.019 |
| logLDL-C | -0.056 | 0.136 | 0.021 | 0.59 | 0.014 | 0.712 | -0.022 | 0.578 |
| logTC/HDL | -0.003 | 0.928 | 0.064 | 0.096 | 0.036 | 0.316 | 0.041 | 0.261 |
Model 1 includes FT3 level only. Model 2 includes predictor in model 1, age and ethnicity. Model 3 includes predictors in model 2 and BMI. Model 4 includes predictors in model 3, FT4 and TSH.
Abbreviation: FT3=free triiodothyronine; FT4=free thyroxine; HDL-C=high density lipoprotein cholesterol; LDL-C=low density lipoprotein cholesterol; TC=total cholesterol; TG=triglyceride; TSH=thyroid-stimulating hormone.
Table 6
Logistic regression results for the relationship between thyroid hormones and TSH with lipid profile of the subjects
| TSH | FT4 | FT3 | |
|---|---|---|---|
| High TC | 1.041 (0.828-1.309) | 1.149 (1.052-1.255) | 0.849 (0.597-1.209) |
| High TG | 1.268 (1.004-1.602) | 1.036 (0.946-1.133) | 1.120 (0.776-1.616) |
| High LDL-C | 0.760 (0.551-1.048) | 1.109 (0.969-1.269) | 1.054 (0.618-1.797) |
| Low HDL-C | 1.170 (0.890-1.539) | 0.836 (0.749-0.934) | 1.094 (0.707-1.693) |
| High TC/HDL Ratio | 1.184 (0.938-1.494) | 0.970 (0.887-1.061) | 1.142 (0.795-1.641) |
The number in bold indicates significance (p<0.05). The data is expressed as odds ratio (95% confidence interval). The analysis was adjusted for age, BMI and among FT3, FT4 and TSH.
Abbreviation: FT3=free triiodothyronine; FT4=free thyroxine; HDL-C=high density lipoprotein cholesterol; LDL-C=low density lipoprotein cholesterol; TC=total cholesterol; TG=triglyceride; TSH=thyroid-stimulating hormone.
In the current study, it was found that FT4 was significantly and independently associated with TC, HDL-C and LDL-C of the subjects, while TSH was significantly and independently associated with TG. An increase in FT4 was associated with an increase in cholesterol level, while an increase in TSH was associated with an increase in TG level. Free T3 was significantly and negatively associated with HDL-C but not with LDL-C. While the association between FT3 and TSH on lipid profile seemed to extend from the hyper/hypothyroid states into the euthyroid range, the findings on the positive association of FT4 on cholesterol levels was unexpected. A study by Kim et al. (15) on the Chinese population also yielded similar results, in which FT4 was found to be significantly and positively correlated with TC, LDL-C and HDL-C. Their study also revealed a significant association between FT4 and TG but this relationship was restricted to the younger population (< 50 years).
Other studies observed a negative relationship between FT4 and lipid profile. A study by Garduño-Garcia et al. (13) in a Hispanic population found that FT4 level was significantly and negatively associated with TC and LDL-C, and positively with HDL-C. They also discovered a significant and positive relationship between TSH with TG. However, after adjustment for BMI, the associations between FT4 and cholesterol levels diminished in their study but this was not the case in the current study. They also found an independent and significant positive relationship between TSH and TC, which was not found in this study. In another study by Roos et al. (12) on the Dutch population, significant negative associations between FT4 with TC, LDL-C and TG, and a significant positive association between FT4 with HDL-C were found. Thyroid-stimulating hormone was also found to be significantly and positively associated with TG.
The direction of relationship between FT4 and lipid profile was different between the Western (reported by Roos et al. and Garduño-Garcia et al) and the Asian (reported by Kim et al. and this study) populations. There were noticeable differences in ethnicity and body fat between the two populations reported. However, the influence of these factors on relationship between FT4 and body fat was not well understood, and was beyond the scope of the present study.
The significant and independent relationship between TSH and TG, as shown in the current study was further supported by the observations of Wang et al. (28), in which TSH and TG was significantly associated in a Chinese euthyroid population. Similar to this study, they also found that TSH was not associated with HDL-C and LDL-C. In the Metabolic Syndrome Berlin Potsdam Study, Ruhla et al. (18) also discovered a significant relationship between TSH and TG after adjustment for BMI, while the relationship between TSH and cholesterol levels was generally not significant. In the Nord-Trøndelag Health Study, Åsvold et al. (14) observed that TSH was significantly associated with TG, TC, HDL-C and LDL-C in men and women. After adjustment for BMI, only the association with TG remained significant.
It was previously suggested that the association between TSH and TG was mediated through its regulatory effects on thyroid hormones. However, the relationship between TSH with TG remained significant although the effects of FT3 and FT4 levels were controlled in the current study. This showed that TSH was directly or independently associated with TG levels. This view was supported by the study of Wang et al., (17) in which they also discovered a significant relationship between TSH and TG after adjustment for total T3, total T4, FT3 and FT4 levels.
Nevertheless, there are few studies reporting results different from the current study. Study by Ho et al. (29) indicated that FT4 was significantly associated with TG but not with LDL-C and TC. They also found that the association between TSH with lipid profile was not significant in their population. However, it should be noted that their study population consisted solely of euthyroid Korean females, while our study population was entirely males. In other study by Lin et al. (16), FT4 was significantly associated with TG but not HDL-C in a population of Chinese attending a health screening center. These observations were not found in the current study. Free T3 and TSH level were not taken into consideration in the study by Lin et al.
The current study had several limitations. The subjects volunteered for this study and the sampling was not randomized. The generalization of the results of this study should be done with caution. However, the composition of the study population roughly resembled the male composition in Kuala Lumpur, which has an equal percentage of Chinese and Malays (30). The Indians and other minorities were not recruited in this study due to logistic difficulties. The causal relationship could not be inferred from this study because it was cross-sectional in nature. A longitudinal study would be more suitable for that purpose. The strength of the relationships between FT4 with cholesterol levels and between TSH with TG was significant but small. No significant relationship was found between TSH and thyroid hormones with TC/HDL ratio. Thus, the clinical significance of the findings remained debatable. The strength of this study was that all three TSH, FT4 and FT3 levels were measured and their relationships with lipid profile were evaluated together. This also allowed adjustments to be made for the interaction between these hormones so that the independent associations could be observed. Although studies on Mainland and Taiwanese Chinese are available, these associations have not been evaluated in the Malaysian population with a unique mixed Chinese and Malay composition.
Conclusion
In summary, there is a significant and positive relationship between FT4 and cholesterol levels, and a significant and positive relationship between TSH and TG levels in euthyroid men in Malaysia. These relationships are independent of age, ethnicity, BMI and interaction between TSH and thyroid hormones. Individual variation in thyroid status within the euthyroid range can, to a limited extent, explain the variation in the lipid profile of the general population. A longitudinal study is needed to assess the effects of the variation in TSH and thyroid hormone levels within the euthyroid range in the development of dyslipidemia in men.
Acknowledgements
We thank Universiti Kebangsaan Malaysia for providing the research grant UKM-AP-TKP-09-2009 (Arus Perdana Grant) and DIP-09-2009 (Impak Perdana Grant). We also thank Dr Fairus Ahmad and Dr Elvy Suhana Mohd Ramli for performing physical examination on the subjects.
Competing Interests
The authors have declared that no competing interest exists.
References
1. Rizos CV, Elisaf MS, Liberopoulos EN. Effects of thyroid dysfunction on lipid profile. Open Cardiovasc Med J. 2011;5:76-84
2. Peppa M, Betsi G, Dimitriadis G. Lipid abnormalities and cardiometabolic risk in patients with overt and subclinical thyroid disease. J Lipids. 2011:575840
3. Simonet WS, Ness GC. Transcriptional and posttranscriptional regulation of rat hepatic 3-hydroxy-3-methylglutaryl-coenzyme A reductase by thyroid hormones. J Biol Chem. 1988;263:12448-53
4. Shin D-J, Osborne TF. Thyroid Hormone Regulation and Cholesterol Metabolism Are Connected through Sterol Regulatory Element-binding Protein-2 (SREBP-2). J Biol Chem. 2003;278:34114-8
5. Saffari B, Ong JM, Kern PA. Regulation of adipose tissue lipoprotein lipase gene expression by thyroid hormone in rats. J Lipid Res. 1992;33:241-9
6. Berti JA, Amaral ME, Boschero AC, Nunes VS, Harada LM, Castilho LN. et al. Thyroid hormone increases plasma cholesteryl ester transfer protein activity and plasma high-density lipoprotein removal rate in transgenic mice. Metabolism. 2001;50:530-6
7. Prieur X, Huby T, Coste H, Schaap FG, Chapman MJ, Rodriguez JC. Thyroid hormone regulates the hypotriglyceridemic gene APOA5. J Biol Chem. 2005;280:27533-43
8. Lu S, Guan Q, Liu Y, Wang H, Xu W, Li X. et al. Role of extrathyroidal TSHR expression in adipocyte differentiation and its association with obesity. Lipids Health Dis. 2012;11:17
9. Gagnon A, Antunes TT, Ly T, Pongsuwan P, Gavin C, Lochnan HA. et al. Thyroid-stimulating hormone stimulates lipolysis in adipocytes in culture and raises serum free fatty acid levels in vivo. Metabolism. 2010;59:547-53
10. Tian L, Song Y, Xing M, Zhang W, Ning G, Li X. et al. A novel role for thyroid-stimulating hormone: Up-regulation of hepatic 3-hydroxy-3-methyl-glutaryl-coenzyme a reductase expression through the cyclic adenosine monophosphate/protein kinase A/cyclic adenosine monophosphate-responsive element binding protein pathway. Hepatology. 2010;52:1401-9
11. Hollowell JG, Staehling NW, Flanders WD, Hannon WH, Gunter EW, Spencer CA. et al. Serum TSH, T4, and Thyroid Antibodies in the United States Population (1988 to 1994): National Health and Nutrition Examination Survey (NHANES III). J Clin Endocrinol Metab. 2002;87:489-99
12. Roos A, Bakker SJL, Links TP, Gans ROB, Wolffenbuttel BHR. Thyroid Function Is Associated with Components of the Metabolic Syndrome in Euthyroid Subjects. J Clin Endocrinol Metab. 2007;92:491-6
13. Garduno-Garcia Jde J, Alvirde-Garcia U, Lopez-Carrasco G, Padilla Mendoza ME, Mehta R, Arellano-Campos O. et al. TSH and free thyroxine concentrations are associated with differing metabolic markers in euthyroid subjects. Eur J Endocrinol. 2010;163:273-8
14. Åsvold BO, Vatten LJ, Nilsen TIL, Bjøro T. The association between TSH within the reference range and serum lipid concentrations in a population-based study. The HUNT Study. Eur J Endocrinol. 2007;156:181-6
15. Kim B-J, Kim TY, Koh J-M, Kim H-K, Park J-Y, Lee K-U. et al. Relationship between serum free T4 (FT4) levels and metabolic syndrome (MS) and its components in healthy euthyroid subjects. Clin Endocrinol. 2009;70:152-60
16. Lin S-Y, Wang Y-Y, Liu P-H, Lai W-A, Sheu WH-H. Lower serum free thyroxine levels are associated with metabolic syndrome in a Chinese population. Metabolism. 2005;54:1524-8
17. Wang F, Tan Y, Wang C, Zhang X, Zhao Y, Song X. et al. Thyroid-Stimulating Hormone Levels within the Reference Range Are Associated with Serum Lipid Profiles Independent of Thyroid Hormones. J Clin Endocrinol Metab. 2012;97:2724-31
18. Ruhla S, Weickert MO, Arafat AM, Osterhoff M, Isken F, Spranger J. et al. A high normal TSH is associated with the metabolic syndrome. Clin Endocrinol. 2010;72:696-701
19. Chin K-Y, Soelaiman I-N, Mohamed I, Ibrahim S, Wan Ngah W. The effects of age, physical activity level, and body anthropometry on calcaneal speed of sound value in men. Arch Osteoporos. 2012;7:135-45
20. Chin K-Y, Soelaiman I-N, Mohamed IN, Ngah WZW. Serum testosterone, sex hormone-binding globulin and total calcium levels predict the calcaneal speed of sound in men. Clinics. 2012;67:911-6
21. Friedewald WT, Levy RI, Fredrickson DS. Estimation of the Concentration of Low-Density Lipoprotein Cholesterol in Plasma, Without Use of the Preparative Ultracentrifuge. Clin Chem. 1972;18:499-502
22. Third Report of the Expert Panel on Detection, Evaluation, and Treatment of High Blood Cholesterol in Adults (Adult Treatment Panel III); 2004. National Heart Lung and Blood Institute. http://www.nhlbi.nih.gov/guidelines/cholesterol/
23. Santi A, Duarte M, Moresco R, Menezes C, Bagatini M, Schetinger M. et al. Association between thyroid hormones, lipids and oxidative stress biomarkers in overt hypothyroidism. Clin Chem Lab Med. 2010;48:1635-9
24. Shashi A, Sharma N. Lipid Profile Abnormalities in Hypothyroidism. Int J Sci Nat. 2012;3:354-60
25. Pearce EN, Wilson PWF, Yang Q, Vasan RS, Braverman LE. Thyroid Function and Lipid Subparticle Sizes in Patients with Short-Term Hypothyroidism and a Population-Based Cohort. J Clin Endocrinol Metab. 2008;93:888-94
26. Santi A, Duarte MMMF, de Menezes CC, Loro VL. Association of Lipids with Oxidative Stress Biomarkers in Subclinical Hypothyroidism. Int J Endocrinol. 2012;2012:7p
27. Kung AW, Pang RW, Lauder I, Lam KS, Janus ED. Changes in serum lipoprotein(a) and lipids during treatment of hyperthyroidism. Clin Chem. 1995;41:226-31
28. Wang C-Y, Chang T-C, Chen M-F. Associations between subclinical thyroid disease and metabolic syndrome. Endocr J. 2012;59:911-7
29. Ho SS, Eui DJ, Sung HK, Ji HL. Free T4 is negatively correlated with body mass index in euthyroid women. Korean J Intern Med. 2008;23:53-7
30. Statistics Department of Malaysia. Population Distribution and Basic Demographic Characteristics. Putrajaya: Statistics Department of Malaysia. 2011
Author contact
![]() Corresponding author: Professor Dr. Soelaiman Ima-Nirwana, M.B.B.S., PhD., Department of Pharmacology, Faculty of Medicine, Universiti Kebangsaan Malaysia, Jalan Raja Muda Abdul Aziz, 50300 Kuala Lumpur, Malaysia. Tel: 03-40405514; Fax: 03-26938205; Email: imasoelukm.my
Corresponding author: Professor Dr. Soelaiman Ima-Nirwana, M.B.B.S., PhD., Department of Pharmacology, Faculty of Medicine, Universiti Kebangsaan Malaysia, Jalan Raja Muda Abdul Aziz, 50300 Kuala Lumpur, Malaysia. Tel: 03-40405514; Fax: 03-26938205; Email: imasoelukm.my
Citation styles
APA
Chin, K.Y., Ima-Nirwana, S., Mohamed, I.N., Aminuddin, A., Johari, M.H., Ngah, W.Z.W. (2014). The Relationships between Thyroid Hormones and Thyroid-stimulating Hormone with Lipid Profile in Euthyroid Men. International Journal of Medical Sciences, 11(4), 349-355. https://doi.org/10.7150/ijms.7104.
ACS
Chin, K.Y.; Ima-Nirwana, S.; Mohamed, I.N.; Aminuddin, A.; Johari, M.H.; Ngah, W.Z.W. The Relationships between Thyroid Hormones and Thyroid-stimulating Hormone with Lipid Profile in Euthyroid Men. Int. J. Med. Sci. 2014, 11 (4), 349-355. DOI: 10.7150/ijms.7104.
NLM
Chin KY, Ima-Nirwana S, Mohamed IN, Aminuddin A, Johari MH, Ngah WZW. The Relationships between Thyroid Hormones and Thyroid-stimulating Hormone with Lipid Profile in Euthyroid Men. Int J Med Sci 2014; 11(4):349-355. doi:10.7150/ijms.7104. https://www.medsci.org/v11p0349.htm
CSE
Chin KY, Ima-Nirwana S, Mohamed IN, Aminuddin A, Johari MH, Ngah WZW. 2014. The Relationships between Thyroid Hormones and Thyroid-stimulating Hormone with Lipid Profile in Euthyroid Men. Int J Med Sci. 11(4):349-355.
This is an open access article distributed under the terms of the Creative Commons Attribution (CC BY-NC) License. See http://ivyspring.com/terms for full terms and conditions.