Impact Factor ISSN: 1449-1907
- Issue 8; 2026
- Issue 7; 2026
- Issue 6; 2026
- Issue 5; 2026
- Issue 4; 2026
- Volume 23; 2026
- Past Issues
- Editorial Board
- Cover Images
- Index & Coverage
- Cover Suggestion
- Special Issues
1. Introduction
2. Materials and methods
3. Results
4. Discussion
Conclusion
Acknowledgements
References

 Global reach, higher impact
Int J Med Sci 2013; 10(12):1795-1804. doi:10.7150/ijms.7025 This issue Cite
Research Paper
Effect of GINS2 on Proliferation and Apoptosis in Leukemic Cell Line
Xi Zhang1, Liang Zhong2, Bei-Zhong Liu1 ![]() , Yan-Jun Gao2, Yuan-Mei Gao2, Xiu-Xiu Hu2
, Yan-Jun Gao2, Yuan-Mei Gao2, Xiu-Xiu Hu2
1. Central Laboratory of Yong-chuan Hospital, Chongqing Medical University, Chongqing 402160, China.
2. Key Laboratory of Laboratory Medical Diagnostics, Ministry of Education, Department of Laboratory Medicine, Chongqing Medical University, Chongqing 400016, China.
Received 2013-6-27; Accepted 2013-9-15; Published 2013-10-30
Abstract
Although previous researches have demonstrated that GINS2 express abundantly and abnormally in many malignant solid tumors, such as breast cancer, melanoma and hepatic carcinoma. However, the role and precise molecular mechanism in acute promyelocytic leukemia (APL) are rarely reported. In this current study, we investigated the possible effect and particular mechanism of GINS2 in occurrence and development of APL. We synthesized interference plasmid targeted GINS2 successfully in vitro and also constructed recombinant adenovirus vector carrying GINS2 gene in order to down-regulate or up-regulate GINS2 expression from two aspects of positive and negative in APL. After siRNA were transfected into HL60 cells, both GINS2 expression level of mRNA and protein in interfering group were down-regulated when compared with control groups. Together, MTT and flow cytometry technology showed that cell growth was significantly inhibited. Moreover, the expression lever of Bax was distinctly increased whereas Bcl2 was dramatically decreased in transfected group. Further experiments revealed that down-regulation of GINS2 expression inhibited DNA replication and had a G2/M phase block in HL60 cells. What's more, ATM, CHK2, and P53 gene could involve in the pathogenic signaling pathways of HL60 cells when GINS2 gene was down-regulated. On the contrary, after HL60 cells were infected by recombinant adenovirus vector which contained GINS2 gene, we observed that over-expression of GINS2 could promote HL-60 cell proliferation. What's more, GINS2 might implicate a potential target for leukemia gene therapy.
Keywords: GINS2, leukemia, RNA interference, apoptosis, proliferation
1. Introduction
Leukemia is a malignant clone hematonosis deprived from hemopoietic stem cells, blood system malignant tumors account for about 7% of the new tumor patients each year. However, acute myeloid leukemia (AML), account for 80% of adult leukemia, is the malignancy with the highest incidence of morbidity and mortality mainly in adult aged under 35 years old[1]. APL is a clear subtype of AML, the genetic characteristics of this typical is the chromosome translocation of t (15; 17), which fuses promyelocytic (PML) leukemia gene located on chromosome 15 to retinoic acid receptor alpha (RAR α) gene mapped on chromosome 17. As a result, fusion protein PML-RAR α encoded by mosaic gene plays an important role in the process of APL [2]. It is discovered by Lane [3-4] that fusion protein PML-RAR α may be cut into two different variant proteins by neutrophil elastase (NE). This kind of cleavage action separates nuclear localization signal (NLS) from PML gene which is named as PML (NLS-). Besides, RAR α gene links to NLS as a whole part which is named as NLS- RAR α. Previous experimental studies in our laboratory have proved that GINS2 protein interact with PML (NLS-) protein by using of yeast two-hybrid system and co-immunoprecipitation techniques [5, 6, 7]. This is laid a foundation of further study on the role of GINS2 gene in our future study.
GINS (Go-Ichi-Ni-San, five, one, two, and three in Japanese) complexes which consist of PSF1, PSF2, PSF3, and SLD5 (subunits of SLD) are a nucleic acid replication factor which are firstly discovered by Takayama [8] through genetic screening method. Four submits of GINS complexes initiate a cyclic structure which plays a significant role in the beginning of DNA replication [9, 10].GINS2, also known as Psf2, is encoded by GINS2 gene locates on human chromosome 16q24 which performs in both initiation of DNA replication and the cell cycle process [11].
In order to further explore the effect and mechanism of GINS2 in the progression of APL, we knocked down the expression of GINS2 by RNA interference and over-expressed GINS2 by adenovirus infection in HL60 cells. And then, we detected the effect of cell apoptosis and proliferation, cell cycle distribution, changes of apoptotic proteins.
2. Materials and methods
2.1. Cell line and culture
HL60 (Institutes for Biological Sciences, Shanghai, China) cells were inoculated in culture medium (RIPA1640, Gibco, MD, USA) with 10% fetal bovine serum (FBS, Gibco, MD, USA). Grow cells at 5%CO2, 37 °C. All of cells were replaced medium at intervals of 2 days.
2.2. Construction of RNAi plasmid and recombinant adenovirus vector
According to the mRNA sequence of GINS2 (NM_016095), short hairpin RNA molecules targeted to mRNA site of this gene were synthesized by corporation (sangon biotech, Shanghai, China). Oli-gonucleotides were annealed and ligated to PGPU6/GFP/Neo plasmid (Genepharma, Shanghai, China). The sequence of three interference groups and one negative control group were as followed:
psiGINS2-1: Sense:5'-CACCGCTGGCGATTAACCTGAAACATTCAAGAGATGTTTCAGGTTAATCGCCAGCTTTTTTG-3';Antisense:5'-GATCCAAAAAAGCTGGCGATTAACCTGAAACATCTCTTGAATGTTTCAGGTTAATCGCCAGC-3'
psiGINS2-2: Sense:5'-CACCGGATCATGAACGAAAGGAAGATTCAAGAGATCTTCCTTTCGTTCATGATCCTTTTTTG-3';Antisense:5'-GATCCAAAAAAGGATCATGAACGAAAGGAAGATCTCTTCCTTTCGTTCATGATCCTTTTTTG-3'
psiGINS2-3: Sense:5'-CACCGCCCTTACTACATGGAACTTATTCAAGAGATAAGTTCCATGTAGTAAGGGCTTTTTTG-3';Antisense:5'-GATCCAAAAAAGCCCTTACTACATGGAACTTATCTCTTGAATAAGTTCCATGTAGTAAGGGC-3'
Negative control group: Sense:5'-CACCGTTCTCCGAACGTGTCACGTCAAGAGATTACGTGACACGTTCGGAGAATTTTTTG-3';Antisense: 5'-GATCCAAAAAATTCTCCGAACGTGTCACGTAATCTCTTGACGTGACACGTTCGGAGAA-3'
Besides, we constructed and identified a recombinant adenovirus vector carrying human GINS2 gene which was named as pAd-GINS2, RFP-expressing adenovirus vector pAd-KZ as control.
2.3. RNA interference
Cell density could be 50~80% confluent on the day of transfection. HL-60 cells (5×10⁵/ml) in logarithmic growth phase were seeded in 6-well plates. For each well of cells to be transfected, diluted 3 µg of DNA into 100 µl of Opti-MEM I (Invitrogen, Carlsbad, California) reduced serum medium without serum. Then, diluted 15µl of Lipofectamine LTX (Invitrogen, Carlsbad, California) into the above diluted DNA solution mixed gently and incubated for 25 minutes at room temperature. Added above of the DNA-Lipofectamine LTX complexes directly to each well and mixed gently by rocking the plate back and forth. After incubation at 37°C for 48 hours, green fluorescence protein (GFP) could be verified by fluorescent microscopy. Transfection efficiency was determined by the number of cells expressing GFP. The experimental groups were divided into untreated group (HL60 cells), negative control group, psiGINS2-1, psiGINS2-2, and psiGINS2-3 group.
2.4. Cell infection by adenovirus
HL-60 cells (2×10⁵/ml) were cultured in 24 well plates, and then infected with recombinant adenovirus pAd-GINS2 and pAd-KZ respectively. Red fluorescence microscopy was used to observe fluorescence after infection for 48h. The experiment was divided into infection group HL60/ pAd-GINS2, empty vector group HL60/pAd-KZ and untreated HL60 cells group.
2.5. RNA isolation and RT-PCR analysis
Total RNA from each group extracted using Trizol reagent (Invitrogen, Carlsbad, California) was converted to cDNA.PCR reaction system containing 2 μ L of cDNA, 1 μ L (20μM) of each primer, and 25uL Premix Taq enzyme (TaKaRa, Dalian, China), and then sterile water was up to 50 μ L. The reaction condition were: predenaturation at 95°C for 5min, denaturation at 95 °C for 10s, annealing at 55 °C for 35S, extension at 72 °C for 30s, 35 cycles. The PCR product were separated on 1.5% agarose gels and stained with ethidium bromide. β-actin served as an internal positive control.
2.6. Western blot
Sixty micrograms of cell protein from each group were separated on 12% polyacrylamide gels and then transferred to polyvinylidene difluoride (PVDF) membrane. These membranes were incubated for 3h at room temperature in 5% skim milk (diluted with Tris-buffered-saline with Tween). Primary antibodies used were anti-human GINS2 rabbit polyclonal antibody (diluted 1:1000, Abcam, USA); anti-human Chk2 phospho (pT68) / phospho P53 (pS15)/CDK1/ATM/ rabbit monoclonal antibody (diluted 1:1000, Santa Cruz Biotechnology, USA). Membranes were incubated with primary antibodies overnight at 4 °C, and then incubated in secondary antibody (goat anti-rabbit antibody, 1:2000 dilution, Zhongshan goldenbrioge Biotechnology Co., Ltd., Beijing, China) for 1h at room temperature. After washing three times in Tris-buffered-saline with Tween (TBST), immunoreactive complexes were visualized using ECL chemiluminescence system (Bio-rad USA). β-actin served as an internal positive control.
2.7. MTT assay
The cells were plated onto 96-well plates at a number of 5 × 10³ per well. 20μ L of 3-(4, 5-dimethylthiazol-2-yl)-2, 5-diphenyltetrazolium bromide (MTT, 5 mg/ml, Sigma, MO, USA) was added to cells for quantifying cell proliferation from 1 to 4 days. MTT was removed after 4h incubation, then added dimethyl sulfoxide (DMSO, Sigma, MO, USA) to solubilize the formazan granules. Absorbance of each well was measured at 490 nm using a spectrophotometer (Bio-rad USA). Cell growth curve was made with absorbance as ordinate and time as abscissa. Experimental results were analyzed by the SPSS17.0 software and repeated the experiment 3 times.
2.8. Soft agar colony formation assay
The cells were routinely harvested and resuspended in complete medium, then seeded in 24 well plates (2 000 cells per well), 3 control wells are included that contain the same account of cells as the experimental wells. Two weeks after the conventional culture, Anchorage-independent growth was measured by counting the colony number and observation of the size of colony. Each cell colony contained 50 or more than 50 cells as a colony, Colony forming rate = (colony number / inoculated cell number) x 100%.
2.9. Flow cytometry assay
The cells were routinely collected and centrifuged for 5 min, 250×g at room temperature. After being washed twice with phosphate-buffered saline (PBS) and then prepared staining mixture by adding fluorescent dye. Cell apoptosis rate was analyzed by FACsorter (Becton Dickinson, CA, USA) after being incubated for 15 min at room temperature. Experiment result was repeated three times. Besides, cell suspension was collected into tube to centrifuge for 5 min, then prepared staining mixture by adding 1 000μ L PBS, 500 μ L 70% ethanol. After being reacted overnight at 4 °C, cell cycle was detected by FACsorter (Becton Dickinson, CA, USA).
2.10. Statistical analysis
Statistical analyses were performed using SPSS17.0 software. Experimental results were represented as means ±SD. Independent sample t test was used to compare two groups. P < 0.05 was reflected to statistic significant difference.
3. Results
3.1. The fluorescent protein expression in HL-60 cells
To down-regulate the expression of human GINS2 gene, we transfected psiGINS2-shRNA with enhanced GFP into HL60 cells. After transfection of interference plasmids for 48h, our data showed that the percentage of GFP positive cells in psiGINS2-2 group and negative control group were 70% and 60% respectively (Figure 1A). These results suggested that interference plasmid was successfully transfected into the HL60 cells and expression of green fluorescent reporter gene.
Fluorescent microscopy of HL60 cells after transfection or infection (×200). A, Detection of expression levels of GFP by fluorescence microscope in psiGINS2-2 group and negative control group. B, Detection of expression levels of RFP by fluorescence microscope in HL60/pAd-GINS2 group and HL60/pAd-KZ group.
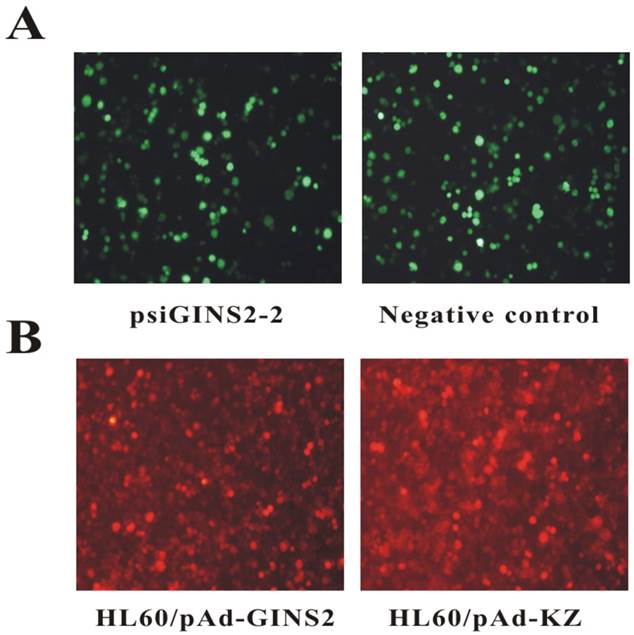
In addition, we also over-expressed human GINS2 gene using recombinant adenovirus. Our results revealed that the percentage of RFP positive cells were 75% in HL60/ pAd-GINS2 group and of that 80% in HL60/pAd-KZ group at 72h (Figure 1B).
3.2. Transient silencing GINS2 in APL cell line HL60
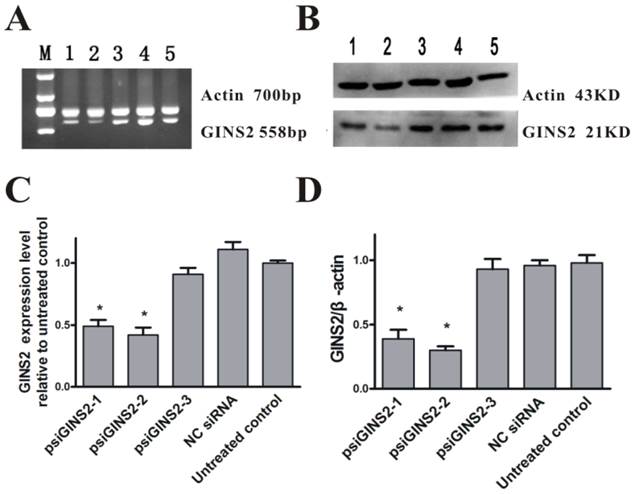
In order to understand the function of GINS2 gene in APL, we silenced its endogenous expression by way of RNA interference, and then measured by RT-PCR and Western blot methods. Compared with the untreated group, mRNA expression levels were down-regulated in three interference groups (P<0.05, Figure 2A,C). Data was as followed: psiGINS2-1 group (49±1%), psiGINS2-2 group (41±2%), and psiGINS2-3 group (91±1%). Moreover, the result of Western blot was similar to RT-PCR, which demonstrated that protein expression levels were decreased dramatically in three groups targeted to GINS2 especially in psiGINS2-2 group (P<0.05, Figure 2B,D). No significant difference of GINS2 mRNA and protein levels was found among the control groups (P>0.05, Figure 2). Taken together, the results suggested us that the level of GINS2 was inhibited efficiently.
Detection of GINS2 in transfected cells. A, RT-PCR was performed to detect silence of GINS2 in HL60 cells. B, Western blot was performed to measure silence of GINS2 in HL60 cells. C, The level of GINS2 mRNA in psiGINS2-2 group was significantly decreased compared with control groups. D, Typical results of Western blot and densitometric analysis for quantitative evaluation is shown. The average signal intensity was standardized to β-actin. Data was shown as means ± SD of triplicate experiments.*P<0.05(vs. untreated control).
3.3. Up-regulation of GINS2 in HL-60/pAd-GINS2 cells
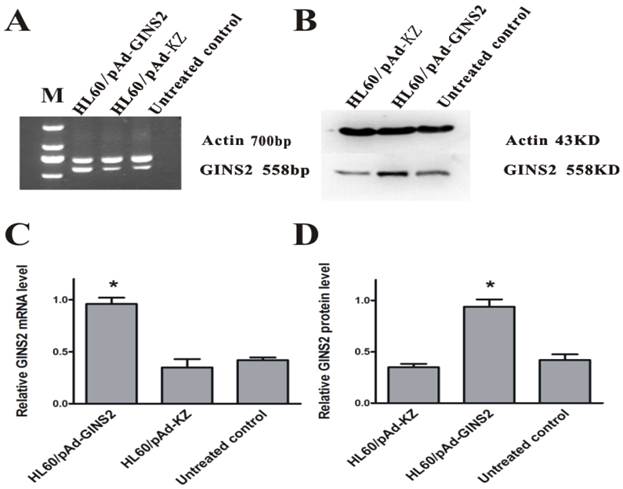
To study on the relationship between GINS2 and tumorigenesis, it was necessary to simultaneously compare the effects of over-expression and inhibition of GINS2 expression on the growth of HL60. Similarly, we detected the expression levels of GINS2 after infecting by recombinant adenovirus vector carrying GINS2 using RT-PCR and Western blotting respectively. The results showed that GINS2 expressed significantly in HL60/pAd-GINS2 group higher than control groups (P<0.05, Figure 3).
Detection of GINS2 in infected cells. A, RT-PCR analysis of GINS2 after being infected by pAd-GINS2 and pAd-KZ respectively at mRNA level. B, Western blotting analysis of GINS2 after being infected by pAd-GINS2 and pAd-KZ respectively at protein level. C, β-actin served as an internal positive control. D, Densitometric analysis for quantitative evaluation. β-actin was used to demonstrate equal loading of all samples. Data was shown as means ± SD of triplicate experiments. *P <0.05 (vs. control).
3.4. Effect of GINS2 gene on the proliferation of HL60 cells
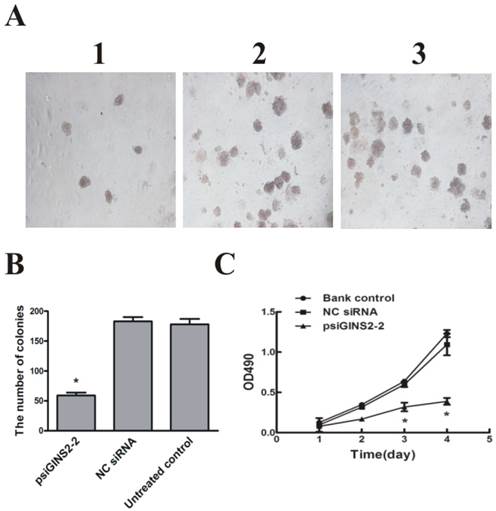
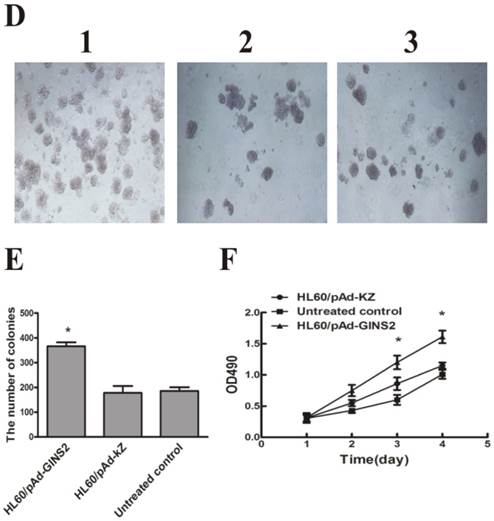
To examine whether down-regulation of GINS2 has an influence on cells growth in vitro, MTT assay and colony formation method were performed to detect the proliferation of HL60 cells respectively. MTT assay showed that cell growth was dramatically inhibited in psiGINS2 group in a time-dependent manner compared with bank control group and NC siRNA group (P<0.05, Figure 4C). The highest inhibitory rare was (53±1%) at 96h. Colony formation assay demonstrated that a significant decreased colony formation both in size and number in psiGINS2 group (Figure 4A), as compared with control groups (P<0.05). Besides, both MTT assay and colony formation method illustrated that up-regulation of GINS2 could increase cell growth of HL60 (P<0.05, Figure 4D, E and F).
Cell proliferation after down-regulation or over-expression of GINS2 in HL60 cells respectively. A, Down-regulation of GINS2 expression showed that colony-forming activities in psiGINS2-2 group decreased significantly on soft agar through counting numbers of colonies (1,psiGINS2-2, 2,NC siRNA and 3,untreated control). B, The colonies of psiGINS2-2, NC siRNA and untreated control group formed on soft agar. C, MTT assay was performed to measure proliferation potential of cells after silencing of GINS2. D, UP-regulation of GINS2 expression showed that colony-forming activities in pAd-GINS2 group increased remarkably on soft agar through counting numbers of colonies (1,pAd-GINS2, 2,pAd-KZ and 3, untreated control). E, The colonies of pAd-GINS2, pAd-KZ and untreated control group formed on soft agar. F, MTT method was executed to detect cell proliferation after over-expression of GINS2. Each assay condition was carried out in triplicate in at least two independent batches. Data was represented as means ± SD of three impendent experiments. *P <0.05 (vs. control).
3.5. Cell apoptosis results
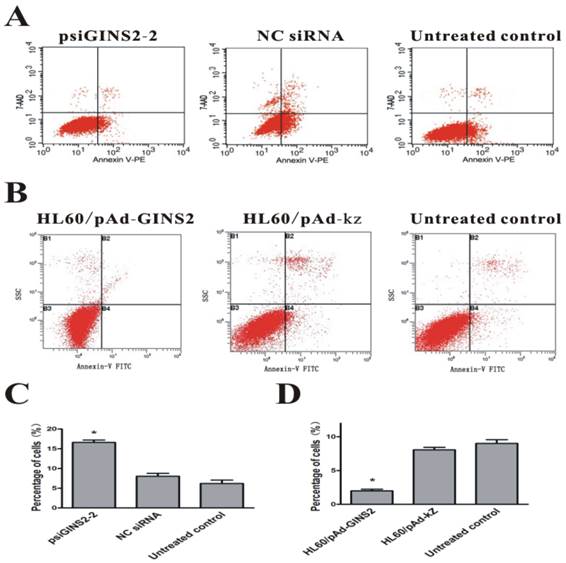
To evaluate accurately the effect of up-regulation or down-regulation of GINS2 gene on the apoptotic rate of HL60 cells, the flow cytometry analysis was performed to measure the amount of apoptotic cells. Our data revealed that apoptosis rate in psiGINS2-2 group(16.59±0.61%) was obviously higher than that of NC siRNA group (8.06±0.71%) and untreated groups (6.21±0.85%) after transfection for 48h (P< 0.05, Figure 5A and C).In addition, apoptosis rate in HL60/pAd-GINS2 group (0.89±0.25%) was dramatically lower than that of HL60/pAd-KZ group (8.25±0.66%) and untreated groups (6.58±0.95%) after infection for 48h (P < 0.05, Figure 5B and D).
Detection of cell apoptosis after silencing or over-expression of GINS2 in HL60 cells respectively. A, FACS was carried out 48h after transfection with the indicated siRNA and demonstrated that the percentage of apoptosis cells was decreased significantly in psiGINS2-2 groups than those in control groups. B, FACS was utilized 48h after infection with the recombinant adenovirus and revealed that the percentage of apoptosis cells was increased dramatically in pAd-GINS2 groups than those in control groups. C, The number of apoptosis cells in psiGINS2-2, NC control and untreated control groups. D, The number of apoptosis cells in pAd-GINS2, pAd-KZ, and untreated control groups. Data was represented as means ± SD of three impendent experiments. *P <0.05 (vs. control).
3.6. The expression of apoptosis-related gene Bax and Bcl2
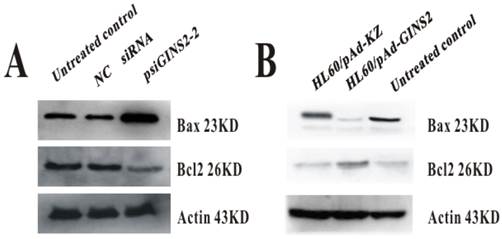
To investigate the effect of GINS2 on apoptosis in APL, we also measured the expression level of relevant apoptosis gene Bax and Bcl2 after down-regulation and up-regulation of GINS2 in vitro. These results showed for us that down-expression of GINS2 could increase the level of Bax expression and decrease Bcl2 expression, as compared with control group (Figure 6A).On the other hand, compared with control group, over-expression increased the expression level of Bcl2 and decreased the expression level of Bax (Figure 6B).
The expression of apoptosis related protein Bax and Bcl2. A, Western blotting analyzed the expression of BAX and BCL-2 after down-regulation of GINS2. B, Western blotting detected the expression of BAX and BCL-2 after up-regulation of GINS2.
3.7. Down-regulation of GINS2 affected the cell cycle progression
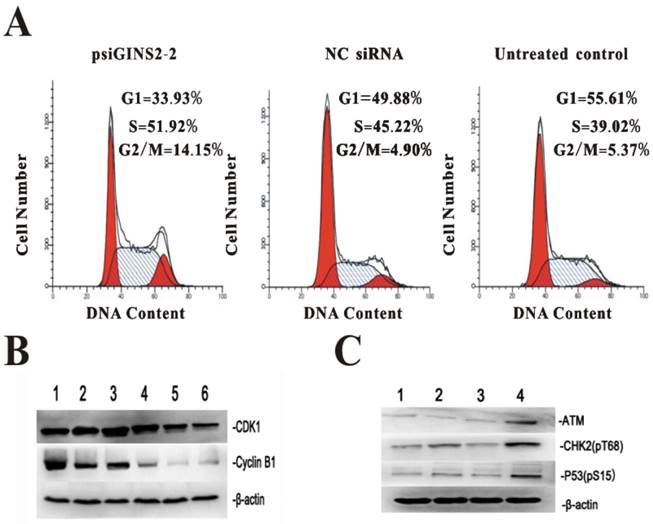
For the purpose of further understanding the role and mechanism of GINS2 gene in cell cycle after silencing its expression, flow cytometric analysis was performed to detect cell cycles, while western bolt was used to measure the expression of cell cycle regulatory factors CDK1, Cyclin B1, ATM, CHK2, and P53. FACS demonstrated that the percentage of cells of psiGINS2 group in G2/M phase was significantly increased compared with NC siRNA group and untreated control group (Figure 7A), which proved there had a G2/M phase block. Western bolt results showed that the expression of CDK1 and cyclinB1 (two key genes involved in G2/M phase)were down-regulated with prolongation of transfection, as compared with untreated group and negative control group, which correlated well with the FACS results mentioned above (Figure 7B). Besides, ATM, CHK2 and P53, factors related with cell cycle progression, were increased obviously in comparison with control groups (Figure 7C).
Effects of cell cycle progression and correlative regulatory proteins after silencing of GINS2 in HL60. A, G2/M phrase arrest was confirmed by FACS in psiGINS2-2 group. B, CDK1 and Cyclin B1 were detected by Western blot respectively. (1, Negative control and 2, Untreated control; 3~6:24,48,72,96 h after down-regulation of GINS2) C, ATM, CHK2, P53 were measure by Western blot. (1, Untreated control, 2, Negative control, 3, psiGINS2-1 and 4, psiGINS2-2).
4. Discussion
To explore molecular mechanisms and therapeutic targets for leukemia, look for its special drug interventions and inaugurate new approaches for molecular diagnosis have been increasingly valued by numerous scholars. GINS, a ring-like multiple protein involving of PSF1, PSF2, PSF3, and SLD5, were extracted from budding yeast in 2003[12]. As a subunit of GINS complexes, GINS2 mediate the interaction between MCM complexes and Cdc45 at the initiation of DNA replication in eukaryotic cells. Furthermore, together with a series of receptors, growth factors and some vital proteins, GINS2 is involved in the regulation of cell cycle and proliferation [13]. Besides, recent study has revealed that GINS2 is closely related to the occurrence of genomic DNA damage in untransformation of human fibroblasts [14].
It has been well established by many researches that each submit of GINS complexes express ubiquitously in many tumor cells. PSF1 can be treated as a target of estrogen and over-expression in breast cancer cell lines and tissues. Down-regulation of PSF1 led to the reduction in growth of cancer cells but no effect on normal breast epithelial cells [15, 16, 17]. The expression of GINS2 increase significantly in intrahepatic cholangiocarcinoma cells [18]. Moreover, the level of PSF3 expression is significantly higher than that of surrounding normal tissues in malignant colorectal cancer. The growth of cancer cells is inhibited and blocked in S phase process if PSF3 is silenced using RNA interference technology [19].While Sld5 and PSF1 are highly expressed in melanoma and promote its development and progress [20]. Although, the role and function of GINS2 in other tumors are elucidated, the mechanism of GINS2 related with onset and progress of acute promyelocytic leukemia the detailed is unknown.
In our current study, we detected correlative changes of proliferation and apoptosis of HL60 after down-regulation or up-regulation of GINS2 respectively. All these findings indicated that GINS2 could promote HL-60 cells proliferation. We speculated that process of GINS2 binding to chromosomes was blocked at the early stage of DNA replication when we performed to silence the expression of GINS2 using RNA interference technology.
In order to research the effect of GINS2 gene on apoptosis of HL-60 cells, we detected the apoptosis-related gene expression level. Apoptosis is a kind of programmed cell death controlling by a genetic mechanism mainly activated by physiological or pathologic factors. Regulatory genes of apoptosis intrinsic pathway are mostly composed of Bcl-2 family which can be divided into apoptosis-inducing factors (Bax, Bak, Bad, Bcl-Xs, Bid, Bik) and anti-apoptotic factors (Bcl-2, Bcl, XL, Bcl-W, Bfl-1) according to their functions [21]. The ratio of Bax and Bcl2 is the key factor to affect cell apoptosis [22, 23]. In this experiment, we observed that up-regulation of GINS2 promoted cell proliferation and inhibited apoptosis by increasing the expression of Bcl2 and decreasing the expression of Bax.
Aberrant cell cycle regulation is an important connection in the malignant proliferation of tumor cells. ATM, an ataxia capillary mutant protein of human, can activate cell cycle checkpoint when DNA damage occurred. It can enhance the repair of damaged DNA through modification of a variety of critical cell cycle regulation factors and apoptosis regulating proteins [24]. P53 is an important tumor suppressor protein usually lacking normal functions in cancer cells which drives the tumorigenesis. In hematopoietic system tumors, over-expression of P53 induces apoptosis of blood corpuscles [25]. Besides, CHK2 is a critical cell cycle checkpoint kinase downstream when ATM induces G2/M arrests in eukaryotic cells. Once damage factors activates ATM, activated CHK2 is triggered by phosphorylating Thr residue (Thr68), in turn, enabled CHK2 lead to large accumulation of P53 (phosphorylates at Ser15 site) in the period of G2/M charging for ATM induced cell cycle progression and cell apoptosis [26]. On the other hand, the activated CHK2 can also invoke CdC25C, and indirect regulate the expression of CDK1 and CyclinB1 [27].
For the purpose of further study on the changes of relative regulatory factors of cell cycle after down-regulating of GINS2, flow cytometry demonstrated that cell cycles were blocked in G2/M phase. In addition, related regulatory protein CDK1 and cyclinB1 expression levels also confirmed this result. Also, the level of cell cycle regulators ATM, CHK2, P53 expression were increased significantly after transfection of interference vectors. Collectively, these data illuminated that various signal factors collaborated GINS2 involved in the regulation of cell cycle progression and shed light on a vital relationship between block in G2/M period and DNA damage. Thus, we speculated GINS2 played an important role in the various signaling networks of occurrence and development in APL.
Conclusion
We found that inhibition of GINS2 reduced acute promyelocytic leukemia cells growth and increased apoptotic cells. On the other hand, up-regulation of GINS2 promoted cells proliferation. This new information of GINS2 involved in tumor cell apoptosis, cell cycle progression will be essential to identify a potential biomarker or treatment target that will have predict value in detection, therapy and predisposition of acute promyelocytic leukemia.
Acknowledgements
This project was supported by a grant from National Natural Science Foundation of China (No. 81171658) and Natural Science Foundation Project of CQ CSTC (No. 2011BA5037).
Competing Interests
The authors have declared that no competing interest exists.
References
1. Jemal A, Siegel R, Xu J. et al. Cancer statistics, 2010. CA Cancer J Clin. 2011;61:133-4
2. Nasr R, Lallemand-Breitenbach V, Zhu J. et al. Therapy-induced PML/RARA proteolysis and acute promyelocytic leukemia cure. Clin Cancer Res. 2009;15:6321-6
3. Lane AA, Ley TJ. Neutrophil elastase is important for PML-retinoic acid receptor activities in early myeloid cells. Mol Cell Biol. 2005;25:23-33
4. Lane AA, Ley TJ. Neutrophil elastase cleaves PML-RAR and is important for the development of acute promyelocytic leukemia in mice. Cell. 2003;115:305-18
5. Yan-Jun G, Chong W, Bei-Zhong L. et al. Evaluation of intra-cellular interaction between GINS2 and PML-C inside cells. Journal of Medical Molecular Biology. 2011;8:127-31
6. Wang C, Liang Z, Dong-Sheng W. et al. Screening and identification of the proteins interacting with NLS-RARα protein. Progress in Biochemistry and Biophysics. 2009;32:500-5
7. Dan Z, Chong W, Bei-Zhong L. et al. Screening and identification target proteins interacting with the structural domain of PML-C by yeast two-hybrid system techniques. Journal of Medical Molecular Biology. 2010;7:242-6
8. Takayama Y, Kamimura Y, Okawa M. et al. GINS, a novel multiprotein complex required for chromosomal DNA replication in budding yeast. Genes Dev. 2003;17:1153-65
9. Chang YP, Wang G, Bermudez V. et al. Crystal structure of the GINS complex and functional insights into its role in DNA replication. Proc Natl Acad. 2007;104:12685-90
10. Kubota Y, Takase Y, Komori Y. et al. A novel ring-like complex of Xenopus proteins essential for the initiation of DNA replication. Genes Dev. 2003;17:1141-52
11. MacNeill SA. Structure and function of the GINS complex, a key component of the eukaryotic replisome. Biochem J. 2010;425:489-500
12. Kamada K, Kubota Y, Arata T. et al. Structure of the human GINS complex and its assembly and functional interface in replication initiation. Nat Struct Mol Biol. 2007;14:388-96
13. Kang YH, Galal WC, Farina A. et al. Properties of the human Cdc45/Mcm2-7/GINS helicase complex and its action with DNA polymerase epsilon in rolling circle DNA synthesis. Proc Natl Acad Sci U S A. 2012;109:6042-47
14. Barkley LR, Song IY, Zou Y, Vaziri C. Reduced expression of GINS complex members induces hallmarks of pre-malignancy in primary untransformed human cells. Cell Cycle. 2009;8:1577-88
15. Thomassen M, Tan Q, Kruse TA. Gene expression meta-analysis identifies chromosomal regions and candidate genesinvolved in breast cancer metastasis. Breast Cancer Res Treat. 2009;113:239-49
16. Rantala JK, Edgren H, Lehtinen L. et al. Integrative functional genomics analysis of sustained polyploidy phenotypes in breast cancer cells identifies an oncogenic profile for GINS2. Neoplasia. 2010;12:877-88
17. Izumi N, Mamiko M, Tatsuhiro S. et al. Up-regulation of PSF1 promotes the growth of breast cancer cells. Genes. 2010;15:1015-24
18. Obama K, Ura K, Satoh S. et al. Up-regulation of PSF2, a member of the GINS multiprotein complex, in intrahepatic cholangiocarcinoma. Oncol Rep. 2005;14:701-6
19. Nagahama Y, Ueno M, Haraguchi N. et al. PSF3 marks malignant colon cancer and has a role in cancer cell proliferation. Biochem Biophys Res Commun. 2010;392:150-4
20. Ryu B, Kim DS, Deluca AM. et al. Comprehensive expression profiling of tumor cell lines identifies molecular signatures of melanoma progression. PLoS One. 2007;2:e594
21. Li Y, Yin S, Nie D. et al. MK886 inhibits the proliferation of HL-60 leukemia cells by suppressing the expression of mPGES-1 and reducing prostaglandin E2 synthesis. Int J Hematol. 2011;94:472-8
22. Willis S, Catherine LD, Mark GH. et al. The BCL-2-regulated apoptotic pathway. Journal of Cell Science. 2003;116:4053-6
23. Juin P, Geneste O, Raimbaud E. et al. Shooting at survivors: BCL-2 family members as drug targets for cancer. Biochimica Biophysica Acta. 2004;1644:251-60
24. Ciccia A, Elledge SJ.The DNA damage response. making it safe to play with knives. Mol Cell. 2010;40:179-204
25. Levine AJ. P53, the cellular gatekeeper for growth and division. Cell. 1997;88:323-31
26. Foster SS, De S, Johnson LK. et al. Cell cycle and DNA repair pathway-specific effects of apoptosis on tumor suppression. Proc Natl Acad Sci U S A. 2012;109:9953-58
27. Abraham RT. Cell cycle checkpoint signaling through the ATM and ATR kinases. Genes Dev. 2001;15:2177-96
Author contact
![]() Corresponding author: Bei-Zhong Liu, Central Laboratory of Yong-chuan Hospital, Chongqing Medical University, Chongqing 402160, China. Tel: +86 15559881126, Fax: +86 023-68485006; E-mail: liubeizhongedu.cn
Corresponding author: Bei-Zhong Liu, Central Laboratory of Yong-chuan Hospital, Chongqing Medical University, Chongqing 402160, China. Tel: +86 15559881126, Fax: +86 023-68485006; E-mail: liubeizhongedu.cn