Impact Factor ISSN: 1449-1907

 Global reach, higher impact
Int J Med Sci 2013; 10(11):1570-1574. doi:10.7150/ijms.6681 This issue Cite
Research Paper
Direct Portal Vein Thrombosis Visualization with T2*-Weighted Magnetic Resonance Imaging
Chuanming Li1, Alice Hu2, Mark Haacke3, Jian Wang1, Jun Zhao1, Daiquan Zhou1 ![]()
1. Department of Radiology, Southwest Hospital, Third Military Medical University, 30 Gaotanyan Road, Chongqing 400038, China;
2. Department of Natural Sciences, Michigan State University, East Lansing, MI 48824, USA;
3. Department of Radiology, Wayne State University, Detroit, MI 48201.
Received 2013-5-13; Accepted 2013-8-12; Published 2013-9-7
Abstract
BACKGROUND AND PURPOSE: To investigate the feasibility of direct magnetic resonance portal vein thrombosis (PVT) visualization with T2*-weighted imaging (T2*WI) without contrast agent.
METHODS: Thirty patients with PVT were included in this study. All of them were imaged with contrast-enhanced CT (CE-CT) as well as non-contrast MRI T1, T2 and T2*WI. Imaging data was independently analyzed by two experienced radiologists. T2*WI of all PVT was compared slice-by-slice with each of the comparison sequences (T1WI, T2WI and CE-CT) on the following categories: the location, size, boundary, and conspicuity of thrombus and portal veins.
RESULTS: The average score of PVT visualization in T2*WI was higher than T1WI and T2WI in location, size, boundary and conspicuity (t = 7.54 - 84.16, P<0.05), and higher than CE-CT in boundary and conspicuity (t = 3.03- 6.98, P<0.05). For portal vein visualization, there was no significant score difference in left, middle and right portal veins between CE-CT and T2*WI (t = -1.76- 1.35, P>0.05).
CONCLUSIONS: Our results suggest T2*WI can characterize PVT accurately with high quality without the use of intravenous contrast agents.
Keywords: Portal Vein Thrombosis, MRI, T2*WI.
Introduction
Portal vein thrombosis (PVT) is a form of venous thrombosis affecting the hepatic portal vein which can lead to portal hypertension and decreased blood supply to the liver [1-2]. Contrast-enhanced (CE) angiography with computed tomography (CT) or magnetic resonance imaging (MRI) is the standard, noninvasive methods of imaging PVT. However, both CT and MR contrast agents have side effects for certain populations, including anaphylactic shock and nephrotoxic impairment [3-4]. There are other contraindications like pregnancy, hyperthyreosis or renal failure which also restrict their clinical use [5, 6]. Therefore, detection and characterization of PVT using MRI, without the need for intravenous contrast enhancement, holds great promise for these individuals.
T2*-weighted imaging (T2*WI) is sensitive to deoxygenated hemoglobin and ferrihemoglobin. In a case report of cerebral venous thrombosis, T2*WI seemed useful in thrombosis detection and evaluation [7]. However, until now there has been no study of PVT imaging with T2*WI. In this study, we proposed to implement T2*WI to improve PVT visualization without contrast agent and compare it with contrast enhanced CT (CE-CT) as well as conventional MR sequences.
Materials and methods
Subjects
This study was approved by the local Institutional Review Board and was conducted in accordance with the Declaration of Helsinki. From January 2011 to November 2012, 33 consecutive patients with confirmed PVT participated in this study. Three patients were excluded because: 1) could not sustain a 20 second breath hold (one case); 2) had a history of hepatic surgery (one case); 3) had implanted device for MRI (one case). Thus, totally thirty patients (20 males and 10 females, mean age 46±8.5 years) were included in this study. The PVT was localized in: the main portal trunk in 7 cases, the right branch in 12 cases, the left branch in 8 cases, and a combination of these in 3 cases. The 30 patients were diagnosed as having HCC (22 cases), hepatitis B- or C-related cirrhosis (18 cases), autoimmune cirrhosis (1 case), alcoholic cirrhosis (1 case). In the 22 cases of patients with HCC, 18 cases were neoplastic thrombi and 15 cases of them were not separate in site from the tumor. Each participant gave written informed consent to participate in the study.
Computed Tomographic Imaging
All subjects were imaged with dual-source CT (Definition, Siemens Healthcare, Forchheim, Germany). Imaging parameters were: 250 mAs, 120 kVp, 1.2 mm beam collimation with a 0.5 s gantry rotation time. Field-of-view (FOV) was 35 cm. Reconstruction thickness and interval were 5 mm. After the intravenous administration of 100-120 ml nonionic, iodinated contrast material (Ultravist 370, 370 mg iodine/mL, Bayer Schering Pharma, Leverkusen, Germany), at a rate of 3-4 ml/s, three dynamic images were acquired at 35 s (hepatic arterial phase), 70 s (portal venous phase), and 180 s (delayed phase).
MRI data acquisition
MR imaging for all subjects was performed on a 3.0 T whole body system (Magnetom Trio, Siemens Healthcare, Erlangen, Germany) using a standard 12-channel matrix coil, without intravenous contrast enhancement. The following sequence were used for each subject: transverse T1-weighted 2D gradient echo (GRE) (flip angle 70°, TR/TE 140/2.46 ms), transverse T2-weighted 2D fast spin echo (flip angle 122°, TR/ TE =3700/84 ms), and transverse T2*-weighted 2D GRE (flip angle 20°, TR/ TE =150/10 ms). For all sequences, the following parameters were used: field of view (FOV) 380 x 285 mm2; matrix 384 x 250; 30 slices, and slice thickness 5 mm. Depending upon the liver size, two to three breath holds of 15 to 20 s duration were used to cover the liver.
Image Analysis
Two senior radiologists with 10 and 12 years of MRI experience performed the quantitative image analysis. They were blinded to each other's interpretations. T2*WI of all PVT were compared slice-by-slice with each of the comparison sequences (T1WI, T2WI and CE-CT (portal venous phase)). All the sequences were presented to the reviewers randomly. For each sequence the following categories of PVT visualization were analyzed: location, size, boundary and conspicuity. The location, size and boundary were assigned a numerical value according to a four-point scale ranging from 0 to 3 as follows: 0 - no pertinent imaging characteristics; 1 - poorly visualized characteristics; 2 - partially defined characteristics; and 3 - well-defined, easily interpreted characteristics. The conspicuity was calculated based on the ratio of PVT signal intensity to background portal vein and graded on a 0 to 3 scale: grade 0 (no conspicuity), conspicuity ratios >0.9; grade 1 (low conspicuity), conspicuity ratios 0.7 and 0.9; grade 2 (moderate conspicuity), conspicuity ratios 0.4 and 0.7; grade 3 (high conspicuity), conspicuity ratio <0.4. If the portal vein was completely occluded, the ratios of PVT signal intensity to nonaffected same-order portal vein branches in the same lobe were calculated. The visualization of left, middle and right portal vein was also analyzed using a four-point scale as follows: 0 - not visible, 1 - partially visible without sufficient visualization, 2 - sufficient visualization without good image quality, and 3 - excellent image quality with sharply defined vessels. The average score for each category of each sequence was calculated by using the formula: (∑nx · scorex) / Nseq, where nx is the number of cases with a given score (0, 1, 2, or 3), scorex is the corresponding score, and Nseq is the number of cases for each sequence [8].
Statistical Analysis
All statistics were computed using dedicated statistical software (SPSS version 15.0, SPSS Inc., Chicago, Illinois). P values of 0.05 were considered statistically significant. The score of PVT and portal vein visualization by different techniques were compared by paired t test. Cohen's kappa method was used to assess inter-reader agreement.
Results
The T2*WI allowed excellent visualization of PVT and left, middle, right portal veins. In all 30 cases, the portal vein branches demonstrated a bright signal compared to the surrounding liver tissue. The PVT demonstrated a low signal and a high contrast to the surrounding bright venous blood stream, which could be correctly localized.
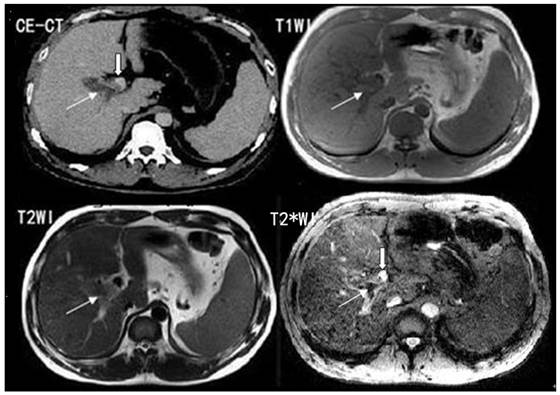
The comparison of PVT visualization score in T1WI, T2WI, T2*WI and CE-CT for two independent readers was illustrated in Table 1. The average score of PVT visualization in T2*WI was higher than T1WI and T2WI in location, size, boundary and conspicuity (t = 7.54 - 84.16, P<0.05), and higher than CE-CT in boundary and conspicuity (t = 3.03- 6.98, P<0.05) (Figure 1; Table 1).
Score of PVT visualization in T2*WI, T1WI, T2WI and CE-CT (Mean+/- SD).
| Location | Size | Boundary | Conspicuity | |
|---|---|---|---|---|
| T2*WI | 2.85±0.36 | 2.75±0.44 | 2.78±0.42 | 2.90±0.30 |
| T1WI | 0.73±0.45* | 0.87±0.39* | 0.83±0.37* | 0.78±0.42* |
| t=50.65 | t=45.06 | t=52.68 | t=44.02 | |
| T2WI | 0.60±0.49* | 0.78±0.42* | 1.08±0.46* | 2.35±0.68* |
| t=39.91 | t=84.16 | t=26.47 | t=7.54 | |
| CE-CT | 2.79±0.43 | 2.68±0.47 | 2.30±0.39* | 2.72±0.49* |
| t=1.32 | t=1.27 | t=6.98 | t=3.03 |
PVT: portal vein thrombosis; T2*WI: T2*-weighted imaging; T1WI: T1-weighted imaging; T2WI: T2-weighted imaging; CE-CT: Contrast-enhanced computed tomography. *P < 0.05 as compared with T2*WI.
T2*WI showing excellent PVT visualization. White thin arrows show the thrombosis; white thick arrows show the right portal vein.
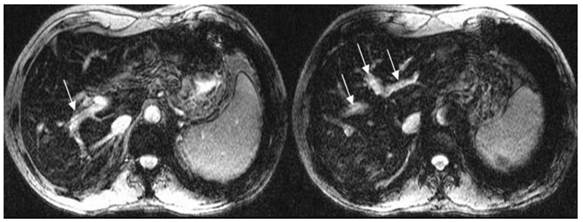
For portal vein visualization, there was no significant score difference in left, middle and right portal veins between CE-CT and T2*WI (t = -1.76- 1.35, p>0.05) (Figure 2; Table 2).
T2*WI showing good left, middle and right portal vein visualization. White arrows show the left, middle and right portal vein.
Score of portal vein visualization in T2*WI and CE-CT (Mean+/- SD).
| T2*WI | CE-CT | t | P | |
|---|---|---|---|---|
| LPV | 2.88±0.32 | 2.93±0.25 | -1.76 | >0.05 |
| MPV | 2.87±0.34 | 2.90±0.30 | -1.43 | >0.05 |
| RPV | 2.90±0.30 | 2.85±0.36 | 1.35 | >0.05 |
LPV: left portal vein, MPV: middle portal vein, RPV: right portal vein; T2*WI: T2*-weighted imaging; CE-CT: Contrast-enhanced computed tomography.
Discussion
The main noninvasive imaging modalities for clinical imaging of PVT are Doppler ultrasound, contrast enhanced CT and MRI. There are documented disadvantages associated with each of these modalities. Doppler ultrasound is notorious for being user dependent and can be difficult in obese patients [9, 10]. CE - CT produces high-quality images, particularly with the introduction of multi-detector CT. However, this modality has several disadvantages which include radiation exposure and the use of contrast materials, which has been shown to lead to fatal induced anaphylaxis and nephropathy [11]. Gadolinium-enhanced MRI has been used as an accurate, non-invasive method for evaluating vascular structures, including the hepatic vessels [12]. High-dose gadolinium compounds were used for a wide-range of MRI acquisitions and increasingly replaced CT angiography in patients with reduced renal function [13]. However, nephrogenic systemic fibrosis caused by gadolinium in patients with poor renal function has been reported and severe complications have been identified [14, 15]. Un-enhanced MRI is a better approach for avoiding the potentially severe adverse effects associated with contrast materials, particularly if it can provide better imaging quality.
In this study, we evaluated 30 PVT patients using T2*WI without contrast agents. We found all PVT could be identified successfully in T2*WI. They appeared with high contrast to the surrounding bright venous blood stream and liver tissue. The average score of PVT visualization in T2*WI was higher than conventional T1WI and T2WI in location, size, boundary and conspicuity. CE-CT is currently the standard of PVT imaging. In this study, the average score of PVT visualization in T2*WI was greater than CE-CT in boundary and conspicuity. Clear anatomical images of the portal vein are important to identify the position of PVT. In our study the average score of left, middle and right portal vein visualization in T2*WI were similar with those in CE-CT. These findings suggest that T2*WI is a powerful, efficient tool for the identification and evaluation of PVT and the portal venous system. Using this method, a complete diagnosis can be achieved in one session with very short measurement time without the need of contrast agents or exposure to radiation. This makes it suitable for repeated examinations, follow-up studies, pregnant subjects, and for those patients with contraindication to contrast media administration.
To our knowledge, this is the first study of MRI PVT imaging without contrast use. Thrombus imaging using MRI without the need for intravenous contrast enhancement has been reported in deep vein thrombosis (DVT) of legs and pelvis [16]. It relies on the high contrast of the thrombus on T1WI images with effective suppression of other back sources of high signal. The high signal intensity of the thrombus in T1-weighted images is due to degeneration products, which shorten T1-relaxation times [17]. Many sequences have been used in imaging DVT of the legs and pelvis [18-20]. However, venous structures are typically not clearly visualized and the relationship between thrombus and its surroundings were ill-defined with these methods. Due to the respiratory movement influence, this T1-MRI technology has not been used in PVT until now.
There are several limitations in this study. First, the inclusion of patients only with known PVT introduces a bias. Second, compared with CT, the relatively low resolution of T2*WI may miss thrombus in small portal venous branches. Using high spatial resolution could help partly overcome this issue. Secondly, our use of four consecutive breath-hold acquisitions for coverage of the entire liver may not be feasible in all cirrhotic patients, especially those with pulmonary compromise from hepatopulmonary syndrome or ascites. Lastly, while T2*WI is a useful tool in the evaluation of PVT, CT is still more useful in giving additional information as regards other viscera.
In conclusion, T2*WI can characterize PVT and portal vein clearly with high quality and should be a useful addition to current imaging techniques. There is no need for intravenous contrast agents, which make it suitable for repeated examinations and follow-up studies, especially for the case of pregnancy or for patients with contraindication to contrast media administration.
Acknowledgements
This study was supported by the Clinical Research Foundation of Southwest Hospital, Third Military Medical University, China (Grant No. SWH2011LC008).
Competing Interests
The authors have declared that no competing interest exists.
References
1. Wang JT, Zhao HY, Liu YL. Portal vein thrombosis. Hepatobiliary Pancreat Dis Int. 2005;4:515-518
2. Farmer AD, Saadeddin A, Holt CE, Bateman JM, Ahmed M, Syn WK. Portal vein thrombosis in the district general hospital: management and clinical outcomes. Eur J Gastroenterol Hepatol. 2009;21:517-521
3. Baker ME, Remzi F, Einstein D. et al. CT depiction of portal vein thrombi after creation of ileal pouch-anal anastomosis. Radiology. 2003;227:73-79
4. Konrády A. Iodine allergy--adverse reactions to contrast media. Orv Hetil. 2006;147:469-472
5. Weisser G, Steil V, Neff KW, Büsing KA. Radiology and pregnancy. Principles, general requirements and exposure. Radiology. 2012;52:81-90
6. Rajaram S, Exley CE, Fairlie F, Matthews S. Effect of antenatal iodinated contrast agent on neonatal thyroid function. Br J Radiol. 2012;85:e238-242
7. Aoki J, Iguchi Y, Kimura K. et al. Serial T2*WI studies in the acute phase of cerebral venous thrombosis. Intern Med. 2009;48:383-385
8. Vivek S, Zachary D, Djamel H, Yamashita S, Shibazaki K, Terasawa Y. Susceptibility-Weighted Imaging to Visualize Blood Products and Improve Tumor Contrast in the Study of Brain Masses. Journal of magnetic resonance imaging. 2006;24:41-51
9. Huang TL, Cheng YF, Chen TY. et al. Doppler ultrasound evaluation of postoperative portal vein stenosis in adult living donor liver transplantation. Transplant Proc. 2010;42:879-881
10. Chen Y, Chen J, Luo B. Colored Doppler ultrasound-guided fine-needle aspiration biopsy of portal vein thrombosis: value in diagnosis and assessment of therapeutic efficacy for portal vein thrombosis. Zhonghua Zhong Liu Za Zhi. 1997;19:362-364
11. Tonelli M, Wiebe N, Culleton B. et al. Chronic kidney disease and mortality risk: a systematic review. J Am Soc Nephrol. 2006;17:2034-2047
12. Rieger J, Sitter T, Toepfer M, Linsenmaier U, Pfeifer KJ, Schiffl H. Gadolinium as an alternative contrast agent for diagnostic and interventional angiographic procedures in patients with impaired renal function. Nephrol Dial Transplant. 2002;17:824-828
13. Bongartz G, Mayr M, Bilecen D. Magnetic resonance angiography (MRA) in renally impaired patients: when and how. Eur J Radiol. 2008;66:213-219
14. Cowper SE, Robin HS, Steinberg SM, Su LD, Gupta S, LeBoit PE. Scleromyxoedema-like cutaneous diseases in renal-dialysis patients. Lancet. 2000;356:1000-1001
15. Grobner T. Gadolinium - a specific trigger for the development of nephrogenic fibrosing dermopathy and nephrogenic systemic fibrosis? Nephrol Dial Transplant. 2006;21:1104-1108
16. Westerbeek RE, Van Rooden CJ, Tan M. et al. Magnetic resonance direct thrombus imaging of the evolution of acute deep vein thrombosis of the leg. J Thromb Haemost. 2008;6:1087-1092
17. Moody AR. Magnetic resonance direct thrombus imaging. J Thromb Haemost. 2003;1:1403-1409
18. Moody AR, Pollock JG, O'Connor AR, Bagnall M. Lower-limb deep venous thrombosis: direct MR imaging of the thrombus. Radiology. 1998;209:349-355
19. Murphy RE, Moody AR, Morgan PS. et al. Prevalence of complicated carotid atheroma as detected by magnetic resonance direct thrombus imaging in patients with suspected carotid artery stenosis and previous acute cerebral ischemia. Circulation. 2003;107:3053-3058
20. Schmitza SA, O'Regana DP, Gibsonb D. et al. Magnetic resonance direct thrombus imaging at 3 T field strength in patients with lower limb deep vein thrombosis: a feasibility study. Clinical Radiology. 2006;61:282-286
Author contact
![]() Corresponding author: Daiquan Zhou M.D. Department of Radiology, Southwest Hospital, Third Military Medical University, 30 Gaotanyan Road, Chongqing 400038, China. E-mail: zhou_daiquancom.
Corresponding author: Daiquan Zhou M.D. Department of Radiology, Southwest Hospital, Third Military Medical University, 30 Gaotanyan Road, Chongqing 400038, China. E-mail: zhou_daiquancom.