Impact Factor ISSN: 1449-1907

 Global reach, higher impact
Int J Med Sci 2013; 10(3):265-275. doi:10.7150/ijms.5344 This issue Cite
Research Paper
Pharmacophore Modeling, Virtual Screening, and Molecular Docking Studies for Discovery of Novel Akt2 Inhibitors
Jia Fei1, Lu Zhou1 ![]() , Tao Liu1, Xiang-Yang Tang2
, Tao Liu1, Xiang-Yang Tang2
1. College of Chemical Engineering, Sichuan University, Sichuan, Chengdu, 610065, China;
2. College of Computer Science, Southeast University for Nationalities, Sichuan, Chengdu, 610041, China.
Received 2012-10-6; Accepted 2012-12-21; Published 2013-1-23
Abstract
Akt2 is considered as a potential target for cancer therapy. In order to find novel Akt2 inhibitors which have different scaffolds, structure-based pharmacophore model and 3D-QSAR pharmacophore model were built and validated by different methods. Then, they were used for chemical databases virtual screening. The selected compounds were further analyzed and refined using drug-like filters and ADMET analysis. Finally, seven hits with different scaffolds were picked out for docking studies. These seven hits were predicted to have high inhibitory activity and good ADMET properties, they may act as novel leads for Akt2 inhibitors designing.
Keywords: Akt2, inhibitor, pharmacophore, docking, virtual screening.
Introduction
Akt, also known as Protein Kinase B (PKB), is a serine/threonine kinase that plays a crucial role in the regulation of the PI3K/Akt pathway [1]. Akt as a downstream target of PI-3 kinase can induce a variety of biological responses. Many growth factors such as IGF-1 and PDGF bind to their receptors and lead to activation of PI-3 kinase. PI-3 kinase phosphorylates the Ptdlns to generate Ptdlns-3-phosphates, Ptdlns(3)P, Ptdlns(3, 4)P2, and Ptndlns(3, 4, 5)P3. The Ptdlns-3-phosphates cause the transportation of Akt from the cytoplasm to the plasma membrane [2, 3]. Then, Akt is activated when residues Thr308 and Ser473 are phosphorylated by PDK1 and PDK2. Active Akt inhibits apoptosis and stimulates cell cycle progression by phosphorylating numerous targets in various cell types. [4]
Three isoforms of Akt are known to exist, namely Akt1, Akt2 and Akt3, which exhibit an overall homology of 80% [5]. All three Akt isoforms are either overexpression or activated in a variety of human tumors, such as lung, breast, prostate, ovarian, gastric, and pancreatic carcinomas [6-7]. Besides, multiple observations point that Akt can act as an important cancer drug discovery target, including: (1) the tumor suppressor PTEN, a negative regulator of Akt kinase activity, is mutated or deleted at high frequency in solid human cancers and several cancer susceptibility syndromes; (2) Akt is activated via growth factor receptors or ligands that are up-regulated in a wide variety of solid human tumors; (3) AKT gene amplification has been reported in several cancer lines [8]. So, inhibition of the enzyme through small molecule could potentially sensitize cancer cells to undergo apoptosis.
So far, high-throughput screening has been used for finding Akt inhibitors, but it was mainly used for Akt1. In order to search high active Akt2 inhibitors which have different scaffolds, we developed 3D-QSAR pharmacophore model as well as structure-based pharmacophore, the obtained pharmacophore models are expected to identify the crucial pharmacophore features of potent Akt2 inhibitors. Then these two kinds of pharmacophore models were used together as 3D search queries for chemical compound databases. The selected compounds were retrieved from databases, and were further analyzed and refined using drug-like filters and ADMET analysis. At last, seven hits were selected, they have different scaffolds, high estimated activity, and good ADMET properties. Molecular docking was carried out to study the bind modes of these hits and Akt2. All the studies show that the seven hits may act as novel leads for Akt2 inhibitors designing.
Materials and methods
Generation of structure-based pharmacophore model
Structure-based pharmacophore modeling can effectively be used where there is insufficient information on ligands that are experimentally proved to block or induce the activity of a particular therapeutic target. It can also be used to extract more information from the receptor side which can enable a medicinal chemist to have a deeper insight [9]. In our study, a crystal structure (PDB codes: 3E8D) of Akt2 complexed with a known inhibitor was employed to generate structure-based pharmacophore model. In order to get more information about the active site of the enzyme and the binding mode of Akt2 and inhibitors, other crystal structures were also taken into account during the pharmacophore generation process, such as 3E88, 3D0E and 2JDR. This step was carried out by using DS 2.5 program. A sphere within 7 Å distance from the inhibitor was generated using Binding Site tool, Interaction Generation protocol of DS was applied to generate pharmacophoric features corresponding to all the possible interaction points at the active site. And then Edit and Cluster pharmacophores tool was utilized to edit the redundant and pharmacophoric features with no catalytic importance. Only the representative features with catalytic importance were selected. Finally, exclusion volume was added to the pharmacophore. After these operation, a structure-based pharmacophore model (PharA) comprising the most important pharmacophoric features was built.
Generation of 3D QSAR pharmacophore model
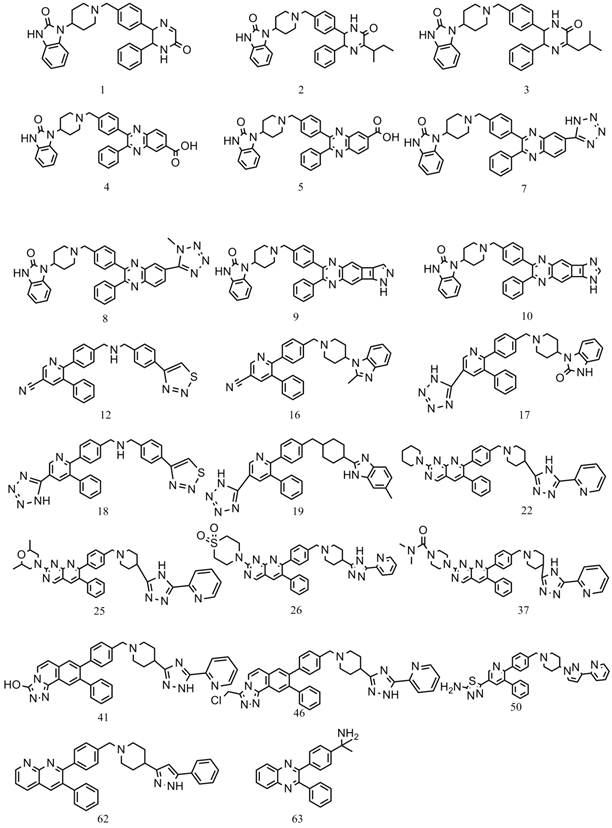
Accelrys Discovery studio v2.5 was used to generate the hypothesis. A set of 63 compounds were collected from Merck Research Laboratories [10-15], the activity represented as IC50 of all the compounds were measured by using the same method. And their activity spans over 5 orders. 23 compounds of them were chosen as the training set to generate the pharmacophore model, structures of these training set compounds were given in Figure 1. Other compounds were chosen as the test set to validate the developed model. 3D structures of these molecules were built by ChemBioOffice version 2010, and energies of all the structures were minimized by Minimization protocol in DS. Then a series of energetically reasonable conformations of each training set compound were generated using Generate Conformations protocol. The related parameters were chosen for generating conformations as following: conformation method: maximum conformations: 255, best energy threshold: 20 kcal/mol. Then whole diverse conformations of these training set compounds were used to generate pharmacophore models using 3D-QSAR Pharmacophore Generation Protocol.
Structures of the training set compounds.
Pharmacophore validation
Pharmacophore validation was to test whether or not our models are good enough to predict the active compounds. Three validation methods were used in this step: Fischer's method; test set and decoy set. Structure-based pharmacophore PharA was validated by test set and decoy set, and 3D-QSAR pharmacophore were validated by all the three methods. For the 3D-QSAR pharmacophore, the test set was composed by 40 molecules. But all the 68 collected active compounds were included in the test set of the structure-based parmacophore. The decoy set consisted of 2000 molecules which comprised of 1980 molecules with unknown activity and 20 known inhibitors of Akt2.
Virtual screening
The purpose of virtual screening is to find potential leads with different scaffolds and high inhibitory activity to Akt2. We used the structure-based pharmacophore and the best 3D-QSAR pharmacophore as 3D query for searching potent compounds from two chemical databases, including Nature Products (199,806) and Asinex database (508494) which were downloaded from Zinc database.
Drug-likeness and ADMET analysis
The compounds which fitted not only the features of the structure-based pharmacophore but also the best 3D-QSAR pharmacophore model were extracted, further filtered by Lipinski's rule, and then, ADMET (absorption, distribution, metabolism, elimination, toxicity) analysis was carried out. Only these molecules which in accordance with Lipinski's rule and have good predicted activity and good ADMET properties can be considered as hits. Besides, in order to compare the ADMET properties between the known inhibitors and the hits, all the 68 active molecules we collected were also taken into ADMET analysis.
Docking study
In order to understand how these ligands bind to the enzyme, hits molecules and training set molecules were taken for docking studies by using GOLD 5.0 program. Crystal structure 3E8D was used to define the interaction. The binding energies of Akt2 with hits were predicted using ChemScore which is taken as the negative of the sum of the component energy terms. [16]
Results and discussion
Structure-based pharmacophore generation and validation
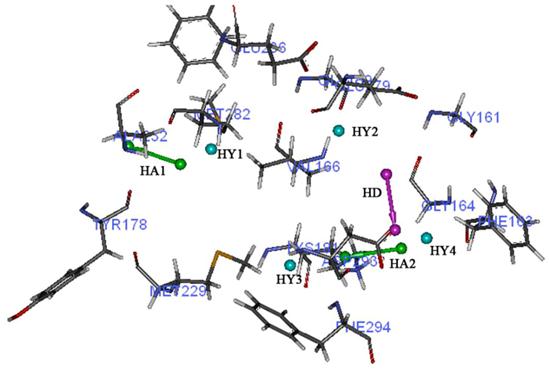
The final structure-based pharmacophore hypothesis (PharA) comprised seven pharmacophoric features (Figure 2), two hydrogen bond acceptors, one hydrogen bond donor and four hydrophobic groups, besides, eighteen exclusion volume spheres are also taken into consideration. All the pharmacophoric features are around the important active site of Akt2. Hydrogen bond acceptor 1 (HA1) is near the amino group of Ala232. There is a short distance between HA2 and the amino group of Phe294 and Asp293. The hydrogen bond donor (HD) is just at the neighborhood of the carboxyl of Asp293. Groups in line with these pharmacophoric features may form hydrogen bonds with adjacent amino acids. Hydrophobic feature 1 (HY1) is located in a hydrophobic pocket composed by Phe439, Met282 and Ala178. The second hydrophobic feature (HY2) is located in another hydrophobic pocket constituted by Gly159, Val166, Gly164 and Gly161. HY3 is near Met229 and Lys181. HY3 is very close to Phe294. HY4 is close to hydrophobic amino acids Phe163 and Lys181. Groups in line with these hydrophobic features may result in hydrophobic interaction between the small molecule and the enzyme. So, compounds mapping on some of these identified features may have potential to inhibit Akt2 with high affinity.
Chemical features of PharA with the nearby amino acids. HA stands for hydrogen acceptor; HD stands for hydrogen donor; HY means hydrophobic feature.
In order to verify the reliability of this structure-based pharmacophore, test set validation and decoy set validation were used. 63 active compounds collected from literatures were put together to build up the test set. After validation, all active molecules can mapped with any six of the seven pharmacophoric features of the structure-based pharmacophore model. It means the result of test set validation is very good. The result of test set validation could only indicate that this pharmacophore model can pick out the active molecules, but can not ensure that compounds without inhibitory activity would be excluded. The main reason to validate the pharmacophore by decoy set is to validate how well it predicts active molecules from inactive molecules [17]. A decoy set including 1980 molecules with unknown activity and 20 active compounds is prepared for this step. Enrichment Factor (EF) and Goodness of Hit Score (GH) were calculated to evaluate PharA. EF and GH were calculated using below equations:
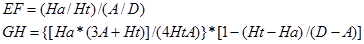
where Ht is the number of hits retrieved, Ha is the number of active molecules in the hit list, A represents the number of active molecules present in the database and D stands for the total number of molecules in the decoy set. The GH score ranges from 0, which indicates the null model, to 1, which indicates the ideal model. When GH score is higher than 0.7, the model is very good [18]. In this validation, 16 active compounds and 7 molecules with unknown activity were selected out. The EF and GH are found to be 69.57 and 0.72, indicates PharA is rational for virtual screening.
3D-QSAR pharmacophore generation and validation
Ten top-score pharmacophore hypotheses were generated based on the activity values of 23 training set compounds. Total cost values, correlation coefficient, RMS deviation and pharmacophore features of all the hypotheses are summarized in Table 1. All the hypotheses have three kinds of features: hydrogen bond acceptor (HA), aromatic ring (R), and hydrophobic (HY). The fixed cost which represents the simplest model that fits data perfectly is 83.1856. The null cost is 181.465.
Statistical parameters of the top ten pharmacophore hypotheses of pharmacophore generation process.
| Hypothesis | Total cost | Cost difference | RMSD (Å) | Correlation | Features |
|---|---|---|---|---|---|
| Hypo1 | 98.92 | 82.55 | 0.99 | 0.95 | HA, H, R |
| Hypo2 | 104.61 | 76.86 | 1.31 | 0.91 | HA, H, R |
| Hypo3 | 105.91 | 75.56 | 1.34 | 0.91 | HA, H, R |
| Hypo4 | 107.04 | 74.43 | 1.31 | 0.91 | HA, H, R |
| Hypo5 | 107.89 | 73.58 | 1.44 | 0.89 | HA, H, R |
| Hypo6 | 108.20 | 73.27 | 1.37 | 0.90 | HA, H, R |
| Hypo7 | 109.86 | 71.61 | 1.49 | 0.88 | HA, H, R |
| Hypo8 | 110.07 | 71.4 | 1.43 | 0.89 | HA, H, R |
| Hypo9 | 110.39 | 71.08 | 1.48 | 0.89 | HA, H, R |
| Hypo10 | 110.56 | 70.91 | 1.45 | 0.89 | HA, H, R |
Cost difference = Null cost - total cost; Null cost = 181.47; Fixed cost = 83.19; Configuration = 15.29; HA: hydrogen bond acceptor; H: hydrophobic; R: aromatic ring.
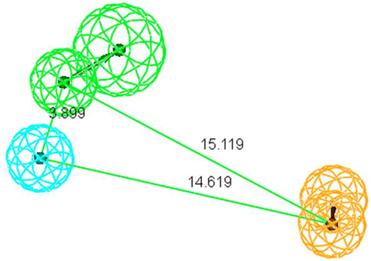
Hypo1 (Figure 3) has three pharmacophoric features: one hydrogen bond acceptor, one hydrophobic feature, and an aromatic ring. The difference between total cost and null cost of Hypo1 is 82.5448, this large cost difference indicates that the pharmacophore model could be considered as a good hypothesis, because when the difference is greater than 70 bits, it indicates over 90% statistics of the model is significant. RMSD value of Hypo1 is 0.986925, and coefficient value is 0.952600, the important factor configuration value is 15.2906. These data also shows that Hypo1 may be a good model. All the training set compounds were classified into three activity scales based on their activity values: high active, IC50 ≤ 100nM; moderate active, 100nM < IC50 ≤ 1000nM; low active, IC50 > 1000nM. Only two molecules in the training set were estimated out of their scales.
Chemical features of Hypo1. Green color represents hydrogen bond acceptor, blue means hydrophobic feature, and orange represents aromatic ring.
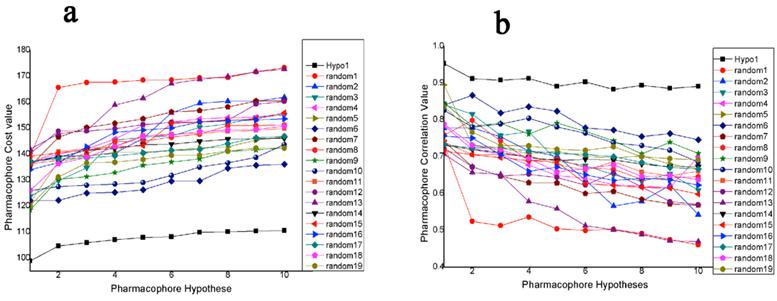
Fischer's randomization was applied to validate the statistical relevance of Hypo1. The confidence level was set to 95%, a total of 19 random spreadsheets were created when generated pharmacophore model. Result of this validation is shown in Figure 4. For Hypo1, the total cost value is 98.9202 and the correlation is 0.952602, while the total cost value of 19 random spreadsheets range from 118.462 to 141.867, correlation of these random spreadsheets are between 0.706275 and 0.894389. In summary, total cost of all random spreadsheets are higher than the originally pharmacophore and the correlation are lower. So, Hypo1 passed the Fischer's randomization validation.
(a): The difference in total cost of hypotheses between the initial hypothesis (Hypo1) spreadsheet and 19 random spreadsheets. (b): The difference in correlation values of hypotheses between Hypo1 spreadsheet and 19 random spreadsheets.
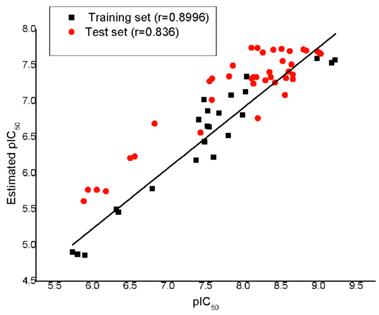
The test set method was used for verifying whether the pharmacophore model is capable of predicting the activity values of compounds not included in the training set. The test set contains 40 active compounds. Experimental and estimated activity values of the test set compounds are given in Table 2 as well as the 23 training set compounds. In order to corroborate the predictive capacity of Hypo1, we classified the 40 active compounds into three activity scales like the training set compounds, 1 high active, 5 moderate active and 2 low active molecules out of their scales when predicted by Hypo1, and the error values of all the compounds are lower than 8. Regression analysis shows that: experimental and estimated activity predicted using Hypo1 of the training set obtains a high correlation coefficient of 0.8996, and the test set obtains a correlation coefficient of 0.836. The correlation coefficient plot between experimental and estimated activity of training set and test set shows in Figure 5.
Experimental and estimated IC50 values of the training set and test set compounds based on pharmacophore model Hypo1.
| Name | Activity (IC50, nM) | Error | Name | Activity (IC50, nM) | Error | ||
|---|---|---|---|---|---|---|---|
| Experimental | Estimated | Experimental | Estimated | ||||
| 1* | 15700 | 13426.4 | -1.2 | 33 | 22 | 42.6 | 1.9 |
| 2* | 4517 | 3472.1 | -1.3 | 34 | 73 | 46.2 | -1.6 |
| 3* | 325 | 367.2 | 1.1 | 35 | 16 | 19.1 | 1.2 |
| 4* | 281 | 227.7 | -1.2 | 36 | 23 | 30.8 | 1.3 |
| 5* | 388 | 181.3 | -2.1 | 37* | 6 | 26.7 | 4.5 |
| 6 | 65 | 18.2 | -3.6 | 38 | 31 | 18.7 | -1.7 |
| 7* | 144 | 82 | -1.8 | 39 | 11410 | 1696.4 | -6.7 |
| 8* | 332 | 94.8 | -3.5 | 40 | 9.4 | 21.9 | 2.3 |
| 9* | 300 | 221.5 | -1.4 | 41* | 6.7 | 29.3 | 4.4 |
| 10* | 210 | 146.7 | -1.4 | 42 | 10.4 | 20.3 | 2 |
| 11 | 3139 | 617.2 | -5.1 | 43 | 24.1 | 20.1 | -1.2 |
| 12* | 4811 | 3185.7 | -1.5 | 44 | 10 | 20.8 | 2.1 |
| 13 | 6650 | 1781.2 | -3.7 | 45 | 14.6 | 19.8 | 1.4 |
| 14 | 8740 | 1689 | -5.2 | 46* | 10.5 | 25.5 | 2.4 |
| 15 | 13000 | 2439.5 | -5.3 | 47 | 38 | 55 | 1.4 |
| 16* | 18360 | 12433.6 | -1.5 | 48 | 28 | 81.8 | 2.9 |
| 17* | 157 | 299 | 1.9 | 49 | 22 | 49.4 | 2.2 |
| 18* | 248 | 603.4 | 2.4 | 50* | 90 | 45.7 | -2 |
| 19* | 422 | 660.3 | 1.6 | 51 | 51 | 51.2 | 1 |
| 20 | 1501 | 204.3 | -7.3 | 52 | 73 | 57.1 | -1.3 |
| 21 | 262 | 95.3 | -2.7 | 53 | 30 | 27.5 | -1.1 |
| 22* | 93 | 73.4 | -1.3 | 54 | 370 | 271.8 | -1.4 |
| 23 | 43 | 46.1 | 1.1 | 55 | 64 | 171.7 | 2.7 |
| 24 | 45 | 39.4 | -1.1 | 56 | 2746 | 582.5 | -4.7 |
| 25* | 102 | 154.4 | 1.5 | 57 | 40 | 19.2 | -2.1 |
| 26* | 297 | 136.9 | -2.2 | 58 | 55.1 | 21.1 | -2.6 |
| 27 | 77 | 48.4 | -1.6 | 59 | 77.9 | 18 | -4.3 |
| 28 | 25 | 38.7 | 1.5 | 60 | 280 | 52.7 | -5.3 |
| 29 | 27 | 47.7 | 1.8 | 61 | 260 | 48.3 | -5.4 |
| 30 | 138 | 32 | -4.3 | 62* | 1600 | 1649.1 | 1 |
| 31 | 154 | 45.2 | -3.4 | 63* | 12500 | 13814.5 | 1.1 |
| 32 | 67 | 46.2 | -1.5 | ||||
* The compounds were used to build training set. Error indicates the difference between the experimental and estimated values. “+” represents that estimated value is higher than experimental activity. “-” represents that estimated IC50 is lower than experimental IC50.
Plot of the correlation (r) between the experimental and the Hypo1 estimated activity values of the 23 training set compounds (square) and 40 test set compounds (ring).
Decoy set validation were also used to verify Hypo1. The decoy set was same with that used in the structure-based pharmacophore validation. The EF value of Hypo1 is 42.86 and GH value is 0.50. This result is not very satisfactory. But if we used PharA to screen the decoy set first, and then, the selected molecules were screened by Hypo1 again, the EF increases to 80.00 and the GH value turns into 0.79. In order to obtain accurate predictive capability and high GH value at the same time, we choose PharA and Hypo1 together as the model to screen the database at last.
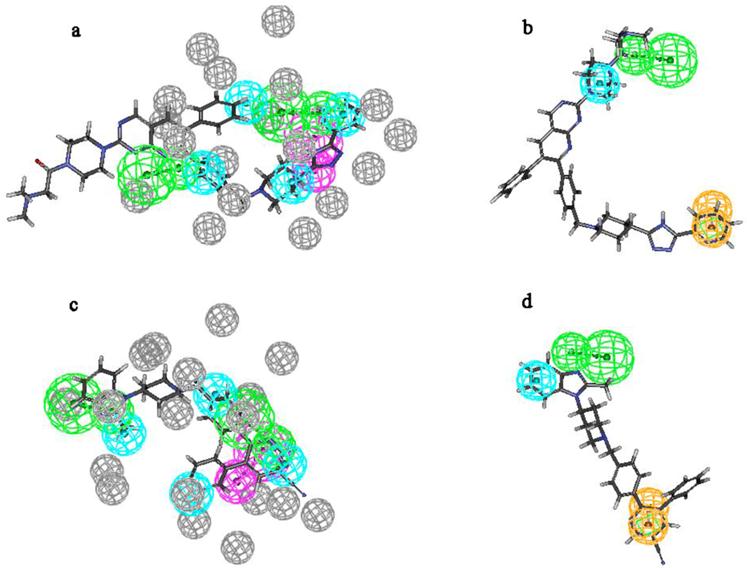
In order to displace how these active molecules map on PharA and Hypo1, Figure 6 gives the alignment of these models on the most active compound 37 and the most inactive compound 16. All the chemical features of Hypo1 map well on the corresponding functional groups of compound 37. The most inactive compound 16 maps on all features of Hypo1 too, but it's fitvalue is lower than compound 37. Compound 37 misses a hydrogen bond donor feature of PharA and compound 16 misses a hydrogen bond donor of PharA.
(a): Pharmcophore model PharA aligns to the most active compound (compound 37); (b) Hypo1 aligns to compound 37; (c): PharA aligns to the most inactive compound (compound 16); (d) Hypo1 aligns to compound 16.
Virtual screening
Nature Products (199,806) and Asinex database (508494) downloaded from Zinc database were used for virtual screening in our study. Structure-based pharmacophore PharA was firstly used to screen databases, then, Hypo1 was applied to screen the selected molecules. After these two steps, 128 compounds were picked out.
Drug-likeness analysis
Drug-likeness properties are usually used for selecting compounds for vitro inhibition studies. Here, Lipinski's rule of five was slightly modified according to the properties of existing inhibitors. The restrictions were as follows: AlogP ≤ 7.5, molecular weight ≤ 550D, hydrogen bond acceptors should be less than 10, hydrogen bond donors should be less than 5, and rotated bonds must be less than 10. After drug-likeness screening, 128 molecules reduce to 41 compounds.
ADMET analysis
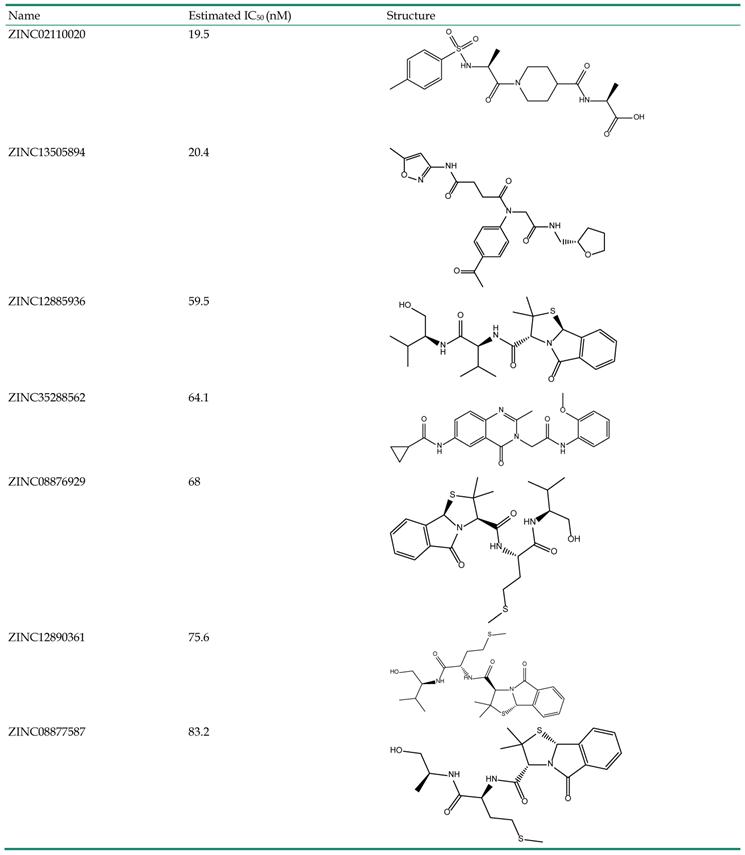
ADMET (absorption, distribution, metabolism, elimination, toxicity) analysis is important in drug design. Some properties including human intestinal absorption, aqueous solubility levels, BBB penetration levels, CYP2D6 inhibition and hepatotoxicity of these 41 compounds were analyzed. Molecules only with the following properties can be selected out as hits. Their Brain-Blood ratio must be less than 0.3 : 1, and they must be unlikely to inhibit CYP2D6 enzyme, unlikely to cause dose-dependent liver injuries, aqueous solubility level log(Sw) must be more than -4.0 and less than 0.0, and should have moderate or good intestinal absorption. After adding these restrictions, only 7 molecules meet the conditions. The information of these seven hits is listed in Table 3.
Information of the seven hits.
32 molecules in the training and test set belong to the high active inhibitors, ADMET analysis shows that only 4 compounds of them are predicted to have moderate or good human intestinal absorption. However, the 4 compounds are predicted to have the possibility to cause liver injury. These results indicate that although there have been some high active inhibitors of Akt2, their ADMET properties are not satisfactory. It may be troublesome to use them for further experiments in vivo.
Molecular docking studies
In order to understand the binding mode, 7 hits retrieved from virtual screening and 23 training set compounds were docked to the crystal structure of Akt2 binding site using GOLD program. Compound 37, the most active compound in the training set, has scored 27.90. Here, the two most active hits compounds are used as examples to display the bind modes.
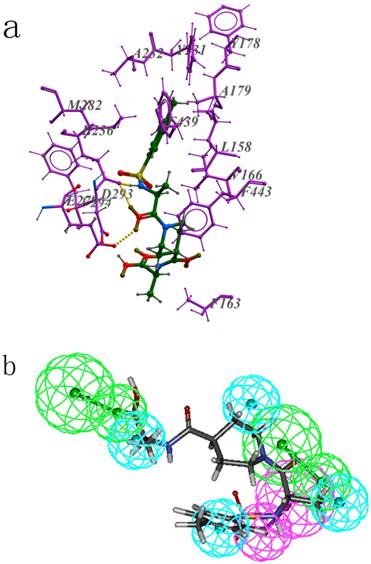
The most active hit ZINC02110020 scored 24.28, the interaction between it and Akt2 is shown in Figure 7a. And Figure 7b shows how it maps on the structure-based pharmacophore model. Oxygen of the carbonyl group near the nitrogen-containing six-membered ring forms two hydrogen bonds with the protein, one is with E279 and another one is with E236. This part of the compound maps well on the pharmacophoric feature HA2 of PharA. Besides, residue E236 also acts as a hydrogen bond acceptor, and forms another hydrogen bond with hydrogen atom of the imino group of the hit. In addition to hydrogen bond interaction, hydrophobic interaction also plays an important role in the binding mode. The benzene ring of the compound is a hydrophobic group, it can forms hydrophobic interaction with residues around it, such as F439, M282, A232, Y231, A179, Y178, V166, L158. Nitrogen-containing six-membered ring can also forms hydrophobic interaction with residues F443, F163, F294.
(a): The interaction between ZINC02110020 and Akt2 active site residues; (b): ZINC02110020 maps on the pharmacophore model PharA; (c): The binding mode of ZINC13505894 and Akt2 active sites; (d): ZINC13505894 aligns to PharA.
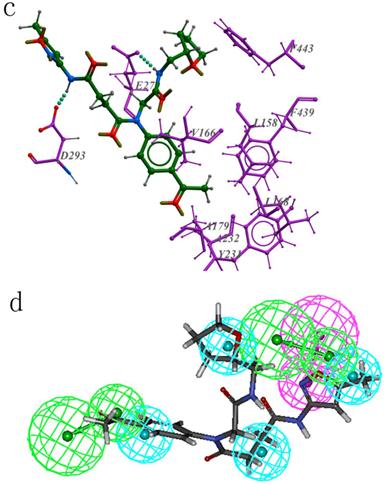
Bind mode and pharmacophore mapping situation of the second active hit ZINC13505894 are shown in Figure 7c and Figure 7d respectively. There are two hydrogen bonds between the ligand and the protein. One is between D293 and the amide of ZINC13505894. Another amide of the hit forms hydrogen bond with E279. The oxygen-containing five-membered ring on the hit compound is very close to F443, benzene ring of the F443 may have influence on the ring. The aromatic ring of the ligand is located in a hydrophobic environment, many hydrophobic residues are around here, such as F439, L158, V166, L168, A179, A232, Y231.
Conclusions
In this study, two kinds of pharmacophores were built to screen novel and potent Akt2 inhibitors. PharA, the structure-based pharmacophore, is composed of seven chemical features including two hydrogen bond acceptors, one hydrogen bond donor, and four hydrophobic features. Hypo1, the 3D-QSAR pharmacophore, has three pharmacophoric features, one hydrogen bond acceptor, one aromatic ring center, and one hydrophobic feature. Both generated pharmacophore models were validated for its quality to identify new reliable chemical compounds. The validation procedure included three methods: test set validation, decoy set validation and Fischer's randomization. All the training set compounds have mapped all the features of Hypo1 but they did not map all the features of PharA. So we have selected compounds from two databases mapping all chemical features of Hypo1 and six or more chemical features of PharA. The selected compounds were further analyzed and refined using drug-like filters and ADMET analysis. At last, seven hits were selected out. Molecular docking procedure was carried out for these hits to understand the interaction between these hits and the target protein. In summary, all the studies show that, these seven hits may act as good leads against Akt2.
Competing Interests
The authors have declared that no competing interest exists.
References
1. Siu T, Liang J, Arruda J. et al. Discovery of potent and cell-active allosteric dual Akt 1 and 2 inhibitors. BIOORG MED CHEM LET. 2008;18:4186-4190
2. Scheid MP, Woodgett JR. Unravelling the activation mechanisms of protein kinase B/Akt. FEBS LETT. 2003;546:108-112
3. Cheng JQ, Lindsley CW, Cheng GZ. et al. The Akt/PKB pathway: molecular target for cancer drug discovery. Oncogene. 2005;24:7482-7492
4. Ko JH, Yeon W, Ryu S. et al. Synthesis and biological evaluation of 5-arylamino-6-chloro-1H-indazole-4,7-diones as inhibitors of protein kinase B/Akt. BIOORG MED CHEM LETT. 2006;16:6001-6005
5. Xu R, Banka A, Blake JF. et al. Discovery of spirocyclic sulfonamides as potent Akt inhibitors with exquisite selectivity against PKA. BIOORG MED CHEM LETT. 2011;21:2335-2340
6. Woods KW, Fischer JP, Claiborne A. et al. Synthesis and SAR of indazole-pyridine based protein kinase B/Akt inhibitors. BIOORGAN MED CHEM. 2006;14:6832-6846
7. Li Q, Woods KW, Thomas S. et al. Synthesis and structure-activity relationship of 3,4'-bispyridinylethylenes: Discovery of a potent 3-isoquinolinylpyriding inhibitor of protein kinase B (PKB/Akt) for the treatment of cancer. BIOORG MED CHEM LETT. 2006;16:2000-2007
8. Lippa B, Pan G, Corbett M. et al. Synthesis and structure based optimization of novel Akt inhibitors. BIOORG MED CHEM LETT. 2008;18:3359-3363
9. Thangapandian S, John S, Sakkiah S. et al. Potential virtual lead identification in the discovery of renin inhibitors: Application of ligand and structure-based pharmacophore modeling approaches. EUR J MED CHEM. 2011;46:2469-2476
10. Lindsley CW, Zhao Z, Leister WH. et al. Allosteric Akt (PKB) inhibitors: discovery and SAR of isozyme selective inhibitors. BIOORG MED CHEM LETT. 2005;15:761-764
11. Zhao Z, Leister WH, Robinson RG. et al. Discovery of 2,3,5-trisubstituted pyridine derivatives as potent Akt1 and Akt2 dual inhibitors. BIOORG MED CHEM LETT. 2005;15:905-909
12. Li Y, Liang J, Siu T. et al. Allosteric inhibitors of Akt1 and Akt2: Discovery of [1,2,4]triazolo[3,4-f][1,6]naphthyridines with potent and balanced activity. BIOORG MED CHEM LETT. 2009;19:834-836
13. Hartnett JC, Barnett SF, Bilodeau MT. et al. Optimization of 2,3,5-trisubstituted pyridine derivatives as potent allosteric Akt1 and Akt2 inhibitors. BIOORG MED CHEM LETT. 2008;18:2194-2197
14. Bilodeau MT, Balitza AE, Hoffman JM. et al. Allosteric inhibitors of Akt1 and Akt2: A naphthyridinone with efficacy in an A2780 tumor xenograft model. BIOORG MED CHEM LETT. 2008;18:3178-3182
15. Defeo-jones D, Barnett SF, Fu S. et al. Tumor cell sensitization to apoptotic stimuli by selective inhibition of specific Akt/PKB family members. MOL CANCER THER. 2005;4:271-279
16. Ma X, Zhou L, Zuo ZL. et al. Molecular docking and 3-D QSAR studies of substituted 2,2-bisary-bicycloheptanes as human 5-lipoxygenase-Activating protein (FLAP) inhibitors. QSAR COMB SCI. 2008;27:1083-1091
17. Chandrasekaran M, Sakkiah S, Lee KW. Combined ligand based pharmacophore modeling, virtual screening methods to identify critical chemical features of novel potential inhibitors for phosphodiesterase-5. J TAIWAN INST CHEM E. 2011;42:709-718
18. Elumalai P, Liu HL, Zhao JH. et al. Pharmacophore modeling, virtual screening and docking studies to identify novel HNMT inhibitors. J TAIWAN INST CHEM. 2012 doi:10.1016/j.jtice.2012.01.004
Author contact
![]() Corresponding author: zhouluedu.cn Tel: +86 028 85405220 Fax: +86 028 85403397.
Corresponding author: zhouluedu.cn Tel: +86 028 85405220 Fax: +86 028 85403397.