International Journal of Medical Sciences
ISSN: 1449-1907
3.2
Impact Factor
ISSN: 1449-1907

 Global reach, higher impact
Int J Med Sci 2013; 10(2):148-155. doi:10.7150/ijms.5293 This issue Cite
Research Paper
Stroke Volume Variation for Prediction of Fluid Responsiveness in Patients Undergoing Gastrointestinal Surgery
Cheng Li1#, Fu-qing Lin1#, Shu-kun Fu1, Guo-qiang Chen1, Xiao-hu Yang1, Chun-yan Zhu1, Li-jun Zhang2, Quan Li1 ![]()
1. Department of Anesthesiology, Shanghai Tenth People's Hospital, Tongji University School of Medicine, Shanghai, China.
2. Department of Anesthesiology, No.187 Hospital of PLA, Haikou, China.
#Contributed equally.
Received 2012-9-25; Accepted 2012-12-24; Published 2013-1-3
Citation:
Li C, Lin Fq, Fu Sk, Chen Gq, Yang Xh, Zhu Cy, Zhang Lj, Li Q. Stroke Volume Variation for Prediction of Fluid Responsiveness in Patients Undergoing Gastrointestinal Surgery. Int J Med Sci 2013; 10(2):148-155. doi:10.7150/ijms.5293. https://www.medsci.org/v10p0148.htm
Other stylesAbstract
Background: Stroke volume variation (SVV) has been shown to be a reliable predictor of fluid responsiveness. However, the predictive role of SVV measured by FloTrac/Vigileo system in prediction of fluid responsiveness was unproven in patients undergoing ventilation with low tidal volume. Methods: Fifty patients undergoing elective gastrointestinal surgery were randomly divided into two groups: Group C [n1=20, tidal volume (Vt) = 8 ml/kg, frequency (F) = 12/min] and Group L [n2=30, Vt= 6 ml/kg, F=16/min]. After anesthesia induction, 6% hydroxyethyl starch130/0.4 solution (7 ml/kg) was intravenously transfused. Besides standard haemodynamic monitoring, SVV, cardiac output, cardiac index (CI), stroke volume (SV), stroke volume index (SVI), systemic vascular resistance (SVR) and systemic vascular resistance index (SVRI) were determined with the FloTrac/Vigileo system before and after fluid loading. Results: After fluid loading, the MAP, CVP, SVI and CI increased significantly, whereas the SVV and SVR decreased markedly in both groups. SVI was significantly correlated to the SVV, CVP but not the HR, MAP and SVR. SVI was significantly correlated to the SVV before fluid loading (Group C: r = 0.909; Group L: r = 0.758) but not the HR, MAP, CVP and SVR before fluid loading. The largest area under the ROC curve (AUC) was found for SVV (Group C, 0.852; Group L, 0.814), and the AUC for other preloading indices in two groups ranged from 0.324 to 0.460. Conclusion: SVV measured by FloTrac/Vigileo system can predict fluid responsiveness in patients undergoing ventilation with low tidal volumes during gastrointestinal surgery.
Keywords: Stroke volume variation, tidal volume, Functional haemodynamic, Fluid balance, Gastrointestinal surgery.
Introduction
Precise assessment of volume state is a prerequisite for adequate volume replacement which may achieve optimal organ perfusion and oxygen supply. Frequently used standard preload indexes, such as central venous pressure (CVP), pulmonary artery occlusion pressure (PAOP), intrathoracic blood volume index (ITBI) and left ventricular end-diastolic area index (LVEDAI) often fail to provide reliable information and usually predict fluid responsiveness with conflicting results [1-4]. As an alternative to these static variables, assessment of stroke volume variation (SVV) has been used as a indicator for haemodynamic monitoring to predict fluid responsiveness in patients receiving mechanical ventilation [4-11].
Recently, arterial pulse waveform analysis has been proposed for monitoring of cardiac output (CO) and SVV (FloTrac/Vigileo; Edwards Lifesciences, Irvine, CA, USA) [12-15]. The accuracy and reliability of CO has been evaluated [16, 17], while the accuracy and clinical applicability of SVV measured with this system have not been fully evaluated [18-25]. The present study was performed to investigate the value of SVV in predicting fluid responsiveness in patients receiving gastrointestinal surgery in the presence of ventilation with intermittent positive-pressure ventilation (IPPV) mode, and conventional/low tidal volume.
Materials and methods
Patient data
The whole protocol was approved by the institutional review board committee of the medical faculty of Tenth People`s Hospital of Tongji University, and written informed consent was obtained from each patient before study. ASA I-II patients (n=50) aged 30-78 years who underwent elective gastrointestinal surgery were recruited into the present study, and then randomly divided into two groups: conventional tidal volume group (Group C, n1=20) and low tidal volume group (Group L, n2=30). Patients with pacemakers, history of cardiac arrhythmia, severe peripheral vascular disease, cardiac support (intra-aortic balloon pump), and persisting mitral or aortic dysfunction after surgery were excluded. All patients received intramuscular atropine (0.5 mg) and phenobarbital sodium (0.1 g) at 30 min before surgery.
Haemodynamic monitoring
Routine haemodynamic monitoring was performed to measure the heart rate (HR), pulse oximetry, electrocardiograph, and arterial blood pressure. Before anaesthesia induction, the left radial artery was cannulated with a 20-G cannula which was connected to a FloTrac sensor and a Vigileo monitor (software version 3.06) for continuous monitoring of CO, cardiac index (CI) , stroke volume (SV), stroke volume index (SVI), SVV, systemic vascular resistance (SVR) and systemic vascular resistance index (SVRI). After anaesthesia induction, a 7.5-F central venous catheter was introduced via right internal jugular vein for measuring the central venous pressure (CVP). All invasive cannulations were performed under local analgesia with 1% lidocaine.
Continuous CO was acquired with the FloTrac/Vigileo system by analyzing the arterial pulse wave following semi-invasive arterial catheterization without pulmonary artery catheterization or calibration with another method, which can monitor CO, CI, SV, SVI and SVV. With a CVP catheter, its signal may be interfaced with the Vigileo, allowing for the calculation of SVR and SVRI. When used with a central venous oximetry catheter, the Vigileo also provides continuous central venous oxygen saturation [15].
The system calculates the arterial pressure using the arterial pulsatility (stand deviation of pressure wave over a 20-s interval), resistance and compliance, according to the following general equation: SV=K×Pulsatility, where K is a constant quantifying arterial compliance and vascular resistance, and pulsatility is proportional to the standard deviation of the arterial wave over a 20-s interval. K is derived from patient characteristics (gender, age, height and weight) according to the method described by Langewouter et al [26], as well as the characteristics of waveform (e.g., skewness and kurtosis of individual waves). This calibration constant is recalculated every minute.
SVV represents the variation (as a percentage) of SV during the ventilation cycle and is assessed with following equation: SVV (%) = (maximum SV-minimum SV) / mean SV, where the maximum and minimum SV are mean values of the four extreme values of SV during a period of 30 s, and the mean SV is the average value for this time period.
Study protocol
Anaesthesia was induced using midazolam (2 mg iv.), etomidate (0.1-0.3 mg/kg iv.), fentanyl (3 μg/kg iv.), and atracurium (0.6-0.8 mg/kg iv.); that was maintained with propofol (1-3 μg/ml plasma target controlled infusion), remifentanyl (0.1-0.3 μg/kg/min, iv.), sevoflurane (1-3% inhalation), fentanyl and atracurium (0.3 mg/kg iv.). Following endotracheal intubation, all patients received mechanical ventilation with IPPV mode [Group C: tidal volume (Vt)=8 ml/kg, frequency (F) = 12/min, positive end expiratory pressure (PEEP) = 0, fractional inspired oxygen (FiO2) = 0.8, oxygen flow = 2.0 L/min; Group L: Vt =6 ml/kg, F=16/min, PEEP = 0, FiO2 = 0.8, oxygen flow = 2.0 l/min]. Mechanical ventilation was maintained with an endexpiratory Pco2 at 35-45 mmHg, peak airway pressure of < 15 cmH2O and pulse oximetry ranging from 98-100%. Bispectral index was monitored with the Aspect2000 Monitor (Aspect Company, America) and ranged from 45 to 55.
Baseline haemodynamic measurements were recorded 10 min after endotracheal intubation. On completion of baseline measurements and prior to any surgical intervention, volume replacement was performed with 6% hydroxyethyl starch solution (mean molecular weight, 130,000 d/mean degree of substitution, 0.4; Voluven; Fresenius Kabi; Beijing, China) at 7 ml/kg in 30 min. All haemodynamic measurements were re-detected immediately. Blood gas analysis was done during the study period, and red blood cells were transfused to keep hematocrit no less than 90 g/L if necessary.
Data Analysis
All haemodynamic variables were recorded as mean of three repeated measurements. Body surface area was calculated with the “du Bois formula” (body surface area=body weight [kilograms]0.425× body length [centimeters]0.725×71.84) [27]. Statistical analysis was performed using SPSS version 13.0 (SPSS; Chicago, IL). A student t test was used for comparison of haemodynamic data before and after fluid infusion. A Pearson`s correlation analysis was employed for evaluate the correlation between SVI and other haemodynamic variables. Prediction of fluid responsiveness with SVV and standard preload indexes was tested by calculating the area under the receiver operating characteristic (ROC) curve (AUC) for a SVI increase of ≥ 25% (AUC =0.5: no predictive value; AUC = 1.0: best predictive value). Furthermore, regression analysis was performed for preload variables and SVI related to the fluid infusion. A value of P<0.05 was considered statistically significant. Unless otherwise stated, data are presented as mean ± standard deviation (SD).
Results
None withdraw from the study. Biometric variables were comparable between two groups (Table 1). Volume replacement resulted in significant changes in all haemodynamic variables except HR: MAP, CVP, SVI and CI increased, whereas SVRI and SVV decreased. There were no significant differences in haemodynamic variables between two groups (Table 2).
In Group C, the mean increase in SVI as a result of volume loading was 34±19%, and 14 patients (75%) had a SVI increase of ≥25% (mean, 44±13%). In 5 patients (25%), a SVI increase of ≤25% was observed (mean, 18±2%). In Group L, the mean increase in SVI as a result of volume loading was 33±17%, and 24 patients (80%) had a SVI increase of ≥25% (mean, 38±14%). In 6 patients (20%), a SVI increase of ≤25% was observed (mean, 13±4%). Percentage change (∆) in CVP (Group C, r=0.608, P=0.001; Group L, r=0.578, P=0.004) and SVV (Group C, r=0.843, P=0.000; Group L, r=0.742, P=0.000) correlated significantly to ∆SVI, but ∆HR, ∆MAP and ∆SVR had no relationship with ∆SVI in both groups. SVV before fluid load correlated significantly to ∆SVI (Group C, r=0.909, P=0.000; Group L, r=0.758, P=0.000), but HR, MAP, CVP and SVR before fluid load were not related to the ∆SVI in both groups (Table 3). Results of ROC curve analysis are summarized in Table 4, Figure 1 and Figure 2.
The largest AUC was found for SVV (Group C, 0.852; Group L, 0.814) as compared to the HR, MAP, CVP and SVR. The optimal threshold value for SVV calculated by the ROC analysis was 9.5%: in patients with SVV of 12.5% at baseline, a SVI increase of ≥25% as a response to subsequent fluid replacement could be expected with a sensitivity of 100% and a specificity of 57.1% in Group C. In group L, the sensitivity and specificity was 91.3% and 71.4%, respectively.
Table 1
Biometric variables of patients in both groups at baseline.
| Variable | Group C (n=20) | Group L (n=30) | P |
|---|---|---|---|
| Age (yr) | 61±14 | 62±12 | 0.487 |
| Male/female | 15/5 | 21/9 | |
| Height (cm) | 165±7 | 164±9 | 0.695 |
| Weight (kg) | 62±13 | 63±11 | 0.994 |
| Body surface (m2) | 1.72±0.20 | 1.72±0.20 | 0.993 |
P<0.05 between two groups.
Table 2
Haemodynamic variables in two groups.
| Variable | Group | Before fluid load | After fluid load | P |
|---|---|---|---|---|
| MAP (mm Hg) | Group C | 69.7±10.2 | 87.1±12.2 | P<0.001 |
| Group L | 69.6±6.2 | 84.0±10.3 | P<0.001 | |
| HR (beat/min) | Group C | 60.0±6.0 | 61.5±5.3 | P=0.391 |
| Group L | 61.0±6.1 | 61.4±5.2 | P=0.682 | |
| CVP (mm Hg) | Group C | 3.2±0.9 | 5.4±1.3 | P<0.001 |
| Group L | 3.3±1.1 | 5.5±1.4 | P<0.001 | |
| SVI (ml/m2) | Group C | 37.2±3.8 | 49.8±7.0 | P<0.001 |
| Group L | 34.3±4.3 | 46.3±6.1 | P<0.001 | |
| CI (L/min/m2) | Group C | 2.4±0.3 | 3.0±0.3 | P<0.001 |
| Group L | 2.3±0.3 | 2.9±0.3 | P<0.001 | |
| SVRI (dyn s/cm5/m2) | Group C | 2476±485 | 2218.2±258 | P=0.043 |
| Group L | 2394±433 | 2123±333 | P=0.009 | |
| SVV (%) | Group C | 12.3±3.0 | 6.3±1.5 | P<0.001 |
| Group L | 11.7±2.8 | 6.0±1.3 | P<0.001 |
P value: before fluid load vs after fluid load. MAP=mean arterial pressure; HR=heart rate; CVP=central venous pressure; SVI=stroke volume index; CI=cardiac index; SVRI=systemic vascular resistance index; SVV=stroke volume variation.
Table 3
Pearson correlation analysis of haemodynamic variables before fluid load, changes in baseline haemodynamic variables and changes in SVI.
| Variable | Group | MAP | HR | CVP | SVR | SVV | ∆MAP | ∆HR | ∆CVP | ∆SVR | ∆SVV |
|---|---|---|---|---|---|---|---|---|---|---|---|
| r | Group C | -0.175 | -0.213 | -0.071 | -0.061 | 0.909 | 0.391 | -0.109 | 0.608 | 0.276 | 0.843 |
| P | 0.461 | 0.367 | 0.765 | 0.800 | 0.000 | 0.088 | 0.646 | 0.001 | 0.238 | 0.000 | |
| r | Group L | -0.091 | -0.091 | -0.049 | -0.145 | 0.758 | 0.297 | 0.067 | 0.578 | 0.112 | 0.742 |
| P | 0.631 | 0.631 | 0.798 | 0.445 | 0.000 | 0.111 | 0.725 | 0.004 | 0.557 | 0.000 |
∆= percentage changes following fluid replacement therapy.
Table 4
ROC for predicting ∆SVI of ≥25%.
| Variable | Group L | Group C | ||||
|---|---|---|---|---|---|---|
| AUC | 95%CI | SE | AUC | 95%CI | SE | |
| HR | 0.441 | 0.122~0.760 | 0.163 | 0.440 | 0.155~0.724 | 0.145 |
| MAP | 0.407 | 0.129~0.685 | 0.142 | 0.324 | 0.087~0.561 | 0.121 |
| CVP | 0.404 | 0.135~0.672 | 0.137 | 0.429 | 0.173~0.684 | 0.130 |
| SVR | 0.460 | 0.189~0.731 | 0.084 | 0.324 | 0.085~0.563 | 0.122 |
| SVV | 0.814 | 0.590~1.038 | 0.114 | 0.852 | 0.603~1.101 | 0.127 |
Figure 1
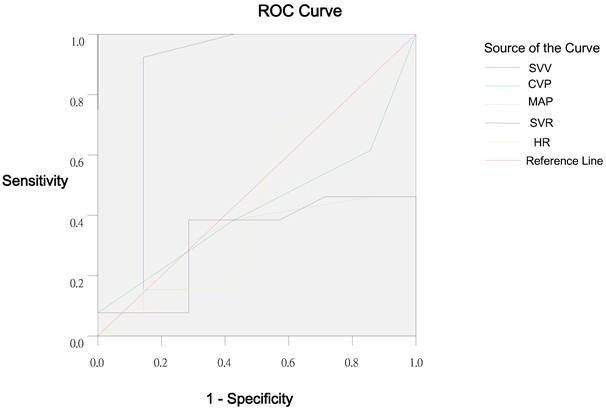
Receiver operating characteristic curve of SVV, CVP, MAP, SVR and HR in Group C.
Figure 2
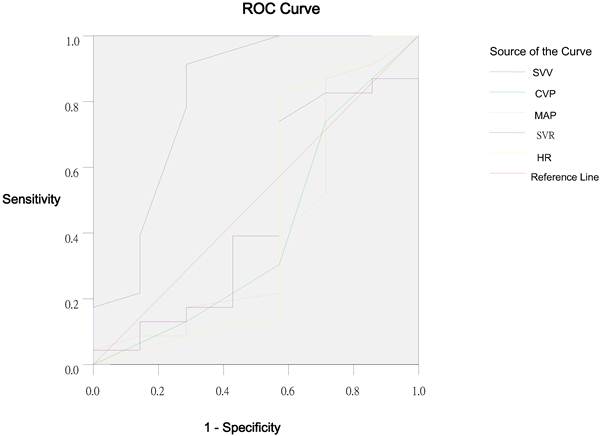
Receiver operating characteristic curve of SVV, CVP, MAP, SVR and HR in Group L.
Discussion
SVV measured by FloTrac/Vigileo system was comparable predictor of changes in SVI following volume replacement therapy in patients receiving gastrointestinal surgery in the presence of ventilation with conventional tidal volume and was a predictor of fluid response in these patients undergoing ventilation with low tidal volume. The conventional static preload variables assessed in this study, such as CVP, failed to predict the fluid responsiveness.
To maintain the best volume state is one of important factors to keep favorable organ perfusion and provide optimal oxygen supply, the precondition of which is to evaluate and predict the volume state accurately. Transoesophageal echocardiography has been used to evaluate the cardiac function and volume state [28], but it is expensive, complicate and difficult to operate and unable to continuously monitor. Variables, such as blood pressure and urine volume, are insensitive because of the influence of vasoactive agents and diuretics. CVP and PAWP can only evaluate volume state indirectly. These variables are often influenced by the general anesthesia agents and vasoactive agents. Thus, it is imperative to develop a variable which can evaluate the volume state of patients easily and accurately.
At present, SVV can be monitored with the PiCCO system and FloTrac/Vigileo system. PiCCO system, which requires transpulmonary thermodilution [29], is invasive and requires the venous access and balloon flotation of the catheter through the right side. Accordingly, there are complications associated with detection with this system, and some are even fatal [30-32]. Furthermore, this system requires an elaborate protocol for intermittent injections into the pulmonary artery catheter for thermodilution. FloTrac/Vigileo system based on analysis of the systemic arterial wave is a semi-invasive method, and does not require pulmonary artery catherization or calibration with another method.
SVV used for haemodynamic monitoring to guide the fluid supplement in patients receiving mechanical ventilation is based on the heart-lung interactions during the mechanical ventilation [33-36]. Respiratory-induced changes in the left ventricular preload result in cyclic changes in the left ventricular SV and arterial pressure. In the presence of hypovolaemia, the left ventricle usually operates on the ascending part of the Frank-Starling curve. Thus, changes in the SV should be more pronounced when compared with that at normovolemia. SVV and the surrogate variables systolic pressure variation (SPV) and pulse pressure variation (PPV) have been studied previously in patients receiving brain surgery, critically ill patients after cardiac surgery and those suffering from septic shock [5-8]. SVV, SPV and PPV are highly sensitive in predicting the fluid responsiveness under these conditions. Thus, dynamic preload variables were considered to be important in guiding the fluid and catecholamine therapy in critically ill patients.
However, SVV depends not only on the cardiac filling status but the changes in intrathoracic pressure associated with the tidal volume [37, 38]. It has been demonstrated that accurate prediction of fluid responsiveness by SVV is feasible when tidal volume is 10-15 ml/kg [5-7]. In contrast, Wiesenack and colleagues did not find the predictive value of SVV in patients receiving cardiac surgery in the presence of ventilation with tidal volume of 10 ml/kg in a study on the volume challenge with colloid solutions [39]. However, the interpretation of these results is difficult as variables reflecting baseline cardiac preload, such as ITBI and LVEDAI, and the degree of hypovolaemia, were not given [39]. In addition, there was relatively wide variation in baseline SVV, suggesting a heterogeneous patient population. However, it remained unclear whether SVV was a reliable predictor of fluid responsiveness during mechanical ventilation with low tidal volume.
In the present study, the role of SVV measured by FloTrac/Vigileo system in prediction of fluid responsiveness was first evaluated in patients receiving gastrointestinal surgery in the presence of ventilation with IPPV and conventional tidal volumes (8 ml/kg). Results suggest that the changes in SVI were significantly correlated with the changes in SVV and CVP, while the changes in SVI were not related to the changes in HR, MAP and SVR. Changes in SVI were significantly correlated to the SVV before volume replacement, while no correlation was found between the changes in SVI, HR, MAP, CVP, and SVR before volume replacement. Both CVP and SVV can evaluate the volume state, but only SVV can predict the fluid responsiveness under this condition. AUC can reflect the diagnostic value of variables [40]. The analysis of ROC curve suggested that SVV was a better variable in the evaluation of volume state than the HR, MAP, CVP, and SVR. SVV of 9.5% or higher could predict a SVI increase of ≥25% as a response to volume replacement with a sensitivity of 100% and a specificity of 57.1%, which is in accordance with the results from the PiCCO system [9-11,41].
Mechanical ventilation is a basic way for oxygen supply under the general anesthesia, but it may cause ventilation induced lung injury (VILI). Ventilation with low tidal volume is one of important methods to avoid or reduce VILI [42]. The normal tidal volume of mammalians is 6.3 ml/kg [43]. Thus, in the present study, tidal volume was set at 6 ml/kg in the IPPV mode, and whether SVV can predict the fluid responsiveness was evaluated under this condition in patients receiving gastrointestinal surgery, which is more clinically important than the conventional tidal volume. Results showed that the changes in SVI were significantly correlated to the changes in SVV and CVP when the ventilation was performed with low tidal volume, whereas the changes in SVI were not related to the changes in HR, MAP and SVR. Changes in SVI were significantly correlated to SVV before volume replacement, while no relationship was found between the changes in SVI and HR, MAP, CVP and SVR before volume replacement under this condition. There was no statistical difference compared with Group C. The ROC suggested that SVV was a better variable for the evaluation of volume state than HR, MAP, CVP and SVR. SVV of 9.5% or higher could predict a SVI increase of ≥25% as a response to volume replacement with a sensitivity of 91.3% and a specificity of 71.4%. These findings were similar to those in the study of Rex and colleagues in which PiCCO system was also used for monitoring [11].
The normal range of SVV under controlled ventilation is less than 10-13%. With respect to the use of SVV assessed by FloTrac/Vigileo system to guide the fluid therapy, the following factors and limitations have to be emphasized: 1) Mechanical ventilation: only patients mechanically ventilated in fixed respiratory frequency and tidal volume of ≥6 ml/kg can use SVV. It is infeasible for patients with spontaneous breath or irregular tidal volume. 2) PEEP: SVV will increase with the increase in PEEP. 3) Airway pressure and intrathoracic pressure. 4) Arrhythmias: the occurrence of arrhythmias or alterations of myocardial contractility (including that after pharmacologic treatment) may render these SVV estimates unreliable. 5) Vasoactive agents: Vasoactive agents, especially β-receptor blockers, vasoconstrictors and vasodilators, influence SVV significantly. 6) General anesthetics: General anesthetics, such as sevoflurane, propofol, fentanyl, and etomidate, can influence SVV via the circulatory inhibition. 7) The interference with arterial waveform, surgical operation, artery catheter and other during the surgery may influence the accuracy of SVV. Thus, in fully sedated patients with mechanical ventilation, sinus rhythm, or pacing in a fixed mode and unchanged catecholamine management are prerequisites for proper use of this haemodynamic monitoring tool.
Some limitations of this study have to be addressed. First, the assessment of SVV with FloTrac/Vigileo system has not yet been proven by direct comparison with other techniques. However, our findings are strongly supported by some studies in which SVV was assessed with PiCCO system and found to be a favorable predictor of fluid responsiveness [9-11, 41]. Second, our patients were hypovolemic at baseline because of pre-operative fasting, gastrointestinal preparations and application of general anesthetics. The predictive value of SVV was not evaluated in normovolemic or even hypervolemic patients with SVV within or below the normal range. However, it seems likely that the present setting is close to most common clinical situations, with hypovolemia as the major cause of arterial hypotension. Moreover, during measurements and fluid trial, manipulations were not allowed, ie, table-tilting maneuvers, catheter insertion, or surgical interventions were strictly avoided. These conditions rarely apply to clinical situations, when the decision on fluid replacement therapy has to be made.
In conclusion, SVV assessed with the FloTrac/Vigileo system shows comparably good performance in predicting fluid responsiveness in patients receiving gastrointestinal surgery in the presence of ventilation with conventional tidal volume. Moreover SVV was proved to be a reliable variable for the prediction of fluid responsiveness in patients receiving gastrointestinal surgery in the presence of ventilation with low tidal volume.
Competing Interests
The authors have declared that no competing interest exists.
References
1. Bendjelid K, Romand JA. Fluid responsiveness in mechanically ventilated patients: a review of indices used in intensive care. Intensive Care Med. 2003;29:352-60
2. Michard F, Teboul JL. Predicting fluid responsiveness in ICU patients: a critical analysis of the evidence. Chest. 2002;121:2000-8
3. Reuse C, Vincent JL, Pinsky MR. Measurements of right ventricular volumes during fluid challenge. Chest. 1990;98:1450-4
4. Feissel M, Michard F, Mangin I, Ruyer O, Faller JP, Teboul JL. Respiratory changes in aortic blood velocity as an indicator of fluid responsiveness in ventilated patients with septic shock. Chest. 2001;119:867-73
5. Berkenstadt H, Margalit N, Hadani M, Friedman Z, Segal E, Villa Y, Perel A. Stroke volume variation as a predictor of fluid responsiveness in patients undergoing brain surgery. Anesth Analg. 2001;92:984-9
6. Reuter DA, Felbinger TW, Schmidt C, Kilger E, Goedje O, Lamm P, Goetz AE. Stroke volume variations for assessment of cardiac responsiveness to volume loading in mechanically ventilated patients after cardiac surgery. Intensive Care Med. 2002;28:392-8
7. Reuter DA, Kirchner A, Felbinger TW, Weis FC, Kilger E, Lamm P, Goetz AE. Usefulness of left ventricular stroke volume variation to assess fluid responsiveness in patients with reduced cardiac function. Crit Care Med. 2003;31:1399-404
8. Marx G, Cope T, McCrossan L, Swaraj S, Cowan C, Mostafa SM, Wenstone R, Leuwer M. Assessing fluid responsiveness by stroke volume variation in mechanically ventilated patients with severe sepsis. Eur J Anaesthesiol. 2004;21:132-8
9. Liu SQ, Qiu HB, Yang Y, Li JQ, Shen JF. Assessment of stroke volume variation and intrathoracic blood volume index on the responsiveness to volume loading in mechanically ventilated canine with hemorrhagic shock. Zhonghua Wai Ke Za Zhi. 2006;44:1216-9
10. Hofer CK, Müller SM, Furrer L, Klaghofer R, Genoni M, Zollinger A. Stroke volume and pulse pressure variation for prediction of fluid responsiveness in patients undergoing off-pump coronary artery bypass grafting. Chest. 2005;128:848-54
11. Rex S, Brose S, Metzelder S, Hüneke R, Schälte G, Autschbach R, Rossaint R, Buhre W. Prediction of fluid responsiveness in patients during cardiac surgery. Br J Anaesth. 2004;93:782-8
12. Sander M, Spies CD, Grubitzsch H, Foer A, Müller M, von Heymann C. Comparison of uncalibrated arterial waveform analysis in cardiac surgery patients with thermodilution cardiac output measurements. Crit Care. 2006;10:Rl64
13. Penttila J, Snapir A, Kentala E, Koskenvuo J, Posti J, Scheinin M, Scheinin H, Kuusela T. Estimation of cardiac output in a pharmacological trial using a simple method based on arterial blood pressure signal waveform: a comparison with pulmonary thermodilution and echocardiographic methods. Eur J Clin Pharmacol. 2006;62:401-7
14. Opdam HI, Wan L, Bellomo R. A pilot assessment of the FloTrac cardiac output monitoring system. Intensive Care Med. 2007;33:344-9
15. Manecke GR. Edwards FloTrac sensor and Vigileo monitor: easy, accurate, reliable cardiac output assessment using the arterial pulse wave. Expert Rev Med Devices. 2005;2:523-7
16. Button D, Weibel L, Reuthebuch O, Genoni M, Zollinger A, Hofer CK. Clinical evaluation of the FloTrac/Vigileo system and two established continuous cardiac output monitoring devices in patients undergoing cardiac surgery. Br J Anaesth. 2007;99:329-36
17. Cannesson M, Attof Y, Rosamel P, Joseph P, Bastien O, Lehot JJ. Comparison of FloTrac cardiac output monitoring system in patients undergoing coronary artery bypass grafting with pulmonary artery cardiac output measurements. Eur J Anaesthesiol. 2007;24:832-9
18. Su BC, Tsai YF, Cheng CW, Yu HP, Yang MW, Lee WC, Lin CC. Stroke volume variation derived by arterial pulse contour analysis is a good indicator for preload estimation during liver transplantation. Transplant Proc. 2012;44:429-32
19. Khwannimit B, Bhurayanontachai R. Prediction of fluid responsiveness in septic shock patients: comparing stroke volume variation by FloTrac/Vigileo and automated pulse pressure variation. Eur J Anaesthesiol. 2012;29:64-9
20. Zhang Z, Lu B, Sheng X, Jin N. Accuracy of stroke volume variation in predicting fluid responsiveness: a systematic review and meta-analysis. J Anesth. 2011;25:904-16
21. Kungys G, Rose DD, Fleming NW. Stroke volume variation during acute normovolemic hemodilution. Anesth Analg. 2009;109:1823-30
22. Lahner D, Kabon B, Marschalek C, Chiari A, Pestel G, Kaider A, Fleischmann E, Hetz H. Evaluation of stroke volume variation obtained by arterial pulse contour analysis to predict fluid responsiveness intraoperatively. Br J Anaesth. 2009;103:346-51
23. Derichard A, Robin E, Tavernier B, Costecalde M, Fleyfel M, Onimus J, Lebuffe G, Chambon JP, Vallet B. Automated pulse pressure and stroke volume variations from radial artery: evaluation during major abdominal surgery. Br J Anaesth. 2009;103:678-84
24. de Waal EE, Rex S, Kruitwagen CL, Kalkman CJ, Buhre WF. Stroke volume variation obtained with FloTrac/Vigileo fails to predict fluid responsiveness in coronary artery bypass graft patients. Br J Anaesth. 2008;100:725-6
25. Hofer CK, Senn A, Weibel L, Zollinger A. Assessment of stroke volume variation for prediction of fluid responsiveness using the modified FloTrac and PiCCOplus system. Crit Care. 2008;12:R82
26. Langewouters GJ, Wesseling KH, Goedhard WJ. The pressure dependent dynamic elasticity of 35 thoracic and 16 abdominal human aortas in vitro described by a five component model. J Biomech. 1985;18:613-20
27. Du Bois D, Du Bois EF. A formula to estimate the approximate surface area if height and weight be known.1916. Nutrition. 1989;5:303-11
28. Tousignant CP, Walsh F, Mazer CD. The use of transesophageal echocardiography for preload assessment in critically ill patients. Anesth Analg. 2000;90:351-5
29. Della Rocca G, Costa MG, Pompei L, Coccia C, Pietropaoli P.Continuous, intermittent cardiac output measurement. pulmonary artery catheter versus aortic transpulmonary technique. Br J Anaeth. 2002;88:350-6
30. Bossect T, Schnitt DV, Mohr FW. Pulmonary artery rupture-fatal complication of catheter examination (thermodilution catheter). Z. Kardiol. 2000;89:54
31. Abreu AR, Campos MA, Krieger BP. Pulmonary artery rupture induced by a pulmonary artery catheter: a case report and review of the literature. J Intensive Care Med. 2004;19:291-6
32. Huang L, Elsharydah A, Nawabi A, Cork RC. Entrapment of pulmonary artery catheter in a suture at the inferior vena cava cannulation site. J Clin Anesth. 2004;16:557-9
33. Morgan BC, Martin WE, Hornbein TF, Crawford EW, Guntheroth WG. Hemodynamic effects of intermittent positive pressure respiration. Anesthesiology. 1966;27:584-90
34. Brower R, Wise RA, Hassapoyannes C, Bromberger-Barnea B, Permutt S. Effect of lung inflation on lung blood volume and pulmonary venous flow. J Appl Physiol. 1985;58:954-63
35. Taylor RR, Covell JW, Sonnenblick EH, Ross J Jr. Dependence of ventricular distensibility on filling of the opposite ventricle. Am J Physiol. 1967;213:711-8
36. Buda AJ, Pinsky MR, Ingels NB Jr, Daughters GT 2nd, Stinson EB, Alderman EL. Effect of intrathoracic pressure on left ventricular performance. N Engl J Med. 1979;301:453-9
37. Reuter DA, Bayerlein J, Goepfert MS, Weis FC, Kilger E, Lamm P, Goetz AE. Influence of tidal volume on left ventricular stroke volume variation measured by pulse contour analysis in mechanically ventilated patients. Intensive Care Med. 2003;29:476-80
38. Michard F, Teboul JL, Richard C. Influence of tidal volume on stroke volume variation. Does it really matter? Intensive Care Med. 2003;29:1613
39. Wiesenack C, Prasser C, Rödig G, Keyl C. Stroke volume variation as an indicator of fluid responsiveness using pulse contour analysis in mechanically ventilated patients. Anesth Analg. 2003;96:1254-7
40. Hanley JA, McNeil BJ. The meaning of use of the area under a receiver operating characteristic (ROC) curve. Radiology. 1982;143:29-36
41. Reuter DA, Goepfert MS, Goresch T, Schmoeckel M, Kilger E, Goetz AE. Assessing fluid responsiveness during open chest conditions. Br J Anaesth. 2005;94:318-23
42. Koner O, Celebi S, Balci H, Cetin G, Karaoglu K, Cakar N. Effects of protective and conventional mechanical ventilation on pulmonary function and systemic cytokine release after cardiopulmonary bypass. Intensive Care Med. 2004;30:620-6
43. Tenney SM, Remmers JE. Comparative quantitative morphology of the mammalian lung: diffusing area. Nature. 1963;197:54-6
Author contact
![]() Corresponding author: Quan Li, Ph.D., M.D., 301 Yanchang Middle Rd, Shanghai 200072, China. Tel.: 86-21-66307531; Fax: 86-21-66301082; E-mail: li091009com; 1132530edu.cn.
Corresponding author: Quan Li, Ph.D., M.D., 301 Yanchang Middle Rd, Shanghai 200072, China. Tel.: 86-21-66307531; Fax: 86-21-66301082; E-mail: li091009com; 1132530edu.cn.
Citation styles
APA
Li, C., Lin, F.q., Fu, S.k., Chen, G.q., Yang, X.h., Zhu, C.y., Zhang, L.j., Li, Q. (2013). Stroke Volume Variation for Prediction of Fluid Responsiveness in Patients Undergoing Gastrointestinal Surgery. International Journal of Medical Sciences, 10(2), 148-155. https://doi.org/10.7150/ijms.5293.
ACS
Li, C.; Lin, F.q.; Fu, S.k.; Chen, G.q.; Yang, X.h.; Zhu, C.y.; Zhang, L.j.; Li, Q. Stroke Volume Variation for Prediction of Fluid Responsiveness in Patients Undergoing Gastrointestinal Surgery. Int. J. Med. Sci. 2013, 10 (2), 148-155. DOI: 10.7150/ijms.5293.
NLM
Li C, Lin Fq, Fu Sk, Chen Gq, Yang Xh, Zhu Cy, Zhang Lj, Li Q. Stroke Volume Variation for Prediction of Fluid Responsiveness in Patients Undergoing Gastrointestinal Surgery. Int J Med Sci 2013; 10(2):148-155. doi:10.7150/ijms.5293. https://www.medsci.org/v10p0148.htm
CSE
Li C, Lin Fq, Fu Sk, Chen Gq, Yang Xh, Zhu Cy, Zhang Lj, Li Q. 2013. Stroke Volume Variation for Prediction of Fluid Responsiveness in Patients Undergoing Gastrointestinal Surgery. Int J Med Sci. 10(2):148-155.
This is an open access article distributed under the terms of the Creative Commons Attribution (CC BY-NC) License. See http://ivyspring.com/terms for full terms and conditions.