Impact Factor ISSN: 1449-1907

 Global reach, higher impact
Int J Med Sci 2012; 9(1):115-120. doi:10.7150/ijms.9.115 This issue Cite
Research Paper
Relationship of Visual Cortex Function and Visual Acuity in Anisometropic Amblyopic Children
Chuanming Li1, Lin Cheng1, Qiongwu Yu2, Bing Xie1, Jian Wang1 ![]()
1. Department of Radiology, Southwest Hospital, Third Military Medical University, Chongqing 400038, China.
2. Department of Ophthalmology, Southwest Hospital, Third Military Medical University, Chongqing 400038, China.
Received 2011-8-14; Accepted 2011-11-7; Published 2011-12-17
Abstract
Purpose: To detect the functional deficit of the visual cortex in anisometropic amblyopia children using functional magnetic resonance imaging (fMRI) technique, and investigate the relationship between visual acuity and visual cortex function.
Methods: Blood oxygenation level-dependent fMRI (BOLD-fMRI) was performed in ten monocular anisometropic amblyopia children and ten normal controls. fMRI images were acquired in two runs with visual stimulation delivered separately through the sound and amblyopic eyes. Measurements were performed in cortical activation of striate and extrastriate areas at the occipital lobe. The relationship between cortex function and visual acuity was analyzed by Pearson partial analysis.
Results: The activation areas of both the striate and extrastriate cortices in the amblyopic eyes were significantly lower than that of the sound fellow eyes. No relationship was found between the striate and extrastriate cortex activation. No relationship was found between the visual cortical activation of striate, extrastriate areas and visual acuity of anisometropic amblyopes.
Conclusions: BOLD-fMRI revealed the independent striate and extrastriate cortical deficits in anisometropic amblyopes. In addition, the visual acuity lesion and the striate and extrastriate cortical deficits were not parallel, and results of fMRI examination have much potential value in the evaluation of amblyopia.
Keywords: Anisometropic amblyopia, Cortical activation, Visual acuity, BOLD- fMRI.
Introduction
Amblyopia is characterized by poor or indistinct vision in an eye. It is one of the most common disorders of the visual system in childhood, affects 1-5% of the population, and is generally associated with a history of strabismus, anisometropia, or form-deprivation in early life [1]. Amblyopia is a developmental problem in the brain, not an organic problem in the eye. The part of the brain corresponding to the visual system from the affected eye is not stimulated properly, and develops abnormally.
Blood oxygenation level-dependent (BOLD) functional magnetic resonance imaging (fMRI) is a widely used brain mapping technique, which can be used to evaluate the neural activity in the brain by measuring the blood flow to the local vasculature. More recently, fMRI has enabled the noninvasive investigation of brain cortical function in human amblyopia. It has been found that amblyopia is associated with lesions in the striate cortex (Brodmann areas 17) and lateral geniculate nucleus (LGN) [2-4].
Generally, ophthalmologists make a diagnosis of amblyopia and then determine the degree of them primarily based on the best corrected visual acuity (BCVA). However the diagnosis of amblyopia may not consider the possibility of an organic lesion causing decreased visual acuity, and this must always be excluded before the diagnosis of amblyopia is made. In the present study, we investigated how closely the results of BOLD-fMRI examination accorded with those for visual acuity in anisometropic amblyopia, and determined the relationship between signs revealed by BOLD-fMRI and results of visual acuity examination.
Subjects and methods
Subjects
Ten subjects aged 5-11 years with anisometropic amblyopia were recruited from the Eye Clinic at Southwest Hospital, Third Military Medical University, Chongqing, China. The clinical data on the patients are summarized in Table 1. A control group of ten subjects aged 5-12 years with no known visual defects was recruited from the Gaotanyan Primary School in Chongqing, China. The normal control subjects had 20/20 acuity or better in both eyes when corrected. No other optical ailments or severe systemic diseases were found in any of the subjects. The study was approved by the Medical Research Ethics Committee of the hospital. Written informed consent was obtained from all participants.
Summary of clinical data on the amblyopes.
| Patient NO. | Amblyopic eye | Gender | Age (yrs) | BCVA | Diopter difference | |
|---|---|---|---|---|---|---|
| OD | OS | |||||
| 1 | OS | M | 9 | 20/20 | 1/20 | 3.5 |
| 2 | OS | F | 8 | 20/20 | 8/20 | 4.0 |
| 3 | OD | M | 8 | 3/20 | 20/20 | 5.5 |
| 4 | OD | F | 7 | 5/20 | 30/20 | 5.0 |
| 5 | OS | F | 11 | 20/20 | 3/20 | 3.0 |
| 6 | OS | F | 6 | 24/20 | 3/20 | 5.0 |
| 7 | OS | M | 5 | 22/20 | 6/20 | 4.5 |
| 8 | OD | M | 6 | 4/20 | 24/20 | 4.0 |
| 9 | OS | M | 7 | 22/20 | 3/20 | 3.75 |
| 10 | OD | F | 9 | 4/20 | 22/20 | 4.25 |
OD: right eye; OS: left eye; M: male; F: female; BCVA: best corrected visual acuity; ID: interocular difference.
Stimuli
In the present study, a reversible black and white checkerboard was designed and displayed by E-prime software. Each check subtended a visual angle of 0.5° (one cycle/degree). The frequency of the checkerboard reversal was 8 Hz. The contrast and luminance values of each condition were measured using a Minolta CS-100 Chroma Meter (Osaka, Japan). With this block design paradigm, the alternating checkerboard stimulus was back-projected via an NEC MultiSync MT820 LCD video projector onto a translucent screen on the scanner bed. The checkerboard contrast was identical for every eye of the patients and normal controls with the value of 30%. The control task, representing the 'resting-state' measurements, consisted of a solid white cross-centered on a black background. An angled mirror, positioned above the subjects' eyes, provided a full view of the screen. Subjects wore liquid crystal display shutter glasses (Translucent Technologies) and viewed the screen monocularly before the start of each fMRI acquisition run. An experimental session typically consisted of 3 acquisition runs per eye.
fMRI imaging acquisition
Imaging was performed on a Siemens Sonuta 1.5 Tesla MRI scanner. The subject's head was immobilized using a vacuum pillow and a helmet which was positioned onto the same platform. The BCVA of each subject was acquired using lenses during the experiments. Twenty axial images were taken parallel to the anterior commissure and commissural posterior line, which was identified with the aid of a sagittal localizer anatomical image. Two separate fMRI scans were performed on the sound eye and on the amblyopic eye. Each scan contained 4 resting-state blocks, interleaved with 3 stimulation-state blocks. Functional image data were acquired with an echo-planar imaging sequence [64×64 matrix, 220×220 cm field of view, echo time (TE) 40 ms, volume repetition time (TR) 3000 s, flip angle 90°]. The duration of the resting- and stimulation-state presentations within each block was 30 s. This time was suitable for the BOLD signal to return to baseline post-stimulation. The acquisition runs and sequence of the amblyopia and fellow sound eyes were randomized and counterbalanced between all subjects. At the end of the experiment, for anatomical detail, a high-resolution (1×1 mm2) image was acquired using a three-dimensional, T1-weighted MPRAGE imaging sequence (256×256 matrix, inversion time 50.5 s, TE 56.3 ms, TR 511.7ms, flip angle 11°).
Data analyses
The analyses were performed for each subject and each eye separately. All data were analyzed offline by AFNI software [5]. The first three scans of each functional run were discarded due to start-up magnetization transients in the data. In order to exclude voxels lying outside the head, only those functional voxels above a certain mean intensity level were included in the functional analysis procedure. During the data processing, motion correction and three-dimensional smoothing were used for all the data. Activation maps were calculated by comparing images acquired during the stimulation and resting states, using an unpaired Student's t-test with a threshold of 2.4 (P < 0.01) [6]. With the aid of anatomical reference images [7], regions of interest (ROI) were selected for analysis, which included the striate and extrastriate cortices, the borders and domains of which were defined automatically by the AFNI software. There is no standard anatomical template for children in literature. In order to compensate for variations of global signal caused by sessions, ages and individual difference, the imaging data are fitted to the standard Talairach template. After normalization of functional images to Talairach coordinates, the volume of significantly activated voxels within the ROI was used to compare the neuronal activity induced by visual stimulation through the sound eyes and the amblyopic eyes.
In our study, the visual acuity of the sound eyes in amblyopic children was unaffected, so we assumed that the cortex activation of sound eyes was normal. We adopted the interocular difference (ID) as an index of the difference between amblyopic and sound eyes: ID = SE - AE / SE, where SE and AE are the sound eye's and amblyopic eye's sight (activation area), respectively. The correlation between the ID of striate and extrastriate cortex (ESC) activation and the visual acuity deficits was analyzed using Pearson partial analysis.
All data were expressed as mean ± standard error. Statistical significance was determined using paired Student's t-test (two-tailed) for comparing two data sets. A probability (P) value of P < 0.05 was considered statistically significant.
Results
For the control group, there was no statistically significant difference between the striate and extrastriate cortical activation of the two eyes (t = -0.704, -0.896; P = 0.499, 0.394; Table 2, Fig. 2).
The activation area of the visual cortex by both eyes of the normal control group (pan-voxel).
| No: | 1 | 2 | 3 | 4 | 5 | 6 | 7 | 8 | 9 | 10 |
|---|---|---|---|---|---|---|---|---|---|---|
| Left eyes Striate cortex | 0.43 | 0.47 | 0.51 | 0.48 | 0.46 | 0.53 | 0.46 | 0.44 | 0.52 | 0.48 |
| Extrastriate cortex | 3.42 | 3.69 | 3.29 | 3.42 | 3.66 | 3.34 | 3.35 | 3.47 | 3.69 | 3.67 |
| Right eyes Striate cortex | 0.47 | 0.46 | 0.53 | 0.52 | 0.54 | 0.49 | 0.47 | 0.45 | 0.46 | 0.48 |
| Extrastriate cortex | 3.33 | 3.46 | 3.60 | 3.36 | 3.65 | 3.30 | 3.49 | 3.68 | 3.75 | 3.84 |
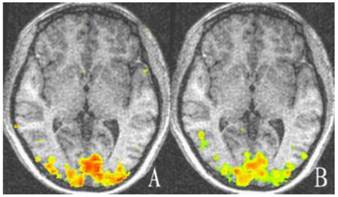
Representative cortex activation relative to baseline of both eyes of the control group. There is no significant difference in activation between the two eyes (P > 0.05). A: Cortex activation of left eye; B: Cortex activation of right eye. Areas with high and low activation are indicated by red and green colors.
For amblyopic eyes, the activation area of the striate cortex (0.45 ± 0.035) was significantly lower than that of the sound eyes (0.49 ± 0.030, P < 0.05). The activation area of the extrastriate cortex (3.55 ± 0.234) was also significantly lower than that of the fellow eyes (3.77 ± 0.257, P < 0.05; Fig. 1, 3). The cortex activation data are summarized in Table 3. The ID of extrastriate cortex activation had no correlation with that of the striate cortex (R2 = 0.45, P = 0.557), which suggested the striate and ESC deficits are independent and the latter do not arise as a down-stream consequence of the primary visual cortex lesion.
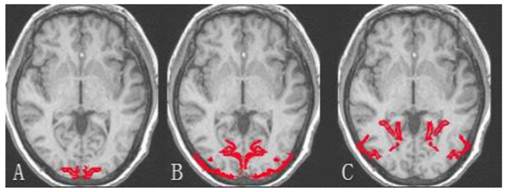
The demarcation of brain occipital lobe. A: Striate cortex; B and C: Extrastriate cortex.
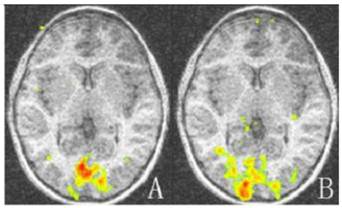
The activation map of the amblyopic and sound eyes relative to baseline for amblyopic children. The activation areas of the amblyopic eyes are much less than that of the sound eyes in striate and extrastriate cortex (P < 0.05). A: Activation map of amblyopic eyes; B: Activation of the sound eyes. Areas with high and low activation are indicated by red and green colors.
The activation area of the visual cortex by amblyopic eyes and sound eyes of the amblyopia group (pan-voxel).
| No: | 1 | 2 | 3 | 4 | 5 | 6 | 7 | 8 | 9 | 10 |
|---|---|---|---|---|---|---|---|---|---|---|
| Amblyopic eyes | ||||||||||
| Striate cortex* | 0.40 | 0.47 | 0.48 | 0.45 | 0.51 | 0.48 | 0.42 | 0.41 | 0.44 | 0.43 |
| Extrastriate cortex # | 3.11 | 3.34 | 3.38 | 3.76 | 3.74 | 3.70 | 3.61 | 3.67 | 3.36 | 3.81 |
| Sound eyes | ||||||||||
| Striate cortex | 0.48 | 0.52 | 0.52 | 0.53 | 0.55 | 0.48 | 0.47 | 0.46 | 0.48 | 0.48 |
| Extrastriate cortex | 3.67 | 4.19 | 3.51 | 3.86 | 4.14 | 3.59 | 3.61 | 3.77 | 3.43 | 3.91 |
*P < 0.05 vs. sound eyes; #P < 0.05 vs. sound eyes.
For amblyopic eyes, there was no correlation between the IDvisual acuity and either the ID striate cortex (R2 = 0.003, P = 0.89) or the IDextrastriate cortex (R2 = 0.002, P = 0.899). The visual acuity lesion and functional deficits of the striate and extrastriate cortices were not parallel.
Discussion
Vision is a developmental sensory function and is relatively poor at birth. Through proper visual stimulation in the early months and years of life, a normal acuity can be achieved at approximately three years of age. If for reasons such as strabismus, abnormal refractive error, congenital cataract or some other condition the stimulation of the visual receptor cells is anomalous, vision will not develop properly, and therefore amblyopia arises.
It has been long admitted that amblyopia is a failure of the cortical developmental process [8, 9], although the exact extent of the visual cortex deficit is unknown. As a result, a rich body of literature from psychophysical studies of human amblyopes and neurophysiologic studies in amblyopic animals has reported sites of visual cortical deficit [10-12]. The recent development of sophisticated imaging technologies such as fMRI allows researchers to image neuronal activity in real time and provides valuable insight into the causes of amblyopia [13, 14]. This has helped us understand the nature of the disease more intuitively. It has been found by fMRI that there is a distinct functional lesion in the striate cortex and LGN for strabismic and anisometropic amblyopia [15-17]. When the amblyopic eye was stimulated, the activation of the striate cortex and LGN was lower than that of the fellow eye, which indicated that both strabismic and anisometropic amblyopes had abnormal cortical representations of foveal stimuli, and the amblyopic eye was deficient in driving the striate cortex [18]. Reduced cortical activation was associated with amblyopic eyes at both spatial frequencies and contrast sensitivity [19-21].
Previously, striate cortex deficits have been defined by fMRI. There is also evidence of anatomical deficits in extrastriate cortex in anisometropic children which are more marked than in strabismic children or adult amblyopes[22-24]. However until now studies regarding relationship of striate and extrastriate cortex deficit and BCVA have been few, and whether extrastriate deficits simply follow the loss of striate function is unclear. In this study we detect the functional deficit of the visual cortex in anisometropic amblyopia children using fMRI technique, and investigate the relationship between visual acuity and visual cortex function. There is evidence not only for marked brain growth between ages, but also differential expansion of occipital compared to many other cortical regions [25]. So it is difficult to study and compare striate and extrastriate cortex activation of different individuals. Because the brain is bilateral, the cortical areas responsible for both eyes should be equal and symmetrical. In this study we compared the cortical activation of amblyopia eyes with the fellow sound eyes, not that of the normal controls. We found reduced activation in extrastriate areas of children with anisometropia which were independent of the deficits in primary visual (i.e., striate) cortex. Moreover, the visual acuity lesion and the cortex activation changes of the striate or extrastriate cortices were not parallel. As the first study of the relationship between BCVA and cortical activations in amblyopic children, in our work only cases with midrange to severe visual acuity losses were included. In the future we will examine larger cohorts of children covering wider degrees and types of amblyopia.
In the present study, we examined, for the first time, striate and extrastriate cortical function in children with amblyopia using BOLD-fMRI and explored its relationship with visual acuity. We found that extrastriate cortex dysfunction was associated with anisometropic amblyopia and, more importantly, it was not simply a downstream consequence of striate cortical loss. The visual acuity lesion and the cortex activation changes were not parallel and fMRI examination did not accord with the visual acuity examination. FMRI examination has much potential value in the evaluation of amblyopia.
Conflict of Interest
The authors have declared that no conflict of interest exists.
References
1. Weber JL, Wood J. Amblyopia: Prevalence, Natural History, Functional Effects and Treatment. Clinical and Experimental Optometry. 2005;88:365-375
2. Conner IP, Odom JV, Schwartz TL, Mendola JD. Monocular activation of V1 and V2 in amblyopic adults measured with functional magnetic resonance imaging. J AAPOS. 2007;11:341-50
3. Anderson SJ, Swettenham JB. Neuroimaging in human amblyopia. Strabismus. 2006;14:21-35
4. Barnes GR, Li X, Thompson B, Singh KD, Dumoulin SO, Hess RF. Decreased gray matter concentration in the lateral geniculate nuclei in human amblyopes. Invest Ophthalmol Vis Sci. 2010;51:1432-1438
5. Cox RW. AFNI: software for analysis and visualization of functional magnetic resonance neuroimages. Comput Biomed Res. 1996;29:162-173
6. Worsley KJ, Liao C, Aston J, Petre V, Duncan GH, Evans AC. A general statistical analysis for fMRI data. Neuroimage. 2002;15:1- 15
7. Talairach J, Tournoux P. Co-planar stereotaxic atlas of the human brain. New York: Thieme. 1988
8. Conner IP, Sharma S, Lemieux SK, Mendola JD. Retinotopic organization in children measured with fMRI. J Vis. 2004;18:509-523
9. Hess RF, Baker CL. Assessment of retinal function in severely amblyopic individuals. Vision Res. 1984;24:1367-1376
10. Goodyear B, Nicolle D. et al. BOLD-fMRI response of early visual areas to perceived contrast in human amblyopia. J Neurophysiol. 2000;84:1907-1913
11. George D. Mower, James L. Burchfiel and Frank HD. Animal models of strabismic amblyopia: Physiological studies of visual cortex and the lateral geniculate nucleus. Developmental Brain Research. 1982;5:311-327
12. Kiorpes L, Kiper DC, O'Keefe LP, Cavanaugh JR, Movshon JA. Neuronal Correlates of amblyopia in the visual cortex of macaque monkeys with experimental strabismus and anisometropia. The Journal of Neuroscience. 1998;18:6411-6424
13. Lv B, He H, Li X, Zhang Z, Huang W, Li M, Lu G. Structural and functional deficits in human amblyopia. Neurosci Lett. 2008;437:5-9
14. Logothetis NK, Pauls J, Augath M, Trinath T, Oeltermann A. Neurophysiological investigation of the basis of the fMRI signal. Nature. 2001;412:150-157
15. Morita T, Kochiyama T, Yamada H, Konishi Y, Yonekura Y, Matsumura M, Sadato N. Difference in the metabolic response to photic stimulation of the lateral geniculate nucleus and the primary visual cortex of infants: a fMRI study. Neurosci Res. 2000;38:63-70
16. Barnes G, Hess R, Dumoulin S, Achtman RL, Pike GB. The cortical deficit in humans with strabismic amblyopia. J Physiol. 2001;15:281-297
17. Miki A, Liu G, Goldsmith Z, Liu CS, Haselgrove JC. Decreased activation of the lateral geniculate nucleus in a patient with anisometropic amblyopia demonstrated by functional magnetic resonance imaging. Ophthalmologica. 2003;217:365-369
18. Conner P, Odom JV, Schwartz TL, Mendola JD. Retinotopic maps and foveal suppression in the visual cortex of amblyopic adults. J Physiol. 2007;583(Pt 1):159-173
19. Ho CS, Giaschi DE. Low-and high-level motion perception deficits in anisometropic and strabismic amblyopia: evidence from fMRI. Vision Res. 2009;49:2891-901
20. Hess RF, Li X, Mansouri B, Thompson B, Hansen BC. Selectivity as well as sensitivity loss characterizes the cortical spatial frequency deficit in amblyopia. Hum Brain Mapp. 2009;30:4054-69
21. Mirzajani A, Riyahi-Alam N, Oghabian MA, Saberi H, Firouznia K. Spatial frequency modulates visual cortical response to temporal frequency variation of visual stimuli: an fMRI study. Physiol Meas. 2007;28:547-554
22. Muckli L, Kiess S, Tonhausen N, Singer W, Goebel R, Sireteanu R. Cerebral correlates of impaired grating perception in individual, psychophysically assessed human amblyopes. Vision Res. 2006;46:506-526
23. Hess RF, Thompson B, Gole GA, Mullen KT. The amblyopic deficit and its relationship to geniculo-cortical processing streams. J Neurophysiol. 2010;104:475-483
24. Mendola JD, Conner IP, Roy A, Chan ST, Schwartz TL, Odom JV, Kwong KK. Voxel-based analysis of MRI detects abnormal visual cortex in children and adults with amblyopia. Hum Brain Mapp. 2005;25:222-236
25. Sowell ER, Thompson PM, Leonard CM, Welcome SE, Kan E, Toga AW. Longitudinal mapping of cortical thickness and brain growth in normal children. J Neurosci. 2004;24:8223-8231
Author contact
![]() Corresponding author: Jian Wang, M.D. PhD., Dept. of Radiology, Southwest Hospital, Third Military, Medical University, Gaotanyan Street, Chongqing, 400038, China. Tel: 086-23-68754419 Cell: 086-13883785811 E-mail: wangjian_811com.
Corresponding author: Jian Wang, M.D. PhD., Dept. of Radiology, Southwest Hospital, Third Military, Medical University, Gaotanyan Street, Chongqing, 400038, China. Tel: 086-23-68754419 Cell: 086-13883785811 E-mail: wangjian_811com.