Impact Factor ISSN: 1449-1907

 Global reach, higher impact
Int J Med Sci 2009; 6(1):51-64. doi:10.7150/ijms.6.51 This issue Cite
Research Paper
Transcriptome analysis of murine thymocytes reveals age-associated changes in thymic gene expression
Ana Lustig1, Arnell Carter1, Dorothy Bertak1, Divya Enika1, Bolormaa Vandanmagsar1, William Wood2, Kevin G. Becker2, Ashani T. Weeraratna1, Dennis D. Taub1 ![]()
1. Laboratory of Immunology, National Institute on Aging-Intramural Research Program, National Institutes of Health, Baltimore, MD. 21224, USA
2. The Research Resources Branch, National Institute on Aging-Intramural Research Program, National Institutes of Health, Baltimore, MD. 21224, USA
Received 2009-1-28; Accepted 2009-2-8; Published 2009-2-9
Abstract
The decline in adaptive immunity, naïve T-cell output and a contraction in the peripheral T cell receptor (TCR) repertoire with age are largely attributable to thymic involution and the loss of critical cytokines and hormones within the thymic microenvironment. To assess the molecular changes associated with this loss of thymic function, we used cDNA microarray analyses to examine the transcriptomes of thymocytes from mice of various ages ranging from very young (1 month) to very old (24 months). Genes associated with various biological and molecular processes including oxidative phosphorylation, T- and B- cell receptor signaling and antigen presentation were observed to significantly change with thymocyte age. These include several immunoglobulin chains, chemokine and ribosomal proteins, annexin A2, vav 1 and several S100 signaling proteins. The increased expression of immunoglobulin genes in aged thymocytes could be attributed to the thymic B cells which were found to be actively producing IgG and IgM antibodies. Upon further examination, we found that purified thymic T cells derived from aged but not young thymi also exhibited IgM on their cell surface suggesting the possible presence of auto-antibodies on the surface thymocytes with advancing age. These studies provide valuable insight into the cellular and molecular mechanisms associated with thymic aging.
Keywords: thymus, involution, aging, microarray, AGEMAP, thymocytes, caloric restriction
Introduction
The aging immune system is often characterized by a general decline in the ability to resist infection and an increase in autoimmune complications such as type 2 diabetes, inflammation, and cancer [1-9]. One of the underlying causes of the reduced effectiveness of the immune system with age is the involution of the thymus. As the thymus involutes, there is a resulting decrease in naïve T cell output, and consequently memory T cells occupy a larger portion of the peripheral T cell pool [10-16]. However, this loss in thymic output with age does not result in any significant change in the total number of peripheral T cells. The maintenance of peripheral T-cell numbers appears to be regulated via a thymus-independent homeostatic process involving expansion of mature peripheral T cells which results in a much more limited T-cell receptor (TCR) repertoire with age. While the precise mechanism(s) facilitating thymic involution has yet to be determined, it appears that this thymic loss is an active process involving a variety of factors including the loss and apoptosis of the thymocytes and supportive cell populations within the microenvironment, alterations in the appropriate signals from supporting stromal and epithelial cells, diminished progenitor cell recruitment and expansion and a decrease in steroid signaling essential for thymocyte development [17-25]. Other factors which are yet to be identified may also be involved. Given that the loss in thymic function is one of the earliest and most consistent steps in the progression to immune dysfunction, thymic involution seems to be a most promising target for therapeutic intervention to reverse thymic atrophy and restore thymic function.
Given that the aged thymus consists of large areas of fat and connective tissue [26, 27], we have focused our efforts on performed DNA array analysis specifically on isolated thymocyte populations in order to obtain a clearer picture of which genes or gene families may demonstrate altered expression levels with age. Our results demonstrate that genes associated with various biological and molecular processes including oxidative phosphorylation, T- and B- cell receptor signaling and antigen presentation were observed to significantly change with thymocyte age. Interesting, the expression of several immunoglobulin chains were also found to be significantly increased in aged thymocytes. Understanding the changes in gene expression in thymocytes with age may hold the key in determining thymocyte fate and decreased thymic output with age.
Materials and Methods
Mice. Specific pathogen-free C57BL/6 mice of various ages were purchased through the Office of Biological Resources and Resource Development of the National Institute on Aging (Bethesda, MD). All mice were maintained in an AAALAC-certified barrier facility and were acclimated for 2 weeks prior to use. All mice were fed autoclaved food and water ad libitum. All mice with evidence of disease (e.g., enlarged spleen, gross tumors) were not utilized in these studies.
Thymocyte isolation. Freshly-extracted thymi from mice of various ages were dissociated in RPMI using a syringe and forceps. Cell clumps were broken up with repeated pipetting and then poured through 70μm nylon mesh cell strainers (BD Falcon, Bedford, MA) to remove connective tissue and any remaining clumps. The cells were washed once to remove fat cells, which will float to the top rather than pelleting at the bottom with the thymocytes. The red blood cells then were lysed with ammonium chloride buffer. The remaining thymocyte population, which reflects the actual interactive environment of the thymus, was counted, washed twice in RPMI followed by PBS. The cell pellets were either used directly in the Qiagen RNEasy mini kits for RNA preparation or lysed in RIPA buffer containing protease and phosphatase inhibitors (Sigma, St Louis, MO) to use in Western blot analysis, or resuspended in the appropriate buffer for whatever assay was used following cell preparation.
In certain experiments, thymocytes were magnetically labeled using the Pan T cell isolation kit, then passed through LD magnetic cell separation columns (Miltenyi Biotec, Auburn, CA), to separate them into T cell and non-T cell subsets. RNA was then isolated from these cell subsets using the Qiagen RNEasy Mini Kit as described below, and used for real-time RT-PCR as described above.
RNA extraction and array analysis. For each array sample, the RNA was prepared from the purified thymocytes. The thymocytes were processed by using the RNEasy Mini Kit (Qiagen, Valencia, CA). Quality and quantity of total RNA samples was assessed using an Agilent 2100 Bioanalyzer (Agilent Technologies, Palo Alto, CA). This total RNA was used to generate fluorescent cRNA for use with Agilent's oligonucleotide microarrays. The RNA was amplified and labeled using the Agilent Low RNA Input Fluorescent Linear Amplification Kit following manufactures protocols. In Short: Between 0.5μg to 2μg of total RNA was used to generate first and second strands of cDNA containing a T7 RNA polymerase promoter. Then cRNA was synthesized using T7 RNA polymerase which simultaneously incorporates cyanine 3- or cyanine 5- labeled CTP (Perkin Elmer, Wellesley, MA). Qiagen RNeasy columns (Qiagen Valencia, CA) were used to purify the labeled cRNA and the final concentration was assessed using a Nanodrop ND-1000 spectrophotometer (Nanodrop Technologies, Wilmington, DE). 750 ng of Cy3-labeled cRNA and 750 ng of Cy5-labeled control sample were combined with spiked in control probes specific for targets on the arrays and hybridized over night at 600C to Agilent Mouse Whole Genome 44K Oligo Microarrays (Agilent Technologies, Palo Alto, CA). The arrays were washed at room temperature 6X SSC with 0.005% Triton X-102 for 10 minutes and 0.01x SSC with 0.005% Triton X-102 at 40C for 5 minutes. The slides were then dried in a nitrogen stream and scanned at 10 micron resolution using an Agilent Microarray scanner G2565BA. Data was extracted using Agilent Feature Extractor Software (v7.1).
Statistical data analysis. All data was processed a Z score statistical analysis method developed at NIA [28]. In order to be selected for the final gene list, the expression value of a particular gene had to be at least 1.5 times different from the Z score of the control. Differences were considered statistically significant only if they had a p value less than 0.01.
Gene expression profiles. The selected gene lists were uploaded along with their Z scores to the Microarray Data Analysis website of the National Human Genome Research Institute (http://arrayanalysis.nih.gov/). Using distance-based gene selection, gene expression profiles were created in order to visualize differences between age, gender and diet.
Real-time PCR. Array results were verified by semi-quantitative RT-PCR. One-half to one microgram of RNA from thymocyte samples were used to make cDNA with the iScript cDNA synthesis kit (BioRad, Hercules, CA). One microliter of each cDNA sample was then used to measure quantity using the SYBR Green PCR master mix (Applied Biosystems) and reactions were run on the 7500 fast or 7300 PCR system (Applied Biosystems). The results were normalized to 18S using the QuantumRNA universal 18S (Ambion, Austin, TX) and were also used to determine relative quantities. The primers are shown in Table 4.
Real-time RT-PCR confirmation of genes up-regulated with age in the DNA array. This table lists a series of confirmations of array results using real-time RT-PCR. Many of the down-regulated genes were difficult to confirm, probably due to already low levels of expression. Up-regulated immunoglobulin-associated genes were easily confirmed and validated the array results for that group of genes.
| GENE NAME | Gene ID | Gene Name | ARRAY RESULTS | PCR Results | Forward Primer | Reverse Primer | ||
|---|---|---|---|---|---|---|---|---|
| (zratio) 6m-1m | (zratio) 16m-1m | (zratio) 24m-1m | Fold Change 24M-1M | |||||
| kappa light chain of Mab7 mRNA, partial cds | AF152371 | IgKV1, IgKVK | 0.55 | 9.02 | 7.98 | 57* | ACCAAGCTGGAAATCAATCG | TGTCGTTCACTGCCATCAAT |
| immunoglobulin joining chain (Igj) | NM_152839 | Igj | 1.53 | 6.83 | 5.83 | 38* | AAGCGACCATTCTTGCTGAC | GGGAGGTGGGATCAGAGATATT |
| histocompatibility 2, class II antigen A, beta 1 (H2-Ab1) | NM_010379 | H2-Ab1 | 2.51 | 4.72 | 4.53 | 3.3 | TTCATCCGTCACAGGAGTCA | AGGAATTCGGAGCAGAGACA |
| chemokine (C-X-C motif) receptor 6 (Cxcr6) | NM_030712 | Cxcr6 | 2.49 | 7.91 | 3.98 | 4.7* | AACAGCCAGGAGAACAAACG | GGGCAAGTTCAGCAGAAACA |
| decorin (Dcn) | NM_007833 | Dcn | 1.84 | 4.40 | 3.88 | 13 | ACCCTGACAATCCCCTGATA | GCCCCTTCTTTGATCTCTGT |
| Mus musculus immunoglobulin heavy chain 6 (heavy chain of IgM) | BC018315 | IgH6 | 0.75 | 4.41 | 3.89 | 14 | ATGGAATGGACCTGGGTCTT | ATGTCCAGGCCTCTGCTTTA |
| ribosomal protein, large, P1 (Rplp1) | NM_018853 | Rplp1 | 3.90 | 3.49 | 3.78 | 4.7 | CACGGAGGATAAGATCAATGC | ATGAGGCTCCCAATGTTGAC |
| acidic ribosomal phosphoprotein P0 (Arbp) | NM_007475 | Arbp | 3.38 | 3.79 | 3.78 | 77* | TCGTTGGAGTGACATCGTCT | GCTCCCACAATGAAGCATTT |
| Actin, cytoplasmic 1 (Beta-actin) | NAP018710-001 | B-actin | 2.78 | 2.14 | 3.51 | NC | CTAAGGCCAACCGTGAAAAG | CCATCACAATGCCTGTGGTA |
| Mouse MHC class I H2-K-alpha-2 gene (haplotype bm9), partial exon 3 | M13200 | H2K1 | 1.57 | 4.52 | 3.42 | NC | AAGAGCGATGAGCAGTGGTT | CCACGTTTTCAGGTCTTCGT |
| cytochrome c oxidase subunit II (Cox2) | AF378830 | Cox2 | 3.07 | 3.66 | 3.25 | NC | TAATTGCTCTCCCCTCTCTACG | CACCAGGTTTTAGGTCGTTTG |
| annexin A2 (Anxa2) | NM_007585 | Anxa2 | 3.01 | 3.15 | 3.25 | 2.5* | ACGAAATCCTGTGCAAGCTC | ATCCCTCTCAGCATCGAAGT |
| CD8 antigen, beta chain (Cd8b) | NM_009858 | Cd8b | 2.27 | 2.23 | 2.32 | 3.8 | ACGAAGCTGACTGTGGTTGA | AAGCAGGATGCAGACTACCA |
| vav 1 oncogene (Vav1) | NM_011691 | Vav1 | 1.99 | 2.12 | 1.90 | 3.2* | CGAACCTTCCTGTCTACTTGCT | TTCCTTTGTTCTGGGCAATG |
| chemokine (C-X-C motif) receptor 4 (Cxcr4) | NM_009911 | Cxcr4 | 1.82 | 1.75 | 1.72 | 3.5* | TTGCCATGGAACCGATCA | TCCGTCATGCTCCTTAGCTT |
| phosphoinositide 3-kinase regulatory subunit p85alpha | U50413 | U50413 | 1.73 | 1.80 | 1.63 | NC | CCCAAGCTGGATGTGAAGTT | TTTCCTGGGAAGTACGGGTGTA |
Western blot analysis. Equal amounts of protein from thymocytes were run on 10% tris-glycine gels and transferred to PVDF membranes (Invitrogen, Carlsbad, CA) on the Novex gel-blot system (Invitrogen, Carlsbad, CA). The nitrocellulose filters were then probed using HRP-conjugated specific antibodies to the immunoglobulin heavy chain M (IgM) and IgG obtained from Abcam (Cambridge, MA). The antibody to beta-actin was from Sigma-Aldrich (St. Louis, MO). The HRP-conjugated secondary antibody for the beta-actin was from Amersham (Piscataway, NJ). Bands were visualized using the ECL Plus western blotting detection reagents (Amersham) and CL-X Posure film from Pierce (Rockford, IL).
Flow cytometry. Cell suspensions were washed in HBSS with 0.1% BSA and 0.1% sodium azide (Sigma-Aldrich, St. Louis, MO). Antibody against Fc receptors was used to block non-specific binding (BD Biosciences, San Jose, CA). Cells were stained extracellularly for B220 (BD) ten minutes on ice and either simultaneously stained for extracellular IgM (Caltag, Carlsbad, CA), or subsequently stained for intracellular IgM. For intracellular staining, the cells were fixed in PBS containing 2% paraformaldehyde (Sigma-Aldrich) and washed twice in PBS with 0.03% saponin to permeabilize the cell membranes. Anti-IgM was added for 30 minutes at 4 degrees, and then the cells were washed twice in PBS with sodium azide. The stained cells were then run on a FACScan flow cytometer (BD) and the data analyzed using Cell Quest software (BD).
Results
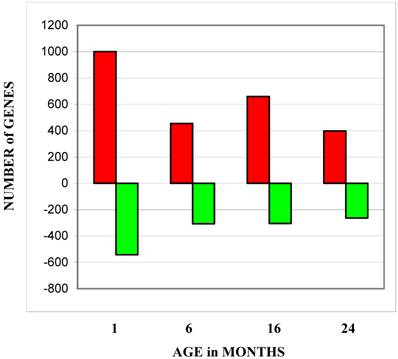
Gene expression changes were identified by comparing gene expression profiles across the indicated age groups to the gene expression profiles of the 1 month age group (Figure 1). While the numbers of genes with decreased expression were fairly consistent throughout the three older ages, the number of genes with increased expression peaked in the 16-month age group. Table 1 lists the canonical cellular pathways affected by changes in gene expression levels with thymocytes age. This list was generated by uploading the list of genes with the most significant changes to the Ingenuity Analysis website (http://www.ingenuity.com/). Table 1A lists all pathways affected at any age group. As would be expected, these included pathways involved in lymphocyte receptor signaling and antigen presentation. Genes involved in oxidative phosphorylation were the most numerous regardless of age group. Pathways involving purine metabolism, PI3/Akt signaling, and ubiquinone synthesis are the ones most affected during aging (Table 1B). All of these pathways are involved in cell survival [29-33], and deficiencies in the ubiquinone pathway have already been linked to increased longevity in mice [34].
Number of genes at each age group with expression levels higher or lower than levels exhibited by the 1 month age group. The bars labeled total show the total number of all genes changed at all ages. Red bars depict the number of genes which increased expression levels and green bars depict the number of genes which decreased expression levels.
Canonical pathways containing thymocyte genes which changed expression levels with age. These pathways were identified by the ingenuity data analysis program (www.ingenuity.com) using our uploaded data.
| ALL CHANGES AT ALL AGES | ||
|---|---|---|
| CANONICAL PATHWAYS | NUMBER of GENES | p VALUE |
| Oxidative Phosphorylation | 18 | 0.001 |
| T Cell Receptor Signaling | 15 | 1.2 x 10⁻⁵ |
| Antigen Presentation | 14 | 4.7 x 10⁻⁸ |
| B Cell Receptor Signaling | 14 | 0.007 |
| Purine Metabolism | 14 | NS |
| G Protein Coupled Receptor | 13 | 0.001 |
| Integrin Signaling | 13 | 0.17 |
| Erk/MAPK Signaling | 11 | 0.10 |
| PI3/Akt Signaling | 10 | 0.03 |
| Apoptosis Signaling | 9 | 0.017 |
| CHANGES at 24 MONTHS | ||
| CANONICAL PATHWAYS | NUMBER of GENES | p VALUE |
| Oxidative Phosphorylation | 11 | 6.8 x 10⁻⁴ |
| Purine Metabolism | 9 | 2.0 x 10⁻¹ |
| Antigen Presentation | 8 | 7.6 x 10⁻⁶ |
| TCR Signaling | 6 | 9.7 x 10⁻³ |
| PI3/Akt Signaling | 6 | 2.4 x 10⁻² |
| Ubiquinone Synthesis | 4 | 3.1 x 10⁻² |
Pathway analysis (www.ingenuity.com) identified signaling pathways and gene families that were affected in aging thymocytes. Table 2A lists all affected functions regardless of age and Table 2B lists the functions most affected at the oldest age group and highlighted groups of genes involved in immune response, development and disease. In the oldest age group, the functional category including the most genes was cell-to-cell signaling and interaction, which could play a key role in thymocyte survival or death associated with age. Many genes associated with cancer are also affected in aging thymocytes. Given the increased incidence of cancer with age [7, 35, 36] (http://www.nia.nih.gov/ResearchInformation/ConferencesAndMeetings/WorkshopReport/Figure1.htm), this may be a valuable group of genes warranting further scrutiny.
Functional categories containing thymocyte genes which changed expression levels with age. These groups were identified by the ingenuity data analysis program (www.ingenuity.com) using our uploaded data.
| ALL CHANGES AT ALL AGES | ||
|---|---|---|
| GENE FUNCTION | NUMBER of GENES | p VALUE |
| Hematological System Development and Function | 48 | 3.82 x 10⁻⁴ |
| Immune and Lymphatic System Development and Function | 45 | 3.82 x 10⁻⁴ |
| Cell-to-Cell Signaling and Interaction | 42 | 8.00 x 10⁻³ |
| Cancer | 32 | 3.44 x 10⁻⁴ |
| Immune Response | 31 | 2.40 x 10⁻² |
| Small Molecule Biochemistry | 22 | 9.52 x 10⁻³ |
| DNA Replication, Recombination and Repair | 20 | 2.48 x 10⁻² |
| CHANGES at 24 MONTHS | ||
| GENE FUNCTION | NUMBER of GENES | p VALUE |
| Cell-to-Cell Signaling and Interaction | 22 | 0.016 |
| Hematological System Development and Function | 18 | 0.012 |
| Immune and Lymphatic System Development and Function | 17 | 0.010 |
| Small Molecule Biochemistry | 16 | 0.005 |
| Cellular Assembly and Organization | 16 | 0.023 |
| Cancer | 15 | 0.010 |
| Cellular Function and Maintenance | 14 | 0.001 |
| Cell Cycle | 13 | 9.52 x 10⁻³ |
| Immunological Disease | 12 | 0.002 |
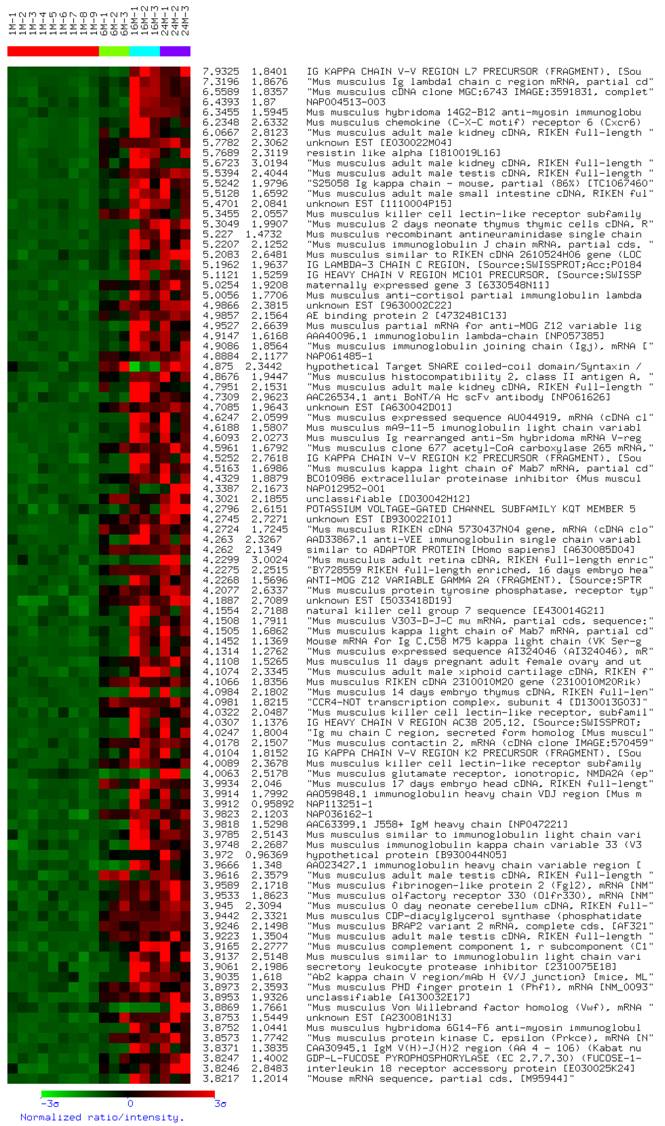
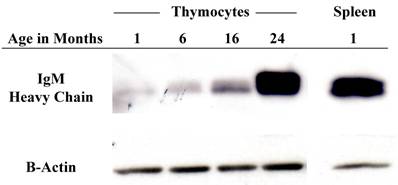
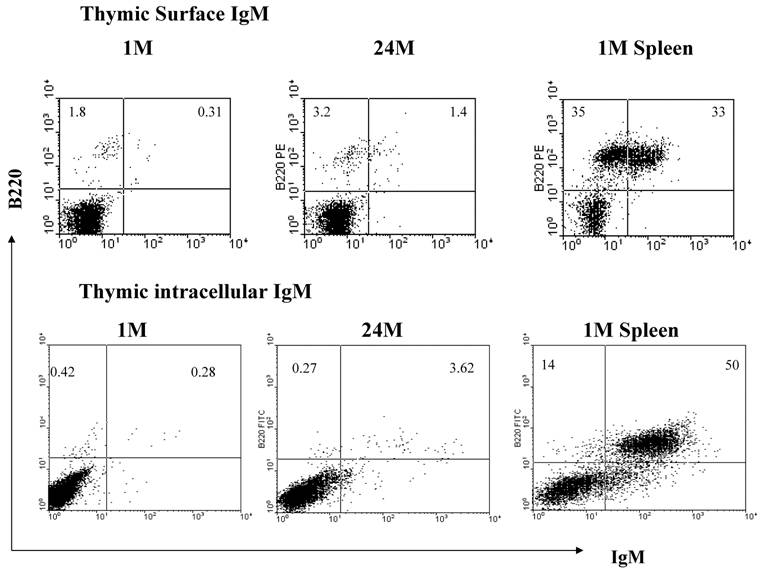
In order to obtain an expression profile of the genes which changed the most with age, we uploaded all of our array data into the array analysis program of the NHGRI (http://arrayanalysis.nih.gov). Table 3 lists the top genes that were up- or down-regulated with age. A. A complete list of all genes that changed with age is available on request. Most of the genes with the greatest increase were immunoglobulin-associated genes. This was a very interesting finding, given that the number of immunoglobulin-producing cells within the thymus is actually quite limited. In order to identify genes that can discriminate among aging versus young thymocytes, we subjected our array data to distance-based analysis. Figure 2 shows the top 100 genes with significant differences in expression levels at all ages. The most notable aspect of the profile is the fact that all 100 genes exhibiting the greatest differences with age actually increased in expression. In light of these results, we focused our attention on genes demonstrating increased transcription, more specifically several of the immunoglobulin-associated genes found to be up-regulated in their expression in thymocytes with age. As shown in Table 4, real time RT-PCR confirmed the increased levels of many of these genes identified in the array analysis. Moreover, Western blot analysis of thymocyte lysates also confirmed that IgM increases with age (Figure 3). Flow cytometry analysis shows that there is also a modest age-associated increase in the percentage of IgM+/B220+ B cells within the thymus and that this increase in IgM is both extra- and intra-cellular (Figure 4).
Top genes that increased or decreased with age. This table lists the Z ratios at each age for the genes with the greatest differences in expression levels when comparing the oldest age group, 24 months, to the youngest, 1 month. As can be seen, most of the genes which increased expression levels are immunoglobulin-associated.
| GENE NAMES | GENE NAME | ENTREZ GENE | UNIGENE | Z Ratio 6M-1M | Z Ratio 16M-1M | Z Ratio 24M-1M |
|---|---|---|---|---|---|---|
| Similar to Ig heavy-chain region precursor | LOC380800 | 380800 | 3.74 | 13.81 | 12.67 | |
| Mus musculus kappa light chain of Mab7 mRNA, partial cds | AF152371 | Mm.333124 | .55 | 9.02 | 7.98 | |
| S25058 Ig kappa chain- mouse, partial (86%) [TC1067460] | S25058 | 2.04 | 6.89 | 6.85 | ||
| Immunoglobulin kappa chain | LOC545854 | 545854 | Mm.426205 | 0.60 | 6.34 | 6.38 |
| Immunoglobulin joining chain | IgJ | 16069 | Mm.1192 | 1.64 | 7.26 | 6.32 |
| Immunoglobulin heavy chain 6 (heavy chain of IgM) | Igh-6 | Mm.342177 | 0.15 | 4.50 | 5.16 | |
| Immunoglobulin kappa chain variable 28 (V28) | IgK-V28 | 16114 | Mm.333124 | 1.76 | 7.14 | 5.07 |
| RIKEN cDNA 3110049J23 | 9130427K04 | 67307 | Mm.368563 | 4.61 | 3.67 | 5.06 |
| RIKEN cDNA 5730437N04 | 5730437N04Rik | 70544 | Mm.46654 | 5.20 | 5.88 | 4.79 |
| Similar to Ig lambda-1 chain C region | J00582 | 433053 | J00582 | 1.66 | 6.52 | 4.63 |
| RIKEN cDNA B230118H07 | Rag1/Nwc fusion | 68170 | Mm.31263 | -2.49 | -2.26 | -2.62 |
| Mus musculus mRNA for Zfp-1 zinc finger protein [X16493] | Zfp1 | 22640 | Mm.4184 | -3.09 | -2.34 | -2.72 |
| Mus musculus CDC28 protein kinase regulatory subunit 2 | Cks2 | 33197 | Mm.222228 | -3.27 | -3.26 | -2.76 |
| Mus musculus cytochrome C oxidase subunit VIIb mRNA [NM_025379] | Cox7b | 66142 | Mm.197728 | -1.92 | -3.39 | -2.83 |
| Integrin beta 3 binding protein (beta3-endonexin) | Itgb3bp | Mm.257094 | -2.15 | -2.93 | -2.95 | |
| Mus musculus BCL-2 modifying factor homolog , A430110F10 | Bmf | 171543 | Mm.210125 | -3.30 | -3.42 | -2.96 |
| Membrane metallo-endopeptidase-like 1 | Mmel1 | 27390 | -3.11 | -3.76 | -3.88 | |
| Mus musculus chemokine (C-C motif) ligand 25 (Ccl25) mRNA | Ccl25 | 20300 | Mm.7275 | -7.31 | -6.14 | -4.31 |
| Mus musculus S100 calcium binding protein A9 (calgranulin B) | S100a9 | 20202 | Mm.2128 | -8.16 | -2.66 | -9.39 |
| Mus musculus S100 calcium binding protein A (calgranulin B) | S100a8 | 20201 | Mm.21567 | -8.99 | -3.76 | -10.12 |
Expression profile of the most significantly changed genes with age. This profile was generated in the NHGRI website (https://arrayanalysis.nih.gov), using distance-based analysis of total data and showing the top 100 changed genes. Red represents up-regulation of gene expression, and green represents down regulation of gene expression.
Protein levels of immunoglobulin increase within the thymocytes with age. Western blot analysis of IgM heavy chain protein levels with successive age. This image is representative of 3 experiments with at least 7 total young and old samples.
Flow cytometry confirms an increase in IgM+ cells with age within the thymus. There are greater relative percentages of both surface and intracellular IgM in the old thymocytes when compared to the young. Flow cytometry images are representative of at least 2 experiments using 5 young and 6 old mice.
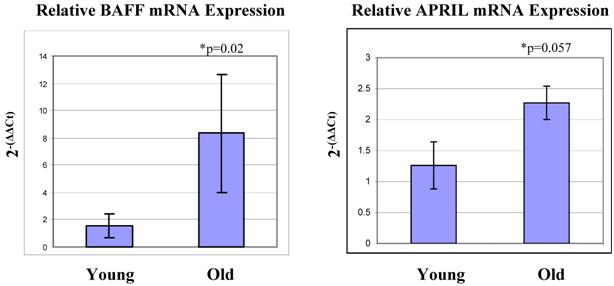
In humans, thymic B cells increase with age [37] as well as in some autoimmune diseases such as myasthenia gravis [38]. Other groups have characterized small populations of B cells within the thymus (Akashi et al., 2000; Mori et al., 1997 [39, 40]. These B cells are B220 low and IgM negative [40]. They appear to mature within the thymus, and produce IgM largely from the IgH6 family, which was the IgM group that showed the greatest increase in expression with age in our array system. Ultimately, as these cells mature, they begin to express CD5 on their surfaces [40]. It is possible that the increase in B cells we observe with age is a result of an increase in the maturation of these thymic B cells. If this is the case, perhaps we would see correlating increases in genes which facilitate B cell maturation. With this in mind, we examined the mRNA expression levels of BAFF and APRIL within the thymocytes. These two genes are expressed by cells of lymphoid lineage, and are linked to increased B cell proliferation, maturation and survival [41-43]. They are specifically involved in the progression from the T1 to T2 stages of immature B cells. We observed that both of these genes are elevated in expression in the old thymocytes when compared to the young by real-time RT-PCR (Figure 5). These genes thus may be a contributing factor to the increase in B cells, both in total number and in maturity, within the thymus.
Real-time RT-PCR analysis reveals increased levels of mRNA expression of BAFF and APRIL in aged thymocytes. BAFF and APRIL are both involved in maturation and survival of B cells, and their expression levels are elevated in aged thymocytes when compared to the levels in young thymocytes. This correlates with the increase in B cells detected with age. These Figures represent one experiment with six mice in each age group.
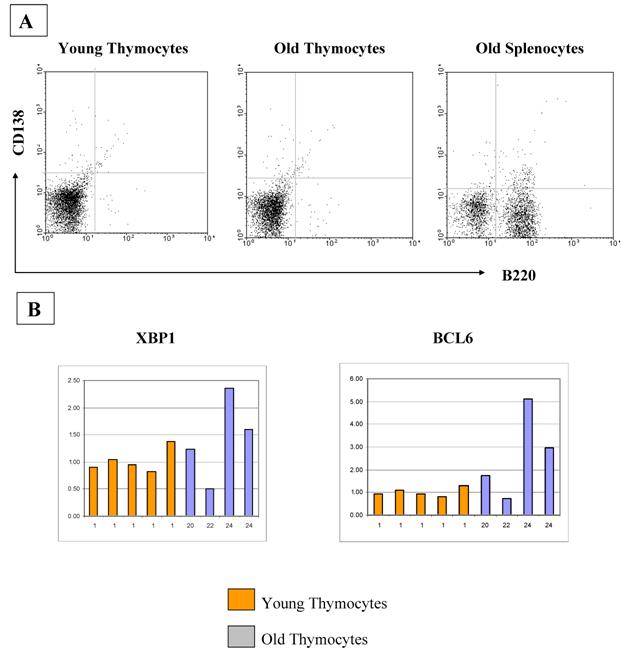
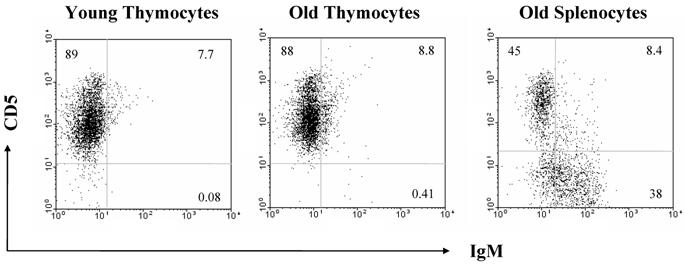
The increase in B cell numbers in the thymus with age seems too small to account for the greatly increased quantities of immunoglobulin expression as determined by real time PCR and Western analyses. Therefore, we also looked at other cell types which could be producing immunoglobulin within the thymus, such as plasma cells. However, we found that plasma cells were not contributing to the increased production of immunoglobulin with age, as flow cytometric analysis for B220, CD38 and CD138 on the thymocytes as well as RT-PCR analysis for the plasma cell markers, blimp1 and XBP1, failed to demonstrate any significant differences in expression levels with age (Figure 6). There is also no relative increase in the size of the B1 B cell population with age as assessed by flow cytometric analysis of the B220/CD5 populations, although we do see a minute, but statistically significant difference in the CD5 negative, IgM positive population (Figure 7).
A) CD138 analysis by flow cytometry demonstrates that there is no difference in the percentages of plasma cells in thymocytes from young and old mice. Averages of CD138+B220- cells are 1.12% and 1.07%, respectively. These Figures are representative of three experiments with a total of 10 young and 10 old mice. B) If plasma cell numbers increase in old thymi, an increase in Blimp1 and XBP1 expression and a decrease in BCL6 should be observed. Real-time RT-PCR quantitation of plasma cell markers XBP1 and BCL6 show no differences between young and old thymocytes. Blimp1 RNA was too low to be detected in any of our thymocyte samples, although positive controls were detectable.
CD5 analysis by flow cytometry demonstrates that there is no difference in the percentages of B1 B cells in thymocytes from young and old mice. Averages of CD5+IgM+ cells are 0.12% and 0.29%, respectively. These Figures are representative of two experiments with a total of 5 young and 6 old mice.
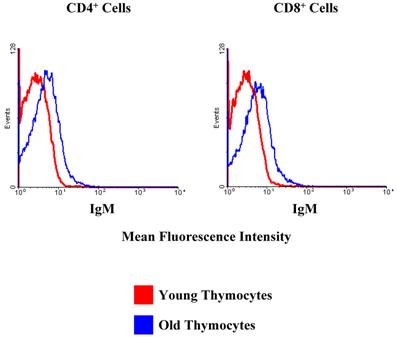
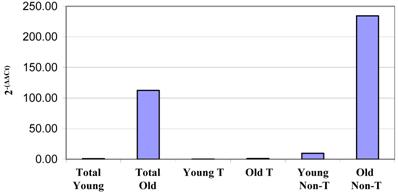
Surprisingly, we did observe a shift in the fluorescence intensity of IgM on the surfaces of aged CD4+ and CD8+ thymocytes (Figure 8). Given that immunoglobulins are not associated with T cells, it was of interest to determine if the increase in IgM expression by older thymocytes was due to actual production by thymic T cells or non-T cell populations. To this end, we separated the cells into T and non-T subsets using the pan T-cell isolation kit and magnetic columns from Miltenyi. We then isolated the RNA from each group of cells, and this RNA was used for real-time RT-PCR to determine the relative amounts of IgM being produced by young and old thymocytes. As shown in Figure 9, the majority of the IgM production in the thymus originates from the non-T cell populations. Since the only increase in immunoglobulin production detected in the aged samples was associated with B220+ B cells within the thymus (as previously shown by flow cytometry, Figure 4), it appears that the increased production of immunoglobulin detected in DNA microarrays and PCR within the aged thymocytes is a reflection of the generalized increased output of antibodies by B cells in the aged thymus. Given that the actual number of circulating B cells within the thymus is very small, even slight alterations in immunoglobulin expression may be detected as significant. The large concentration of immunoglobulin protein detected within the thymus by Western blot may also be amplified by the presence of circulating auto-antibodies bound to thymic T cell surfaces as suggested by Figure 8.
CD4+ and CD8+ T cells in the thymus exhibit an increase in cell surface IgM with age. Red lines designate the young samples and blue lines the old samples. Flow cytometry demonstrates that there is a clear shift in the mean fluorescence intensity of IgM in the old thymocytes when compared to the young thymocytes. This indicates a greater number of IgM molecules on the cell surfaces. These data are representative of 3 separate experiments with 3 to 7 mice in each group.
Real-time RT-PCR results of IgH6 RNA relative quantities from total non-fractionated thymocytes and T cell and non-T cell fractions from column-separated thymocytes. Thymocytes were separated by magnetic columns into T cell and non-T cell fractions. RNA isolated from these samples was then used in real-time RT-PCR analysis of IgG heavy chain transcription. This clearly demonstrates that all of the immunoglobulin production appears to be occurring in the non-T cells within the thymus. Similar results were obtained for IgH6, H2-Ab1 and IgJ. These data are representative of four experiments using pooled thymocytes from at least 3 mice of each age group.
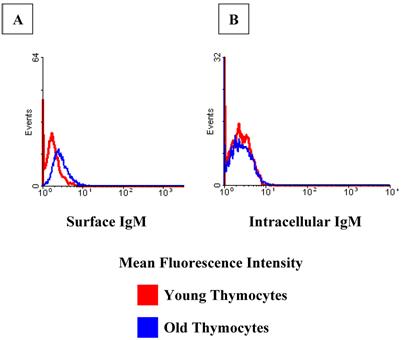
Further evidence supporting the presence of auto-antibodies bound to the surface of thymic T cells can be observed in Figure 10. CD3+ positive thymocytes have a slightly higher fluorescence intensity for surface IgM in the old samples when compared to the young (Figure 10A). This shift in intensity is not evident in the same cells stained for intracellular IgM (Figure 10B), meaning these are not the cells producing the IgM; it is merely binding on their cell surfaces. Attempts to elute and isolate these antibodies have proven quite difficult and more intensive studies are underway to examine these thymic T cell-bound antibodies.
CD3+ cells of the thymus exhibit a shift in mean fluorescence intensity with age, indicating an increased presence of IgM on their surfaces. (A). However, this phenomenon is not evident intracellularly (B), indicating the IgM comes from a source outside of those cells. Data shown is for CD4+ cells. Similar results were obtained for CD8+ cells. Red lines represent young samples and blue lines represent old samples. These data are representative of two experiments using pooled thymocytes form 3 young and 3 to 5 old mice in each experiment.
Discussion
There are a myriad of complications arising from the weakening of the effectiveness of the immune system with age [1-9]. One of the most prominent landmarks of the aging immune systems is the involution of the thymus, which results in decreased thymic output of nascent T cells [10-16]. Many theories have been examined as to why this involution occurs with advancing age [18, 44, 45]; however, little is known about the molecular changes that occur within the thymus and in thymocytes with age. Here, we have examined the actual interactive thymocyte populations derived from C57BL/6 mice after removal of fat and connective tissue, at various stages of aging using microarray gene analysis. These thymocytes represent the actual relative composition of the thymus at the various ages and thus are better suited to understanding how the relative dynamics of subpopulations may affect thymic aging. At least 600 genes were found to vary in expression levels when compared to the 1-month age group. From these analyses, there were also twice as many genes with increased gene expression as there were demonstrating decreased expression. Moreover, genes demonstrating increased expression levels were consistently of higher statistical significance than those with decreased levels. This is more likely a reflection of the difference in the sensitivity of the assay than a representation of an actual bias toward increased gene expression levels within biological systems with age. As would be expected, genes involved in immune signaling pathways such as B and T cell receptor signaling and antigen presentation were among the pathways containing the largest number of genes changing with age. The canonical pathway with the largest number of detected genes was the oxidative phosphorylation pathway. This is not surprising, given that oxidative phosphorylation controls the energy levels within the cells and is directly linked to lymphocyte survival as well as changes in the redox status of aging organisms [46-49]. Thus, this group of pathways may be vital to thymocyte survival or death during thymic involution. Both the PI3/Akt and ubiquinone synthesis pathways contained a relatively large number of genes which changed expression levels with age and both of these pathways have also been shown to affect cell survival [50-54]. There were large numbers of genes involved in the hematological, immune and lymphatic systems, which vary from control levels at 1 month. Another category of up-regulated genes were associated with cell-to-cell signaling and interaction, important processes in determining cell fate, and likely to be involved in thymic selection and output.
The individual genes demonstrating the most significant and highest levels of age-associated differences in expression were the immunoglobulin-associated genes. These genes included several heavy and light chain sequences. Although not definitively identified, it is interesting to speculate that these genes are not only associated with the increased numbers of B cells within the aging thymus but also may be associated with the production of auto-antibodies to thymic subsets (as shown in Figures 8 and 10). Such auto-antibodies have been demonstrated to increase with age [18, 55-57]. Of the top genes that decreased with age, two were S100 signaling proteins, which are very important in T cell signaling and survival [58-60]. Such decreased expression may result in a diminished capacity for thymocytes activate, differentiate and/or survive.
The large number of immunoglobulin genes that changed with age was quite surprising as there are few antibody-producing cells in the thymus, even with advancing age. Western blot analysis of IgM quantities demonstrated levels of IgM heavy chain in the thymocytes of 24-month-old mice as high as in the spleen of 1-month-old mice. The source of these large quantities of immunoglobulin is still unclear. Although flow cytometry analysis displayed increased numbers of IgM+B220+ B cells (average 1% in young vs. 5% in old), the total numbers of cells did not appear to reflect the amount of change detected by array, PCR and western blot. Therefore, we looked at other cell types within the thymus that may be producing immunoglobulin. There were no detectable increases in plasma cells or CD5+ B1 B cells in the thymi of young and aged mice as measured by flow cytometric analysis [61, 62]. The increase in IgM positive cells we observed does not appear to be within the CD5+ population (Figure 7) that has been identified as maturing within the thymus [40]. They could represent a separate B cell population that matures and increases in number within the thymus with increased age. Thymic B cells may play a role in T cell negative selection [63]. These B cells express IgM on their surface and are thus of a more mature phenotype. Since these are the ones we observe increasing with age within the thymus, it would be interesting to speculate that this may be another factor contributing to thymic involution with age.
Interestingly, flow cytometric analysis did indicate the presence of IgM on the surface of both CD4+ and CD8+ T cells within the thymus. Obviously, it is highly unlikely that this T-cell associated immunoglobulin reflects actual production of IgM by aging T cells but is more likely membrane bound IgM due to an increase in the levels of circulating auto-antibodies adhering to the T cell surface [64]. Additional flow cytometric analysis revealed that although there was a shift in the surface IgM mean fluorescence intensity on thymic T cells with age, this increase was not intracellular and thus was bound to the cell surface suggesting the presence of autoantibody. Further tests are necessary to determine the exact nature of this binding. The phenomenon of age-associated increase in auto-antibodies has been well documented [18, 55-57] and these auto-antibodies could influence thymic involution. This shift in IgM mean fluorescence intensity in aged murine T cells has also been previously described [64]. Together, these data suggest that increased numbers of thymic B cells and auto-antibodies may be associated with aging in thymocytes and that autoimmune interactions may play important roles in thymocyte death and thymic involution.
Acknowledgements
We would like to thank Dr. Dan Longo for his thoughtful review of this manuscript. This research was entirely supported by the Intramural Research Program of the National Institute on Aging, National Institutes of Health.
Contribution statement: AL, ATW and DDT designed and supervised the research at NIA; AL, AC, DB, DE, BV, WW and KB conducted the microarray and follow-up experiments; AL, ATW and DDT wrote and edited the paper.
Conflict of Interest
The authors have declared that no conflict of interest exists.
References
1. Targonski P.V, Jacobson R.M, Poland G.A. Immunosenescence: role and measurement in influenza vaccine response among the elderly. Vaccine. 2007;25:3066-3069
2. Noreddin A.M, Haynes V. Use of pharmacodynamic principles to optimise dosage regimens for antibacterial agents in the elderly. Drugs Aging. 2007;24:275-292
3. Liang S.Y, Mackowiak P.A. Infections in the elderly. Clin Geriatr Med. 2007;23:441-456
4. Vasto S, Candore G, Balistreri C.R, Caruso M, Colonna-Romano G. et al. Inflammatory networks in ageing, age-related diseases and longevity. Mech Ageing Dev. 2007;128:83-91
5. High K.P, Prasad R, Marion C.R, Schurig G.G, Boyle S.M. et al. Outcome and immune responses after Brucella abortus infection in young adult and aged mice. Biogerontology. 2007;8:583-593
6. Htwe T.H, Mushtaq A, Robinson S.B, Rosher R.B, Khardori N. Infection in the elderly. Infect Dis Clin North Am. 2007;21:711-743
7. Hakim F.T, Gress R.E. Immunosenescence: deficits in adaptive immunity in the elderly. Tissue Antigens. 2007;70:179-189
8. Mellanby R.J, Thomas D, Phillips J.M, Cooke A. Diabetes in non-obese diabetic mice is not associated with quantitative changes in CD4+ CD25+ Foxp3+ regulatory T cells. Immunology. 2007;121:15-28
9. Taub D.D, Longo D.L. Insights into thymic aging and regeneration. Immunol Rev. 2005;205:72-93
10. Ribeiro R.M, Perelson A.S. Determining thymic output quantitatively: using models to interpret experimental T-cell receptor excision circle (TREC) data. Immunol Rev. 2007;216:21-34
11. Dixit V.D, Yang H, Sun Y, Weeraratna A.T, Youm Y.H. et al. Ghrelin promotes thymopoiesis during aging. J Clin Invest. 2007;117:2778-2790
12. Mitchell W.A, Meng I, Nicholson S.A, Aspinall R. Thymic output, ageing and zinc. Biogerontology. 2006;7:461-470
13. Hale J.S, Boursalian T.E, Turk G.L, Fink P.J. Thymic output in aged mice. Proc Natl Acad Sci U S A. 2006;103:8447-8452
14. Effros R.B. Role of T lymphocyte replicative senescence in vaccine efficacy. Vaccine. 2007;25:599-604
15. Ely K.H, Roberts A.D, Kohlmeier J.E, Blackman M.A, Woodland D.L. Aging and CD8+ T cell immunity to respiratory virus infections. Exp Gerontol. 2007;42:427-431
16. Clambey E.T, Kappler J.W, Marrack P. CD8 T cell clonal expansions & aging: a heterogeneous phenomenon with a common outcome. Exp Gerontol. 2007;42:407-411
17. Petrovic-Dergovic D.M, Rakin A.K, Dimitrijevic L.A, Ristovski J.S, Kustrimovic N.Z. et al. Changes in thymus size, cellularity and relation between thymocyte subpopulations in young adult rats induced by Somatostatin-14. Neuropeptides. 2007;41:485-493
18. Prelog M. Aging of the immune system: a risk factor for autoimmunity? Autoimmun Rev. 2006;5:136-139
19. Jondal M, Pazirandeh A, Okret S. Different roles for glucocorticoids in thymocyte homeostasis? Trends Immunol. 2004;25:595-600
20. Yajima N, Sakamaki K, Yonehara S. Age-related thymic involution is mediated by Fas on thymic epithelial cells. Int Immunol. 2004;16:1027-1035
21. Pazirandeh A, Jondal M, Okret S. Glucocorticoids delay age-associated thymic involution through directly affecting the thymocytes. Endocrinology. 2004;145:2392-2401
22. Dominguez-Gerpe L, Rey-Mendez M. Evolution of the thymus size in response to physiological and random events throughout life. Microsc Res Tech. 2003;62:464-476
23. Li L, Hsu H.C, Grizzle W.E, Stockard C.R, Ho K.J. et al. Cellular mechanism of thymic involution. Scand J Immunol. 2003;57:410-422
24. Mocchegiani E, Santarelli L, Costarelli L, Cipriano C, Muti E. et al. Plasticity of neuroendocrine-thymus interactions during ontogeny and ageing: role of zinc and arginine. Ageing Res Rev. 2006;5:281-309
25. Hannestad J, Monjil D.F, Diaz-Esnal B, Cobo J, Vega J.A. Age-dependent changes in the nervous and endocrine control of the thymus. Microsc Res Tech. 2004;63:94-101
26. Elcuman E.A, Akay M.T. Age-dependent immunolocalization of fibronectin and histological changes in the thymus of rats. Vet Res Commun. 1998;22:525-532
27. Oksanen A. Multilocular fat in thymuses of rats and mice associated with thymus involution: a light- and electron-microscope and histochemical study. J Pathol. 1971;105:223-226
28. Cheadle C, Vawter M.P, Freed W.J, Becker K.G. Analysis of microarray data using Z score transformation. J Mol Diagn. 2003;5:73-81
29. Apasov S.G, Blackburn M.R, Kellems R.E, Smith P.T, Sitkovsky M.V. Adenosine deaminase deficiency increases thymic apoptosis and causes defective T cell receptor signaling. J Clin Invest. 2001;108:131-141
30. El-Darahali A, Fawcett H, Mader J.S, Conrad D.M, Hoskin D.W. Adenosine-induced apoptosis in EL-4 thymoma cells is caspase-independent and mediated through a non-classical adenosine receptor. Exp Mol Pathol. 2005;79:249-258
31. Juntilla M.M, Wofford J.A, Birnbaum M.J, Rathmell J.C, Koretzky G.A. Akt1 and Akt2 are required for alphabeta thymocyte survival and differentiation. Proc Natl Acad Sci U S A. 2007;104:12105-12110
32. Swat W, Montgrain V, Doggett T.A, Douangpanya J, Puri K. et al. Essential role of PI3Kdelta and PI3Kgamma in thymocyte survival. Blood. 2006;107:2415-2422
33. Kelso G.F, Porteous C.M, Coulter C.V, Hughes G, Porteous W.K. et al. Selective targeting of a redox-active ubiquinone to mitochondria within cells: antioxidant and antiapoptotic properties. J Biol Chem. 2001;276:4588-4596
34. Aguilaniu H, Durieux J, Dillin A. Metabolism, ubiquinone synthesis, and longevity. Genes Dev. 2005;19:2399-2406
35. Arkenau H.T, Chua Y.J, Cunningham D. Current treatment strategies in elderly patients with metastatic colorectal cancer. Clin Colorectal Cancer. 2007;6:508-515
36. Fraga M.F, Agrelo R, Esteller M. Cross-talk between aging and cancer: the epigenetic language. Ann N Y Acad Sci. 2007;1100:60-74
37. Flores K.G, Li J, Hale L.P. B cells in epithelial and perivascular compartments of human adult thymus. Hum Pathol. 2001;32:926-934
38. Leprince C, Cohen-Kaminsky S. et al. Thymic B cells from myasthenia gravis patients are activated B cells. Phenotypic and functional analysis. J Immunol. 1990;145:2115-2122
39. Mori S, Inaba M, Sugihara A, Taketani S, Doi H. et al. Presence of B cell progenitors in the thymus. J Immunol. 1997;158:4193-4199
40. Akashi K, Richie L.I, Miyamoto T, Carr W.H, Weissman I.L. B lymphopoiesis in the thymus. J Immunol. 2000;164:5221-5226
41. MacLennan I, Vinuesa C. Dendritic cells, BAFF, and APRIL: innate players in adaptive antibody responses. Immunity. 2002;17:235-238
42. Hanada T, Yoshida H, Kato S, Tanaka K, Masutani K. et al. Suppressor of cytokine signaling-1 is essential for suppressing dendritic cell activation and systemic autoimmunity. Immunity. 2003;19:437-450
43. Mackay F, Browning J.L. BAFF: a fundamental survival factor for B cells. Nat Rev Immunol. 2002;2:465-475
44. Gruver A.L, Hudson L.L, Sempowski G.D. Immunosenescence of ageing. J Pathol. 2007;211:144-156
45. Capri M, Monti D, Salvioli S, Lescai F, Pierini M. et al. Complexity of anti-immunosenescence strategies in humans. Artif Organs. 2006;30:730-742
46. Vier J, Gerhard M, Wagner H, Hacker G. Enhancement of death-receptor induced caspase-8-activation in the death-inducing signalling complex by uncoupling of oxidative phosphorylation. Mol Immunol. 2004;40:661-670
47. Perl A, Nagy G, Gergely P, Puskas F, Qian Y. et al. Apoptosis and mitochondrial dysfunction in lymphocytes of patients with systemic lupus erythematosus. Methods Mol Med. 2004;102:87-114
48. Gramaglia D, Gentile A, Battaglia M, Ranzato L, Petronilli V. et al. Apoptosis to necrosis switching downstream of apoptosome formation requires inhibition of both glycolysis and oxidative phosphorylation in a BCL-X(L)- and PKB/AKT-independent fashion. Cell Death Differ. 2004;11:342-353
49. Bustamante J, Bersier G, Romero M, Badin R.A, Boveris A. Nitric oxide production and mitochondrial dysfunction during rat thymocyte apoptosis. Arch Biochem Biophys. 2000;376:239-247
50. Wofford J.A, Wieman H.L, Jacobs S.R, Zhao Y, Rathmell J.C. IL-7 promotes Glut1 trafficking and glucose uptake via STAT5-mediated activation of Akt to support T-cell survival. Blood. 2008;111:2101-2111
51. Caravatta L, Sancilio S, di Giacomo V, Rana R, Cataldi A. et al. PI3-K/Akt-dependent activation of cAMP-response element-binding (CREB) protein in Jurkat T leukemia cells treated with TRAIL. J Cell Physiol. 2008;214:192-200
52. Sagan D, Mortl S, Muller I, Eckardt-Schupp F, Eichholtz-Wirth H. Enhanced CD95-mediated apoptosis contributes to radiation hypersensitivity of NBS lymphoblasts. Apoptosis. 2007;12:753-767
53. Benson R.J, Hostager B.S, Bishop G.A. Rapid CD40-mediated rescue from CD95-induced apoptosis requires TNFR-associated factor-6 and PI3K. Eur J Immunol. 2006;36:2535-2543
54. Tonomura N, McLaughlin K, Grimm L, Goldsby R.A, Osborne B.A. Glucocorticoid-induced apoptosis of thymocytes: requirement of proteasome-dependent mitochondrial activity. J Immunol. 2003;170:2469-2478
55. Weksler M.E, Goodhardt M. Do age-associated changes in 'physiologic' auto-antibodies contribute to infection, atherosclerosis, and Alzheimer's disease? Exp Gerontol. 2002;37:971-979
56. Kay M. Immunoregulation of cellular life span. Ann N Y Acad Sci. 2005;1057:85-111
57. Boren E, Gershwin M.E. Inflamm-aging: autoimmunity, and the immune-risk phenotype. Autoimmun Rev. 2004;3:401-406
58. Kerkhoff C, Klempt M, Kaever V, Sorg C. The two calcium-binding proteins, S100A8 and S100A9, are involved in the metabolism of arachidonic acid in human neutrophils. J Biol Chem. 1999;274:32672-32679
59. Ryckman C, Robichaud G.A, Roy J, Cantin R, Tremblay M.J. et al. HIV-1 transcription and virus production are both accentuated by the proinflammatory myeloid-related proteins in human CD4+ T lymphocytes. J Immunol. 2002;169:3307-3313
60. Greenlee K.J, Corry D.B, Engler D.A, Matsunami R.K, Tessier P. et al. Proteomic identification of in vivo substrates for matrix metalloproteinases 2 and 9 reveals a mechanism for resolution of inflammation. J Immunol. 2006;177:7312-7321
61. Di Martino C, Basset C, Ogier A, Charpilienne A, Poncet D. et al. Distribution and phenotype of rotavirus-specific B cells induced during the antigen-driven primary response to 2/6 virus-like particles administered by the intrarectal and the intranasal routes. J Leukoc Biol. 2007;82:821-828
62. Dono M, Burgio V.L, Colombo M, Sciacchitano S, Reverberi D. et al. CD5+ B cells with the features of subepithelial B cells found in human tonsils. Eur J Immunol. 2007;37:2138-2147
63. Ferrero I, Anjuere F, Martin P, Martinez del Hoyo G, Fraga M.L. et al. Functional and phenotypic analysis of thymic B cells: role in the induction of T cell negative selection. Eur J Immunol. 1999;29:1598-1609
64. Adkins B, Riley R.L. Auto-antibodies to T-lineage cells in aged mice. Mech Ageing Dev. 1998;103:147-164
Author contact
![]() Correspondence to: Dennis D. Taub, Ph.D., Laboratory of Immunology, National Institute on Aging-Intramural Research Program, National Institutes of Health, 5600 Nathan Shock Drive, Baltimore, MD. 21224, Phone: (410) 558-8159, Fax: (410) 558-8284; Email: taubdnia.nih.gov
Correspondence to: Dennis D. Taub, Ph.D., Laboratory of Immunology, National Institute on Aging-Intramural Research Program, National Institutes of Health, 5600 Nathan Shock Drive, Baltimore, MD. 21224, Phone: (410) 558-8159, Fax: (410) 558-8284; Email: taubdnia.nih.gov