Impact Factor ISSN: 1449-1907

 Global reach, higher impact
Int J Med Sci 2007; 4(5):267-277. doi:10.7150/ijms.4.267 This issue Cite
Research Paper
BioShuttle-mediated Plasmid Transfer
Klaus Braun1, Leonie von Brasch1,6, Ruediger Pipkorn2, Volker Ehemann3, Juergen Jenne4, Herbert Spring5, Juergen Debus6, Bernd Didinger6, Werner Rittgen7, Waldemar Waldeck8 ![]()
1. Division of Molecular Toxicology, German Cancer Research Center, INF 280, D-69120 Heidelberg, Germany
2. Central Section for Peptide Synthesis, German Cancer Research Center, INF 580, D-69120 Heidelberg, Germany
3. Institute of Pathology, University of Heidelberg, INF 220, D-69120 Heidelberg, Germany
4. Clinical Cooperation Unit Radiation Oncology, German Cancer Research Center, INF 280, D-69120 Heidelberg, Germany
5. Department of Cell Biology, German Cancer Research Center, INF 280, D-69120 Heidelberg, Germany
6. Radiation Oncology, University of Heidelberg, INF 500, D-69120 Heidelberg, Germany
7. Division Biostatistics, German Cancer Research Center, INF 280, D-69120 Heidelberg, Germany
8. Division Biophysics of Macromolecules, German Cancer Research Center, INF 580, D-69120 Heidelberg, Germany
Received 2007-8-8; Accepted 2007-10-26; Published 2007-10-30
Abstract
An efficient gene transfer into target tissues and cells is needed for safe and effective treatment of genetic diseases like cancer. In this paper, we describe the development of a transport system and show its ability for transporting plasmids. This non-viral peptide-based BioShuttle-mediated transfer system consists of a nuclear localization address sequence realizing the delivery of the plasmid phNIS-IRES-EGFP coding for two independent reporter genes into nuclei of HeLa cells. The quantification of the transfer efficiency was achieved by measurements of the sodium iodide symporter activity. EGFP gene expression was measured with Confocal Laser Scanning Microscopy and quantified with biostatistical methods by analysis of the frequency of the amplitude distribution in the CLSM images. The results demonstrate that the “BioShuttle”-Technology is an appropriate tool for an effective transfer of genetic material carried by a plasmid.
Keywords: Quantification of gene transfer, non-viral vectors, nucleus-addressed delivery, gene targeting
1. Introduction
'Cancer' and its initiation can be described as a 'genetic accident'. At present, more than 200 genes are known to play a role in the generation of cancer [1]. At least some of these genes are promising candidates for genetic interventions [2]. The treatment of genetic diseases (hereditary and metabolic diseases, cancer) means to introduce one or more therapeutic genes into the target cells, which are able to compensate a genetic malfunction [3]. In this context, genetic therapy approaches provide the potential to repair genetic diseases, but are limited by a poor efficiency and a lack of therapeutic safety of the commonly used delivery systems [4]. The most important steps for the efficient transport of therapeutic genetic material into the cell nucleus of the target cells are the rapid transport across the plasma membrane into the cytosol and the direct passage through the nuclear envelope into the nucleus. Numerous delivery systems have been developed to overcome these barriers, such as: viral vectors containing plasmids with genes of interest [5], physical methods such as ultrasound to facilitate the delivery of therapeutic genetic agents across cell membranes [6], and non-viral peptide-based carrier systems, based on lipids and/or cationic polymers which are taken up by cellular mechanisms in different cell lines as reviewed [7].
Until now, the transport of genetic material across the cell membrane into the cytoplasm has been addressed, but not it's further delivery into the cell nucleus. Because only the DNA reaching the nucleus can be actively transcribed, our approach is to transport DNA through cell barriers into the nucleus using a Clamp-PNA-BioShuttle as carrier. It consists of modules for the transport across the cell membrane, a module for the cell nucleus transport and a hybridization-site including two identical chains of cysteine spacers connected to peptide nucleic acids acting as clutch for the phNIS-IRES-EGFP plasmid coding for two reporter genes. We show the GFP distribution and quantitation of reporter genes in cells after lipid-mediated transfection in comparison to cells treated with Clamp-PNA-BioShuttle-phNIS-IRES-EGFP and outline the activity of the sodium iodide symporter (hNIS) [8].
2. Material and Methods
Cell culture
The human cervix carcinoma cell line HeLa was obtained from the DKFZ-Tumorbank. Monolayer cultures of HeLa cells were cultured in RPMI 1640 medium supplemented with 10% (vol/vol) FBS and 2 mM L-glutamine (GIBCO BRL) in a 5% CO2 atmosphere at 37°C temperature to a density of near 1 × 10⁶ cells per ml. The medium was refreshed 24 hours before the DNA transfer procedures.
Creation of the plasmid phNIS-IRES-EGFP with two reporter genes
A bi-cistronic vector was built by a combination of two reporter genes. The pIRES2-EGFP vector (BD Bioscience, Clontech) was used as basic plasmid. The human Sodium-Iodide-Symporter gene (hNIS) (DKFZ-division of Nuclear Medicine) was inserted into the MCS of the pIRES2-EGFP plasmid. The resulting recombined vector was the phNIS-IRES-EGFP which possesses a common CMV promotor followed by the hNIS gene, the Internal Ribosome Entry Site (IRES) and the gene encoding the Enhanced Green Fluorescent Proteins (EGFP).
Chemical synthesis of the Clamp-PNA-BioShuttle
The complementary PNA-sequences for hybridization to the different ORI-target sequences of the phNIS-IRES-EGFP were identified. The syntheses of both - peptide modules and the PNA were carried out by Solid Phase Peptide Synthesis (SPPS) in a fully automated synthesizer Syro II (Multi SynTech, Germany). For PNA synthesis, we used fluorenylmethoxycarbonyl (Fmoc)-protected monomers with the exocyclic amino groups of A, G, and C bases blocked by a benzhydroxyl (Bhoc) group. Sequences of single modules as well as the complete modular construct were characterized with analytical HPLC (Shimadzu LC-10, Japan) and laser desorption mass spectrometry (Finnigan Vision 2000, England) showing over 90% purity of the products. Myristic acid was coupled with tetramethylfluoroformamidium-hexafluorophosphate (TFFH) in dimethylformamide/ dichloromethane for one hour at the N terminus of PNA. Cysteine groups were attached via one of the COOH-terminal lysine residue of pAntp(43–58)–Cys and at the NH2-terminus of (NLS[SV40-T]). Molecules were oxidized in an aqueous solution of 2mg/ml in 20% DMSO for about five hours. The oxidation progress was monitored by analytical C18 reverse-phase HPLC. Peptide nucleic acids as well as the address peptide (NLS) carried one lysine-lysine spacer at the COOH terminus, which enabled linkage of peptide nucleic acids with identical sequence via a succinimidyl ester in a molar ratio of 1:1.
Modules of the Clamp-PNA-BioShuttle
The Clamp-PNA-BioShuttle consists of the following modules (figure 1):
Chemical structure of Clamp-PNA-BioShuttle phNIS-IRES-EGFP. The transport molecule consists of: A. Amphiphilic transmembrane transport module responsible for the transport across outer cellular membranes into the cytoplasm. B. Address sequence peptide which potentiates the active transport of cargos into cell nuclei using RAN-mediated mechanisms. C. Hybridization-site harbouring two identical PNA-sequences against ORI-sequences of the phNIS-IRES-EGFP, connected with lysine via a duplex glycine spacer.
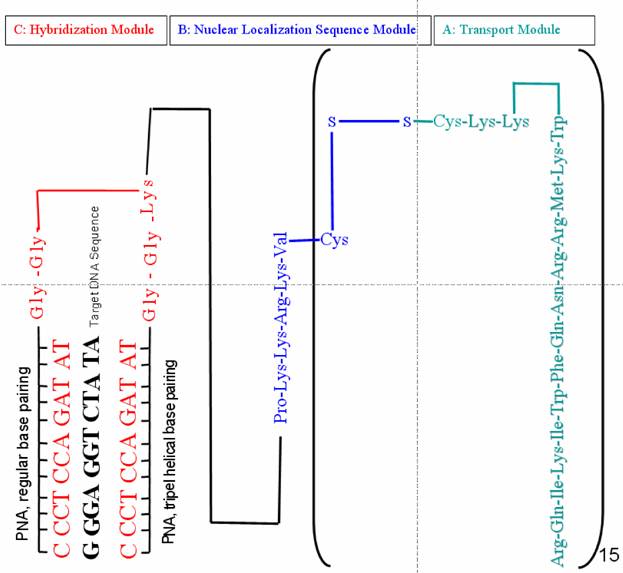
A. Transmembrane transport unit as mediator of the transport across outer membranes.
B. Mediator of the cellular compartment (nucleus) addressed transport.
C. Hybridization-site harbouring two identical PNA-sequences connected with lysine via a duplex glycine spacer.
Hybridization of the phNIS-IRES-EGFP and the Clamp-BioShuttle transporter
The hybridization of the Clamp-PNA-BioShuttle with the phNIS-IRES-EGFP was performed according to the procedure of R.J. Britten and D.E. Kohne [9]. Therefore plasmid DNA was dissolved in TRIS-HCl (0.05 M; pH 6.8) and the BioShuttle-PNA (1mg/ml) was added in a 1:1 ratio and heated in a water bath to 56°C over 10 minutes. The careful tempering to room temperature allows a gentle annealing of the PNA to DNA. The strong affinity of PNA to DNA allows the hybridization reaction of the Clamp-BioShuttle with the phNIS-IRES-EGFP liquid in reaction tubes. Subsequently the hybridized conjugate was directly applied to the cell culture without removing the medium.
BioShuttle-mediated DNA transfer
HeLa cervix carcinoma cells were incubated in 6-well plates (Falcon) with the Clamp-PNA-BioShuttle over 60 minutes (final concentration was 20 nM) at 37°C and 5% CO2 atmosphere. Figure 1 represents the modular structure of the Clamp-PNA-BioShuttle-phNIS-IRES-EGFP and the two sequence specific binding sites (called ORI and ORI 2). ORI 1 and ORI 2 represent sequences complementary to the DNA in the plasmid origin region as depicted in figure 1. The two (ORI 1 and ORI 2) Clamp-PNA-BioShuttle-phNIS-IRES-EGFP complexes were dissolved in water to establish a stock solution (1mg/ml). In the following transfer 100 µl stock solution was diluted with 900 µl water. For gene transfer experiments we used 0.5 µl solution/ µg plasmid DNA.
Lipid-mediated DNA transfection
The preparation of the plasmid DNA was carried out according to the manufactures protocol (Macherey-Nagel, Germany). Before transfection 3 µg phNIS-IRES-EGFP and 7 µl LipofectAmin®2000TM (Invitrogen, Karlsbad) were incubated in 350 µl serum-free RPMI over 30 minutes.
HeLa monolayer cells, 106 per ml, were 80-90% confluent after 24 hours. Cells were washed twofold with Hanks before application of the 700µl LipofectAmin®2000TM-phNIS-IRES-EGFP mix. HeLa cells were transfected and incubated at 37°C without addition of medium. After 1 hour we added the culture medium and investigated the cells at 24, 48, and 72 hours.
Flow cytometry studies of cell mortality
After hybridization of the phNIS-IRES-EGFP and the Clamp-PNA-BioShuttle transporter, the analysis was performed in a FACS Calibur flow cytometer (Becton Dickinson Cytometry Systems, San Jose, (CA) equipped with an argon laser (488nm) and a filter combination for propidium iodide. We used the forward scatter and side scatter and the relative fluorescence intensity of propidium iodide stained native cells on FL-2 channel in a logarithmic scale (Cell Quest, Becton Dickinson). Dead cells are positive for propidium iodide and stained red, living cells remain unstained. The positions in a logarithmic histogram are in the first two decades (102) for unstained cells, red stained dead cells are placed in the fourth decade (103).
Iodide-125 uptake studies
Incubation procedures and uptake kinetics studies with iodide-125 were carried out in accordance to the instructions published by Haberkorn et al. in 2001 [10].
Confocal Laser Scanning Microscopy
The intracellular distribution of the EGFP protein was compared after transfer of the Clamp-PNA-BioShuttle-phNIS-IRES-EGFP and after transfection by LipofectAmin® into HeLa cells by a Zeiss confocal laser scanning microscope (LSM 510-Meta). For excitation, we used the laser line at 488 nm and the corresponding filter barrier for measuring the emission. Simultaneously with the fluorescence images, images in transmitted light in phase contrast or differential interference contrast (DIC) were taken also.
As a control we used untreated cells as well as cells treated with the Clamp-PNA-BioShuttle without plasmid DNA and phNIS-IRES-EGFP without Clamp-PNA-BioShuttle. All measurements were carried out as triplicate.
Parameters of the image acquisition were adapted to show the signal intensities in accordance with the visual microscopic image aspect. The numeric values of the frequencies of signal intensities were used for quantitative evaluation.
Quantitative evaluation
The counts (frequency) of signal intensities in the observed standard areas seem to follow an exponential law of the form y=eax+b. Therefore we took (natural) logarithms of these values and fitted a straight line by linear regression methods, providing us with the parameters a and b.
We measured the intensity in the range from 1992 to 4072 frequencies subdivided in intervals of length 16 giving a total number of 130 intervals. Then we identified these intervals with their midpoints, e.g. 2000, 2016 up to 4064. As raw data we measured the midpoints of the intervals and the sum of counts within these intervals. The total number of counts for 47× were 134831 and for 48× 50509, respectively, which is sufficient for the quantification and statistical analysis.
3. Results
The central question of this work was to find out whether functional genes (plasmid) can be efficiently transferred by the BioShuttle-transport system and whether they are transcribed and translated correctly.
This should be achieved in two steps. (I) Measurement of DNA transfer into cells with help of the reporter gene EGFP. (II) Quantitation of the transferred DNA-function with help of the sodium iodide symporter (hNIS) system, based on the cellular uptake of iodide-125 by the cells and by quantitation of the EGFP expression.
The plasmid construct was not designed to create a fusion peptide. We used a bi-cistronic plasmid with a second internal ribosomal entry site (IRES) to create two independently translated proteins. The cellular iodide-125 uptake correlates with both the sodium iodide symporter (hNIS) expression and with the EGFP-expression.
Display of the junction site
In order to examine the hybridization of the Clamp-PNA-BioShuttle to phNIS-IRES-EGFP, a gel electrophoresis was carried out (data not shown). As hybridization sites two different prokaryotic 'origin of replication' sequences (ORI) were investigated. The combined Clamp-PNA-BioShuttle together with the plasmid was digested with restriction enzymes.
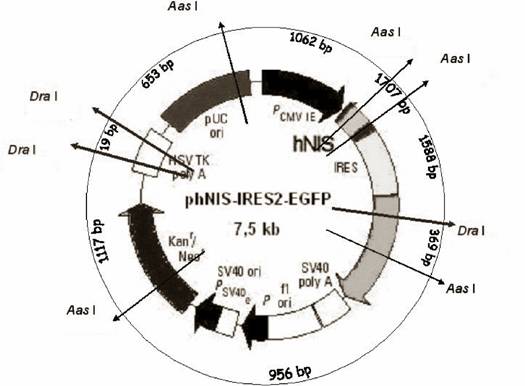
After digestion of the plasmid phNIS-IRES-EGFP with Aas I and Dra I the following fragments were expected (kb scale) 1062--1707--1588--369--956--1117--19--653, which were arranged in the agarose gel: 1707--1588--1117--1062--956--(369)--(19). The digest of the phNIS-IRES-EGFP is schematized in figure 2 and in table 1.
Physical map of phNIS-IRES-EGFP. The inner circle of the map shows functional units. The outer circle represents the map units of the restriction sites. The bp positions represent the restrictions sites of the enzymes Aas 1 and Dra 1 respectively.
Schematic display of the Aas I and Dra I digestion of phNIS-IRES-EGFP. The table summarizes the size of the plasmid DNA fragments of the phNIS-IRES-EGFP and its transport form Clamp-PNA-BioShuttle-phNIS-IRES-EGFP after cleavage with restriction enzymes Aas I and Dra I.
| phNIS -IRES-EGFP | BioShuttle-phNIS-IRES-EGFP | ||||
|---|---|---|---|---|---|
| expected fragments | calculated fragments | fragments after digestion with DraI and AasI | expected fragments | calculated fragments | fragments after digestion with DraI and AasI |
| 1957 | 1957 = 1588 + 369 | 1957 | 1957 = 1588 + 369 | ||
| 1789 | 1789 = 1117 + 653 + 19 | 1789 | 1789 = 1117 + 653 + 19 | ||
| 1707 | 1707 | 1707 | 1707 | 1707 | 1707 |
| - | 1588 | 1588 | 1588 | 1588 | 1588 |
| 1117 | 1117 | 1117 1136 = 1117 + 19 | 1117/1136 | 1117 | 1117 1136 = 1117 + 19 |
| 1062 | 1062 | 1062 | 1062 | 1062 | 1062 |
| 956 | 956 | 956 | 956 | 956 | 956 |
| 653 | 653 | 653 672 = 653 + 19 | - | 653 + BioShuttle | 653 672 = 653 + 19 + BioShuttle |
| 369 | 369 | 369 | 369 | ||
| 19 | 19 | 19 | 19 | ||
Attempt of evaluation of the DNA-transfer methods using confocal microscopy (CSLM)
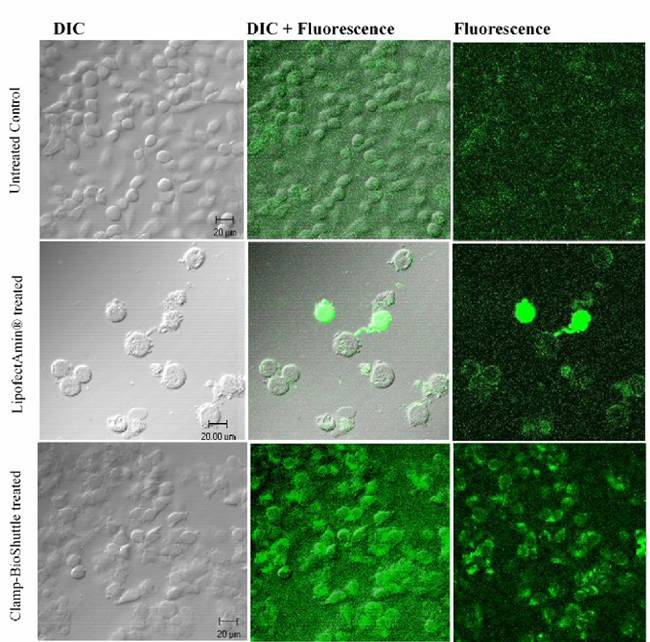
The efficiency of the BioShuttle transport versus lipofection efficiency was compared with help of the reporter gene EGFP. The green fluorescence signals were observed by CLSM in lipofection and BioShuttle treated HeLa cells. Untreated cells were used as a control (figure 3, row 1).
Comparison of cells transfected with LipofectAmin or treated with BioShuttle and control cells. The upper row shows the CLSM Images of the untreated HeLa control cells. A distinct fluorescence signal is not detectable. The middle row exhibits the partial high fluorescence intensity of the LipofectAmin® transfected cells whereas the predominant part of the cells a low fluorescence signal located near the cellular membrane (right). The DIC-exposure (left) shows apoptotic features like Membrane blebbing. The lower row exemplifies the fluorescence signals in HeLa cells after BioShuttle phNIS-IRES-EGFP-transport. In all HeLa cells a nearly homogeneous fluorescence signal could be observed as revealed by merged in the DIC- and fluorescence exposures.
Lipid-mediated DNA transfection
A strong fluorescence signal was found in few HeLa-cells transfected by lipofection while most cells showed a diffuse signal. It was conspicuous that the fluorescence was located close to the cellular membrane. The Differential Interference Contrast (DIC) exposures revealed morphologic changes of the cells, like membrane-blebbing characteristics of apoptosis (figure 3, row 2).
BioShuttle-mediated DNA transfer
The fluorescence signals of cells treated with the BioShuttle-method were completely different from the fluorescence signals of the cells transfected with the lipofection-procedure. There was a clear fluorescence signal in nearly all the cells, with a cytoplasmic signal consistently higher compared to the cell nucleus. The range in the fluorescence intensities is homogeneous (figure 3, row 3), in contrast to the cells treated with the lipofection method. We would like to emphasize, that barely visible morphologic changes of the cell membranes were observed in the cells transfected with the BioShuttle carrier. The fluorescence staining of these cells was very homogenous however some speckles were detected in the nuclear periphery. The transfer efficiency however seems to be very high, (nearly 100%) as opposed to the cells treated with lipofection.
Quantification of the DNA transfer by iodide-125 uptake
The quantitative estimation of the DNA-transfer rate into the cell is the basis for a precise measurement of the efficiency. The human Sodium iodide transporter (phNIS) allows the estimation of the cellular iodide uptake after transcription and translation in the cells and localization on the cell surface. The graph exhibits iodide intensity related to 1000 cells.
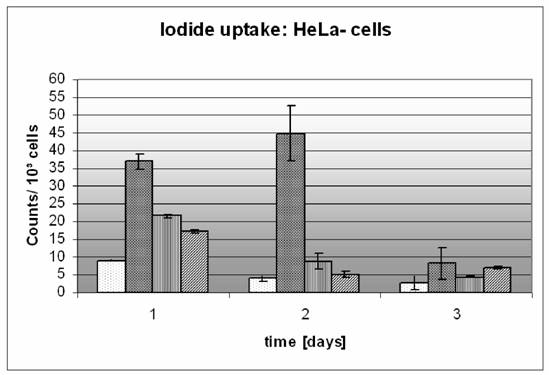
In our experiments we applied the iodide-125 uptake-test in a time course of 72 hours. The intensities of the radioactivity of iodide-125 correlated to the gene transfer rate of the phNIS. The T/2 half-life of iodide-125 was taken in account (figure 4). Generally we treated cells with LipofectAmin® and Clamp-PNA-BioShuttle in parallel dishes. The LipofectAmin® transfected sodium symporter phNIS-IRES-EGFP adsorbs a higher amount of radioactivity 24 hours after DNA-transfer. The signals were 4 times higher as in the control (36 × 103, versus 9 × 10³ counts) 1.5-fold higher as the intensity of the cells treated with the two different transfected Clamp-PNA-BioShuttle sodium symporters (ORI1 22 × 103 and ORI2 18 × 103 counts). 48 hours after lipid-mediated transfection the intensity of the radioactivity has increased 11-fold compared to the control (45 × 103, versus 4 × 10³ counts), whereas the intensities of the Clamp-PNA-BioShuttle treated cells decreased (ORI1 9 × 10³ and ORI2 5 × 10³ counts). 72 hours after LipofectAmin transfection, the radioactive intensities were threefold higher as in the control (8 × 10³, versus 3 × 10³ counts) and close to the same level as in the BioShuttle treated cells (ORI1 4 × 10³ and ORI2 7 × 10³ counts) (figure 4). To exclude the cell specific uptake of the HeLa cells the results were confirmed with rat AT1-cells (data not shown) In parallel the EGFP was used for quantitation of the DNA-transfer into cells.
Time course of iodide uptake mediated by transfection and transport. In cells treated with two different Clamp-PNA-BioShuttle transporters harbouring ORI 1 and ORI 2 phNIS-IRES-EGFP the iodide uptake was measured for a time period of 72 hours. The BioShuttle transport was compared with the LipofectAmin® and with the untreated control cells. Control  LipofectAmin
  ORI 1
ORI 1 ORI 2
ORI 2
Estimation of the cell mortality
Because many of the cells died, especially after treatment with transfection methods, we had to take the mortality into consideration. The assessment of the progress of mortality and fluorescence intensity needs a specific experimental design over 72 hours with identical treatment. Cell mortality was quantified by flow cytometry, which detects membrane-damaged cells stained with propidium iodide (figure 5). The relative fraction of propidium iodide stained cells was estimated.
Measurement of the cellular mortality after plasmid transfer with transport or transfection. The different mortality dependent on the transfer method is demonstrated over a three days time period; the mortality of the transported, transfected and control was compared. A propidium iodide staining was used as indication for dead cells after transfer of the plasmid. The ordinate reveals dead cells [%], the abscissa shows the days after transfer. Control  Sham Control
 LipofectAmin
  ORI 1
ORI 1 ORI 2
ORI 2
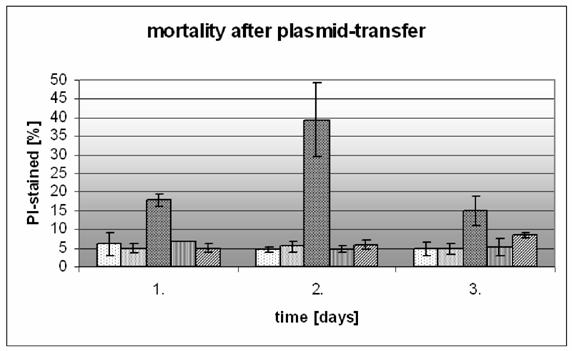
After 24 hours in the untreated control cells (Co) the ratio of dead cells remains constant at 5%. The LipofectAmin® treated cells (lip) showed a rate of 17%, which increased to nearly 40% at 48 hours and decreased to 15% at 72 hours.
The rates of mortality of the cells treated with the Clamp-PNA-BioShuttle phNIS-IRES-EGFP showed similar values like the corresponding controls 24 hours after treatment and ranged between 7% and 5 % depending on the BioShuttle Clamp-Shuttle-variant. The two variants of the Clamp-PNA-BioShuttle phNIS-IRES-EGFP show constant cell mortalities: the ORI1 variant treated cells exhibit 7%, 5%, and 5% mortality, and the ORI2 variant 5%, 6%, and 8% respectively.
Evaluation of the transcription efficiency - quantification
The accurate evaluation of the transcription after Clamp-PNA-BioShuttle phNIS-IRES-EGFP transfer demands new techniques. The CLSM is not only a tool for demonstration of subcellular localizations, but also permits a determination of gene expression by integration of frequencies of the different fluorescence intensities.
Based on a standard-area of 0.0531 mm × 0.0531 mm the distribution of the fluorescence signal intensities in HeLa cells after DNA transfer can be evaluated using the CLSM resulting in a graphical presentation. The abscissas in the picture represent the brightness of the fluorescence intensities, the ordinates their corresponding absolute frequencies (pixel).
Fluorescence Brightness Distribution
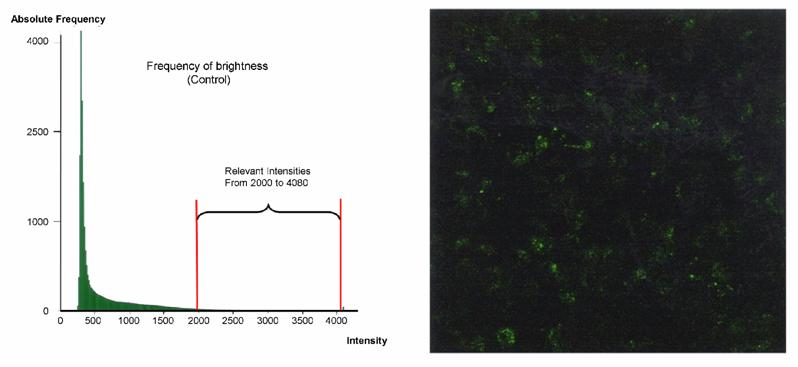
Due to the extreme difference of the fluorescence intensities in the lipofection treated cells, an estimation of intensities is difficult. For this reason we had to develop the following method: an appropriate standard-area serving as a basis for the calculation of frequency and intensity of the signals. In the untreated control (figure 6 a) the mean intensity of brightness constitutes 638 LI (light illuminance). The sum of the number of the frequencies between the intensities of fluorescence (2000 and 4080) amounts an area of 8.81 × 10⁵.
a) Quantification of the DNA transfer and expression with the EGFP reporter gene via CLSM. The histogram (left part) represents the distribution of the brightness of the fluorescence in untreated HeLa control cells. The corresponding standard-area (0.0531 mm × mm) (right part of the figure) demonstrates a diffuse weak fluorescence, - the correlation of frequency and intensity is shown in the histogram which exhibits the relevant fluorescence intensities between 2000 and 4080. The low intensity signals are not used for calculation (0-1999). The integral of the green area correlates to the fluorescence intensity of the standard-area as described above. b) The histogram (left part) represents the distribution of the brightness of the fluorescence in HeLa cells treated with Clamp-PNA-BioShuttle phNIS-IRES-EGFP. The corresponding standard-area (0.0531 mm × mm) (right part of the figure) exhibits clear fluorescence signals in all cells, - the correlation of frequency and intensity is shown in the histogram which exhibits the relevant fluorescence intensities between 2000 and 4080. The low signals (0-1999) are not used for calculation.
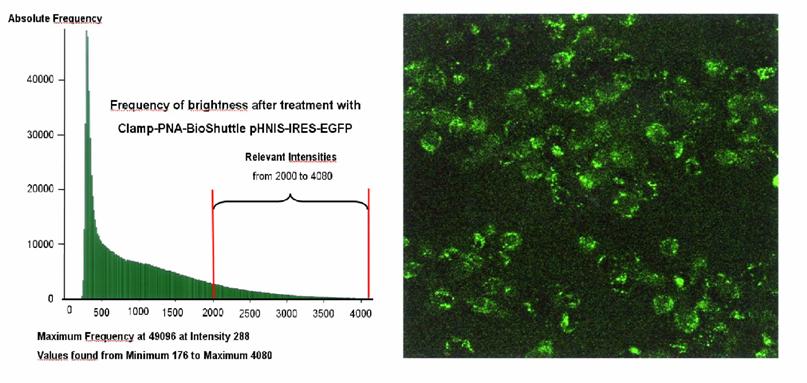
The Clamp-PNA-BioShuttle phNIS-IRES-EGFP treated HeLa cells possessed a medial brightness of 1102 LI. In the histogram of the BioShuttle treated cells, the sum of the number of the frequencies between the fluorescence intensities (2000 and 4080) amounts an area of 22.17 × 10⁵ (figure 6b). Most of the fluorescence signals (maximum frequency) in both samples were detected at mean intensities between 288 and 1999, which were not considered for the semi-quantitative estimation.
Statistical analysis
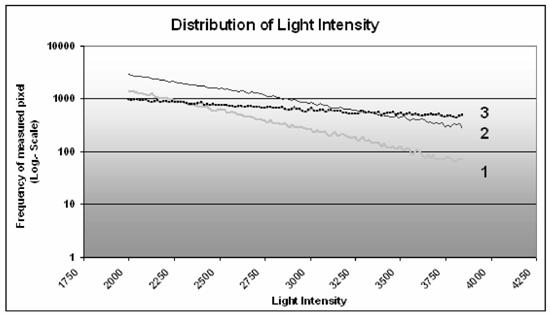
The plot (figure 7) exemplifies the distribution of the light intensity. The cells transfected with the Clamp-PNA-BioShuttle phNIS-IRES-EGFP (2) showed a stronger total fluorescence signal, compared to the control (no interception point) (1). The comparison of the lines of the LipofectAmin-treated cells (3) with the Clamp-PNA-BioShuttle phNIS-IRES-EGFP (2) and the control (1) revealed two interception points at the light intensities 2300 and 3360. Between these two points the frequency of the light intensity in the lipofection treated cells (3) was lower than the corresponding frequency in the Clamp-PNA-BioShuttle phNIS-IRES-EGFP treated cells (2) and higher as in the control cells (1). Above the interception point at 3360 light intensities the lipofected cells (3) showed a higher frequency than the Clamp-PNA-BioShuttle phNIS-IRES-EGFP cells (2). The plot also shows that the observed values in a logarithmic scale are very close to the calculated regression lines [the correlation is -0.9985, -0.9972 and -0.9997, respectively, Clamp-PNA-BioShuttle phNIS-IRES-EGFP (2) and untreated control (1)]. The intercepts b of the equation y=eax+b are quite similar (10.462 and 10.485), whereas the slopes of the two lines are different, a = -0.0012 for untreated control, a = -0.0009 for lipofection (3) and a = -0.0016 for Clamp-PNA-BioShuttle phNIS-IRES-EGFP; the test for equal slopes vs. unequal slopes gave a p-value < 0.000005.
Distribution of light intensities. The graph exhibits both the light intensities of untreated control cells (1) as well as the light intensities of Clamp-PNA-BioShuttle phNIS-IRES-EGFP (2) and LipofectAmin (3) treated HeLa cells in comparison. The ordinate represents the frequency (log. scale). The abscissa shows the relevant light intensities between 2000 and 4080.
4. Discussion
We coupled the BioShuttle carrier with the phNIS-IRES-EGFP plasmid by hybridization to a duplex-complementary peptide nucleic acid (PNA)-sequences [11] connected via a cysteine spacer under clamp-formation for the cell-transfer. To improve the final rate-limiting step of nuclear import we conjugated the BioShuttle carrier harboring the nuclear localization signal (NLS) containing the SV40 sequence [12]. For annealing and transfer of the plasmid the pUC ORI (origin of replication) (figures 1 and 2) served as hybridization site located outside of the coding region. Before the active transport of the DNA into the cell nucleus, the peptide being responsible for the transport across the cell membrane is cleaved off at the cystin-disulfide-brigdes [13]. For the nuclear targeting the BioShuttle carrier uses cell immanent mechanisms like the importin-based transport into the cell nucleus which uses the ran-GDP mechanism and proves to be fast and efficient [14]. The stability of the PNA/DNA hybridization products under physiological conditions is documented [15]. Here PNA is suitable as a sequence-specific clutch for gene transport and therefore serves as an integral part of the BioShuttle delivery platform [13].
Description of the hybridization
Since reporter genes are helpful tools, we have built a peptide vehicle with a PNA clamp to carry our reporter vector. Both components had to be annealed for transduction. As a target site for the hybridization with the BioShuttle we selected the non coding DNA sequence of the ORI region of the plasmid and analyzed the transport vehicle by gel electrophoresis after annealing. The enzymatic digest should lead to a 653 bp DNA fragment which harbors the hybridization site (figure 1; table 1). The expected fragment was detected in the control but not in the hybridized probe. The small size of the fragment with 653 bp and the hybridized PNA result in a low and hardly detectable signal in the agarose gel. The location of the fragment with the hybridized PNA however could not be detected. The molecular weight of the BioShuttle transporter is about 50 000 Daltons, which is believed to influence the shift behavior in the agarose gel. Further parameters, like electrical charge of the PNA/DNA-molecules affecting the shift in mobility and possibly ethidium bromide staining, remain to be explored. The observed alterations of the shift fragment were not completely understood and have to be investigated in further experiments.
Despite the existing intricateness, there are several explanations for a DNA/PNA mobility shift anomaly in the agarose gel:
NMR-spectroscopy data [16] and x-ray crystallography suggest structural changes of the DNA [17]. Due to the fact that sites for restriction enzymes further away (5-10 bp from the PNA binding target) are not affected by the binding to this target, inhibition of the enzymatic cleavage could be excluded [18]. It remains unclear to which extent the reduced binding of the ethidium bromide (gel staining) to the DNA is associated with the PNA-DNA binding in this fragment. The formation of PNA / DNA hybrids could lead to a type of helix termed the P-form, a natural conformation for helices with a PNA backbone [19, 20]. The interaction of ethidium bromide with this conformation is still unclear. Possibly the change of the ethidium bromide /DNA/PNA complex could result in a low signal which is not sufficient for detection and could influence the interpretation of the DNA fragments.
Mechanisms of the DNA-transfer into cytoplasm and nucleus
With the CLSM it is possible to assign the EGFP-fluorescence signals of the reporter gene to their subcellular localization, e.g. cytoplasm or cell nucleus after the DNA transfer with the Clamp-PNA-BioShuttle phNIS-IRES-EGFP (figure 3; row 3), whereas in most of the lipofection treated HeLa cells an increased fluorescence signal located near the cell membrane could be found. Only a few cells exhibit a strong fluorescence signal over the whole cell (figure 3; row 2).
The mechanism of the lipid-mediated transfection requires endocytosis [21]. The efficiency of the lipofection is limited because much of the transfected DNA is retained in endosomes, escapes to the cytoplasm and enters the nucleus at low rates. Additionally the unprotected DNA in the cytoplasm could be degraded by resident cytosolic DNases [22].
In contrast, the mechanism of the BioShuttle-mediated gene transfer remains unclear. At present the peptide-based transport across the cell membrane by formation of inverted micelles finds increasing favor in the scientific discussion. Recent hints suggest that electrical charge influences the transport across the cellular membrane [23].
Quantitative estimation of gene transfer
The bi-cistronic vector of phNIS-IRES-EGFP is characterized by the collective transcription of two genes located in tandem. They are connected by the IRES-sequence, which serves as a second initiation point for the ribosomal translation for two separate proteins [8]. The correlated simultaneous expression of the proteins EGFP and hNIS operates as measuring method for the estimation of hNIS by determination of the cellular uptake of iodide-125. By using the sensitivity of this dual reporter imaging method it could be estimated, that cells transfected with LipofectAmin® possess a higher radioactive intensity compared to the cells which were treated with Clamp-PNA-BioShuttle. After 24 hours of the DNA transfer the iodide-125 signals were 4 times higher than in the control, 1.5-fold higher than the intensity of the cells treated with the Clamp-PNA-BioShuttle phNIS-IRES-EGFP. Only 48 hours after transfection the radioactive intensity is increased 11-fold compared to the control, whereas the intensities of the Clamp-PNA-BioShuttle phNIS-IRES-EGFP treated cells remain unchanged. 72 hours after transfection, the radioactive intensities were threefold higher compared to the control and on the same level as the BioShuttle phNIS-IRES-EGFP treated cells (figure 4). These results suggest that two well-known mechanisms, the sodium iodide symporter (hNIS) and the EGFP both could realize the simultaneous expression. It should be noted that the gene transfer itself is not the only basis for the following gene expression.
Quantitative estimation of gene expression
The use of physical and biomathematical knowledge contributes to a solution for a quantification of gene expression after transfer of phNIS-IRES-EGFP. Previous EGFP experiments with the BioShuttle-mediated gene transfer showed that the microscopic epifluorescence method was not suitable for an examination of the transfection. The accurate evaluation of the efficiency of the transcription after the Clamp-PNA-BioShuttle-mediated phNIS-IRES-EGFP gene transfer demands new techniques like computer-aided microscopy. We could demonstrate that the BioShuttle transferred plasmid resulted in a homogeneous gene expression profile in contrast to the cells transfected with LipofectAmin (figures 6a and 6b). When this is calculated and graphically represented, it permits an objective comparison of the fluorescence intensity and shows a gene expression of about 3-fold.
The quantitative detection of the expression of therapeutic or reporter genes is difficult. Additionally, the different amounts of uptake of genetic material into the target cells and the subsequent different gene expression include a reliable quantification. As showed in figure (figure 7), the comparison of the lines generated by the equations of the numeric values of light intensities and their corresponding frequencies could account for quantification of the intracellular gene expression rate after gene transfer. The biostatistical method used here [24] is able to recognize the cellular distribution of the different gene expression. Further, the method allows the direct comparison of the efficacy of different gene transfer procedures like the Clamp-PNA-BioShuttle phNIS-IRES-EGFP (2) and the lipofection (3). This measurement procedure seems not to be restricted to the quantitative estimation of gene expression only, but every accurate determination of fluorescence intensities is feasible.
Future aspects
New developments of gene delivery systems need new strategies for monitoring the gene transfer efficiency and the controlled gene expression in the target tissue. Monitoring improvements in transfection via confocal laser scanning microscopy (CLSM) and its mathematical evaluation represents a promising solution. An incontrovertible fact is that a universal gene delivery system was not identified yet, but the further optimization of these transport vehicles could result in having a unique application. The dream of the pharmacological science would suddenly become the dream of the functional genomics. In this context the BioShuttle can be considered as a “smuggler” for genetic material into cells. Furthermore, the BioShuttle-targeting system could offer a successful step in the cell type-specific delivery of molecules for intervention by RNAi, aptamers and ribozymes etc. However gene therapeutical approaches still have a long route to go and require the efforts of investigators both in basic and clinical sciences.
Acknowledgements
We are pleased to acknowledge the active support by Jörg Langowski, head of the Department Biophysics of Macromolecules. We also thank Christine Otto and Jochen vom Brocke for carful reading the manuscript.
Conflict of interest
The authors have declared that no conflict of interest exists.
References
1. Alaoui-Jamali MA, Xu YJ. Proteomic technology for biomarker profiling in cancer: an update. J Zhejiang Univ Sci B. 2006;7:411-20
2. Katoh M, Katoh M. Bioinformatics for cancer management in the post-genome era. Technol Cancer Res Treat. 2006;5:169-75
3. Anderson WF. Human gene therapy. Nature. 1998;392:25-30
4. Lotze MT, Kost TA. Viruses as gene delivery vectors: application to gene function, target validation, and assay development. Cancer Gene Ther. 2002;9:692-9
5. Anderson WF. Gene therapy. The best of times, the worst of times. Science. 2000;288:627-9
6. Pitt WG, Husseini GA, Staples BJ. Ultrasonic drug delivery--a general review. Expert Opin Drug Deliv. 2004;1:37-56
7. Braun K, Pipkorn R, Waldeck W. Development and Characterization of Drug Delivery systems for Targeting Mammalian Cells and Tissues: A Review. Curr Med Chem. 2005;12:1841-58
8. Che J, Doubrovin M, Serganova I. et al. hNIS-IRES-eGFP dual reporter gene imaging. Mol Imaging. 2005;4:128-36
9. Britten RJ, Davidson EH. Gene regulation for higher cells: a theory. Science. 1969;165:349-57
10. Haberkorn U, Henze M, Altmann A. et al. Transfer of the human NaI symporter gene enhances iodide uptake in hepatoma cells. J Nucl Med. 2001;42:317-25
11. Jiang T, Olson ES, Nguyen QT. et al. Tumor imaging by means of proteolytic activation of cell-penetrating peptides. Proc Natl Acad Sci U S A. 2004;101:17867-72
12. Nielsen PE, Egholm M, Berg RH. et al. Sequence-selective recognition of DNA by strand displacement with a thymine-substituted polyamide. Science. 1991;254:1497-500
13. Braun K, Peschke P, Pipkorn R. et al. A biological transporter for the delivery of peptide nucleic acids (PNAs) to the nuclear compartment of living cells. J Mol Biol. 2002;318:237-43
14. Gorlich D, Mattaj IW. Nucleocytoplasmic transport. Science. 1996;271:1513-8
15. Nulf CJ, Corey DR. DNA assembly using bis-peptide nucleic acids (bisPNAs). Nucleic Acids Res. 2002;30:2782-9
16. Brown SC, Thomson SA, Veal JM. et al. NMR solution structure of a peptide nucleic acid complexed with RNA. Science. 1994;265:777-80
17. Eriksson M, Nielsen PE. Solution Structure of a Peptide Nucleic-Acid DNA Duplex. NATURE STRUCT BIOLOGY. 1996;3:410-3
18. Nielsen PE, Egholm M, Berg RH. et al. Sequence specific inhibition of DNA restriction enzyme cleavage by PNA. Nucleic Acids Res. 1993;21:197-200
19. Betts L, Josey JA, Veal JM. et al. A nucleic acid triple helix formed by a peptide nucleic acid-DNA complex. Science. 1995;270:1838-41
20. Rasmussen H, Kastrup JS, Nielsen JN. et al. Crystal structure of a peptide nucleic acid (PNA) duplex at 1.7 A resolution [letter]. Nat Struct Biol. 1997;4:98-101
21. Felgner PL, Gadek TR, Holm M. et al. Lipofection: a highly efficient, lipid-mediated DNA-transfection procedure. Proc Natl Acad Sci U S A. 1987;84:7413-7
22. Mehier-Humbert S, Bettinger T, Yan F. et al. Ultrasound-mediated gene delivery: kinetics of plasmid internalization and gene expression. J Control Release. 2005;104:203-11
23. Derossi D, Chassaing G, Prochiantz A. Trojan peptides: the penetratin system for intracellular delivery. Tr Cell Biol. 1998;8:84-7
24. Sheskin DJ. Handbook of parametric and nonparametric statistical procedures / David J. Sheskin - Parametric and nonparametric statistical procedures. Boca Raton: Chapman & Hall /CRC. 2000
Author contact
![]() Correspondence to: Klaus Braun Ph.D., Dep. of Molecular Toxicology, German Cancer Research Center, Im Neuenheimer Feld 280, D-69120 Heidelberg, Germany. Phone: +49 6221 42 2495; Fax: +49 6221 42 3375; E-mail: k.braunde
Correspondence to: Klaus Braun Ph.D., Dep. of Molecular Toxicology, German Cancer Research Center, Im Neuenheimer Feld 280, D-69120 Heidelberg, Germany. Phone: +49 6221 42 2495; Fax: +49 6221 42 3375; E-mail: k.braunde