Impact Factor ISSN: 1449-1907




Int J Med Sci 2026; 23(12):3631-3643. doi:10.7150/ijms.141743 This issue Cite
Research Paper
A WHO-Grade-Derived Meningioma Transcriptomic Program: Cross-Cohort Recurrence Association and Single-Cell Contextualization
Mingyang Li†, Qingyi Huo†, Zhimin Wu, Lixin Huang, Tao Sun, Yibo Zhao, Qingtian Liang, Yunmou Ou, Peixuan Yang, Shunyan Zhu, Yeqing Xie, Chichen Liu, Hui Wang 
Department of Neurosurgery, Third Affiliated Hospital of Sun Yat-Sen University, No. 600th Tianhe Road, Guangzhou 510630, Guangdong, China.
†These authors contributed equally to this work.
Received 2026-7-29; Accepted 2026-9-18; Published 2026-10-16
Abstract
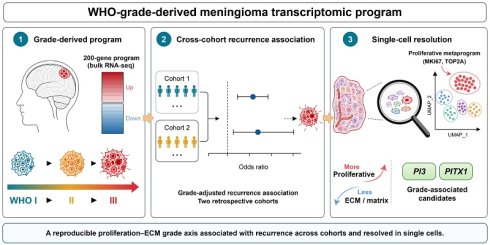
Transcriptomic programs may complement histopathologic grading in meningioma, but their reproducibility across platforms and cellular context remain uncertain. We derived a fixed 200-gene WHO grade I-versus-II program in GSE136661, tested retrospective recurrence associations in GSE16581 and GSE74385 using covariate-adjusted Firth models, and examined the program in two single-cell cohorts. The program was higher in recurrent tumors and retained grade-adjusted associations in GSE16581 (odds ratio per 1-SD increase, 14.74; 95% CI, 2.77-224.07; 10 recurrence events) and GSE74385 after simultaneous grade and batch adjustment (odds ratio, 5.18; 95% CI, 1.40-25.83; 22 events). The wide GSE16581 interval indicates substantial uncertainty in effect magnitude despite directionally stable sensitivity analyses. Component decomposition identified a coordinated proliferation-associated, extracellular-matrix/mesenchymal-down axis, with both the up-regulated and down-regulated components tracking grade. Patient-level tumor/tumor-like-cell pseudobulk scores in GSE206647 reproduced the grade association (Spearman rho=0.87; rho=0.83 after lineage-marker exclusion). Of 159 measurable program genes, 58 reached FDR<0.10 and 56 were directionally concordant with discovery; PI3 (elafin) and PITX1 (a paired-like homeodomain transcription factor) emerged as grade-associated candidates for tissue validation. Patient-resolved non-negative matrix factorization recovered a cell-cycle metaprogram in 6 of 15 eligible tumors; after scoring across all 15 tumors, it was the only positively grade-associated metaprogram surviving multiple-testing correction and remained identifiable across cell-filtering and construction-parameter sensitivity analyses. Together, these findings establish cross-cohort reproducibility and single-cell context for a fixed grade-derived expression axis, demonstrate retrospective recurrence relevance without establishing grade-independent prediction, and prioritize PI3 and PITX1 for orthogonal tissue evaluation. Prospective time-to-event studies using a prespecified, calibrated single-sample assay are warranted to test clinical utility.
Keywords: meningioma, recurrence, WHO grade, single-cell transcriptomics, tumor-cell metaprogram
Introduction
Meningiomas are the most common primary intracranial tumor [1]. Low-grade (WHO grade I) meningiomas are usually managed by resection, but a clinically important minority recur, and histologic grade correlates imperfectly with outcome [2-5]. To improve on histology, several molecular frameworks now estimate recurrence risk: DNA-methylation classification and grading assign tumors to biologically distinct groups that predict outcome beyond WHO grade [3-4], integrated molecular-morphologic grading refines prognostication by combining copy-number, methylation, and histologic features [6-7], and expression-based studies have proposed recurrence signatures, including a program in which loss of DREAM-complex repression and FOXM1-driven proliferation mark aggressive tumors [2,8]. Recent single-cell and spatial resources have further described meningioma cellular heterogeneity and its relationship to progression [4,9-10]. Together, these advances make it possible to test whether a fixed grade-derived expression axis retains outcome relevance across platforms, can be placed within tumor cellular states, and yields candidates suitable for tissue-level follow-up.
Recurrence labels in public cohorts are strongly confounded with grade, which limits estimation of grade-independent recurrence effects and motivates a grade-anchored formulation that preserves recurrence relevance while making grade dependence explicit. Prior recurrence signatures have typically been developed and evaluated within single cohorts or platforms [2,8], leaving unresolved whether a grade-derived expression axis is reproducible across independent arrays and whether it is detectable within tumor/tumor-like cells and robust to lineage-marker exclusion rather than reflecting stromal or immune composition. Whether such a program remains grade-associated at the patient level, and which of its genes behave as tumor-cell candidates, has not been established across independent meningioma datasets.
We therefore defined a fixed grade-anchored transcriptomic program from primary tumors, tested its recurrence association across independent platforms, characterized its biology, and examined its localization across WHO grades at the single-cell level. Patient-resolved metaprogram analysis of lineage-filtered tumor/tumor-like cells was used to identify the cell state most closely associated with the program, and a prespecified cross-modal evidence matrix was used to nominate candidate transcripts. A pretrained single-cell foundation model [11-12] and a classical classifier were evaluated only as secondary benchmarks against classical expression features, not as clinical-prediction or artificial-intelligence claims.
Materials and Methods
Datasets
- GSE136661 — RNA-sequencing data from 160 meningiomas (HTSeq counts; Discovery 97, Validation 48, Recurrence 15; WHO grades I/II/III), reported by Patel et al. [2]. Primary tumors of WHO grades I and II were used for program definition.
- GSE16581 — Microarray data (GPL570) from 68 meningiomas with WHO grade, recurrence status, and survival information. This dataset served as an independent external recurrence-association cohort.
- GSE74385 — 62 meningioma Illumina microarrays (23 non-recurrent, 22 recurrent, 9 malignant progression and 8 grade-III tumors with unknown outcome; WHO I/II/III = 20/14/28; processing batch recorded). The recurrence-only analysis used the 45 non-recurrent or recurrent tumors; the recurrence-or-progression composite sensitivity analysis used all 54 tumors with known outcome; the 8 3NA outcome-unknown samples were excluded throughout. This was an independent recurrence-association cohort (batch-adjusted); the grade-I recurrence subset is fully confounded by processing batch (Table S12) and was used only as hypothesis-generating. Array probes were mapped to gene symbols using the illuminaHumanv4.db annotation package.
- GSE183655 — A meningioma single-cell RNA-sequencing atlas comprising 10 samples (6 tumors, dura, and brain-tumor interface; 63,628 quality-controlled cells), derived from the single-cell component of the Choudhury et al. resource [4].
- GSE206647 — A grade-stratified single-cell RNA-sequencing dataset comprising 16 patient tumors (WHO grades I/II/III, n=8/4/4) and 2 normal meninges (163,897 quality-controlled cells), from the publicly deposited CLU-focused meningioma dataset [9]. This dataset provided independent single-cell reproduction of the grade association.
Detailed cohort characteristics and endpoint-specific inclusion and exclusion rules are provided in Tables S7 and S11.
Grade-associated program
DESeq2 [13] was applied to GSE136661 primary tumors of WHO grades I and II after filtering for genes with counts ≥5 in at least 10 samples. Among genes with |log2 fold change|>1 and adjusted p<0.05, the program comprised the 100 most strongly upregulated and 100 most strongly downregulated genes ranked by adjusted p value (Table S2). The score was calculated as the mean variance-stabilized, gene-wise z-scaled expression of the upregulated genes minus that of the downregulated genes.
Cross-cohort scoring, score definitions, enrichment, classifier
The manuscript uses three distinct scores, which are kept separate throughout. (i) The cohort-standardized composite score is the primary retrospective-association score: within each cohort, program genes present on that platform were gene-wise z-scaled and combined as mean(up)-mean(down). Because standardization is performed within each analyzed cohort, its absolute value depends on the composition of that cohort and it is not a single-sample or between-laboratory score. (ii) A fixed 139-gene score used the identical gene subset measurable on both microarray platforms. (iii) A rank-based single-sample sensitivity score used within-sample ranks of platform-available genes; it is computable on one sample but is a sensitivity analysis, not a calibrated or threshold-validated assay. Cross-cohort scoring was performed after platform-appropriate transformation (including log2 transformation of GSE16581 Affymetrix intensities), maximum-mean probe collapse, and gene-wise z-scaling within each cohort; these support retrospective cohort-level association testing but not single-patient threshold deployment. Prespecified sensitivity analyses also used program sizes of 50, 100, 200, 300 and 500 genes and unconstrained up/down membership. GSEA used clusterProfiler gseGO [14] on the full DESeq2 statistic-ranked gene list. As a proliferation-adjusted enrichment sensitivity analysis, the WHO II-versus-I contrast was recomputed with a per-sample cell-cycle score as a covariate and gseGO re-run. LASSO was fit with glmnet [15] in the common-gene expression space. Internal discrimination was independently audited using 10 repeats of five-fold outer cross-validation, with lambda selection by five-fold inner cross-validation and z-scaling estimated only from each outer-training set. The final discovery-cohort model was applied without external tuning, and pROC [16] was used for external AUCs. Survival analyses used Cox regression and Kaplan-Meier visualization on GSE16581 overall survival. Confounder adjustment: multivariable Cox (OS) and Firth penalized logistic regression [17] (recurrence; rare events, 10/68) in GSE16581 with WHO grade as covariate. Because that estimate rests on 10 events, its stability was assessed by leave-one-recurrence-event-out refitting, 2,000-bootstrap coefficient resampling, profile-likelihood versus Wald intervals, grade-only/program-only/grade-plus-program model comparison, exploratory within-grade summaries, and categorical versus ordinal grade coding (Supplementary Fig. S3 and Table S9). In GSE74385, recurrence, malignant progression and their composite were analyzed separately; all primary Firth models simultaneously included WHO grade and processing batch, coded as factors, and the grade-stratified batch-by-recurrence distribution is reported in Table S12. Bulk deconvolution: MCPcounter [18] was applied to the GSE136661 VST matrix; fibroblast estimates were interpreted with caution given the mesenchymal tumor phenotype. Cell-cell communication: CellChat [19] on GSE183655 was treated as inference of candidate ligand-receptor communication from expression together with prior interaction databases, not as demonstration of signaling.
Single-cell
The single-cell workflow began from the raw per-sample 10x Genomics count matrices deposited in GEO (not from processed author-provided objects). Seurat v5 [20] was used; QC nFeature 200-7,500, percent.mt<20; LogNormalize, 2,000 HVGs, Harmony integration by sample [21], Louvain clustering. Cell types were assigned by canonical markers; putative meningioma/tumor-like cells were identified as non-immune/non-endothelial/non-mural patient-specific mesenchymal cells (consistent with the patient-restricted clustering and mesenchymal marker expression expected of meningioma tumor cells). Program projection used Seurat AddModuleScore with separate up- and down-gene modules and the default expression-bin control-gene procedure (nbin=24, ctrl=100), reported as up-module minus down-module score. For the grade-association test, the two normal meninges were excluded and WHO grade was coded I/II/III as 1/2/3 for Spearman and mixed-model analyses and as a factor for ANOVA. We (i) aggregated tumor/tumor-like cells per patient into pseudobulk (summed counts → CPM → log) and scored the program at the sample level (primary, pseudoreplication-free), and (ii) fit a cell-level linear mixed model (lme4 [22]) with patient as a random intercept and the formula ProgramScore ~ grade_ord + S.Score + G2M.Score + nFeature_RNA + pct_ribo + percent.mt + (1|patient) (the program score is the model response), to confirm the grade association is not explained by cell-cycle state, library complexity, ribosomal/mitochondrial content, or cell-level pseudoreplication. As a malignancy-annotation sensitivity analysis, CopyKAT v1.2.5 [23] was run separately for each of the 16 tumors using up to 1,500 tumor/tumor-like cells and 500 same-patient immune cells as the diploid reference. The fixed program was then recalculated on CopyKAT-aneuploid tumor cells in the same patient-balanced subsample. Because the CopyKAT-aneuploid pseudobulk is a subset of the broader tumor/tumor-like pseudobulk from the same patient, this is a nested sensitivity analysis and not an independent confirmation, and it uses transcriptome-based copy-number inference rather than genomic confirmation.
Lineage-marker exclusion sensitivity analysis and metaprogram analysis
To test the robustness of the single-cell grade association to residual non-tumor admixture, tumor/tumor-like cells were re-filtered using predefined canonical lineage markers chosen independently of the program score. A cell was removed if it expressed at least two markers (log-normalized expression >1) of any non-tumor lineage (T/NK: CD3D, CD3E, CD2, NKG7, GZMK; myeloid: LYZ, C1QA, C1QB, AIF1, TYROBP, LST1, FCER1G; mast: TPSAB1, TPSB2, CPA3, MS4A2; B/plasma: CD79A, MS4A1, MZB1; endothelial: PECAM1, VWF, CLDN5, FLT1; mural: ACTA2, MYH11, RGS5, PDGFRB; glial: PLP1, MBP, MAG, OLIG1, OLIG2, PDGFRA), or if it expressed PTPRC (CD45) above the same threshold. The patient-level program score, gene-level grade associations, and cell-level mixed model were then recomputed in the lineage-filtered cells.
For metaprogram discovery, non-negative matrix factorization [24] was applied per patient to the 2,000 most variable genes of gene-centered, non-negative log-normalized expression across ranks k=4-9, retaining the 50 top-weighted genes from each factor. Programs were clustered across patients by Jaccard similarity using average linkage. Clusters recurring in at least three patients were defined as reproducible metaprograms, each summarized by genes present in at least one-quarter of its member programs. Metaprogram discovery (which patient-specific factors recover a given program) is distinct from subsequent scoring (which computes each reproducible metaprogram's activity across all eligible tumors): the cell-cycle metaprogram was recovered in 6 of 15 patient-specific NMF solutions and then scored across all 15 NMF-eligible tumors. Metaprograms were scored per cell using AddModuleScore and evaluated for patient-level grade association using Spearman correlation with Benjamini-Hochberg correction across metaprograms. Their patient-level correlations with the composite program score were computed across the 15 NMF-eligible patients. Because meningioma tumor cells cluster largely by patient, this cross-patient metaprogram approach, rather than joint clustering, was used to identify shared cell states. The lineage-marker thresholds were heuristic and selected independently of the program genes and scores; this exclusion is a sensitivity analysis rather than a validated separation of tumor from non-tumor cells. A factorial sensitivity analysis varied the NMF rank range (3-8, 4-9, or 5-10), minimum patient recurrence (2, 3, or 4 patients), and clustering cut height (0.85, 0.90, or 0.95; Table S13d). Signature stability was also assessed by Jaccard overlap against a more stringent exploratory exclusion rule.
Component decomposition of the program
To test whether the composite is driven predominantly by its up-regulated (proliferation) half, the 100 up-genes and 100 down-genes were scored separately in the GSE136661 discovery cohort (VST bulk) and in the GSE206647 tumor-cell pseudobulk. For each cohort we report the variance carried by the Up, Down and Composite scores, the WHO-grade association of each component, and the patient-level correlation of each component with the cell-cycle and ECM/mesenchymal metaprograms.
Copy-number context
As complementary biological context, per-patient tumor-cell pseudobulk relative expression was averaged over each chromosome arm and referenced to the two normal-meninges samples, to examine recovery of the broad chromosomal changes characteristic of meningioma (an arm was scored as lost at a relative-dosage threshold below -0.1). This is an expression-inferred dosage proxy computed from the same expression data and annotations; it is not a CopyKAT copy-number reconstruction and is not DNA-based confirmation.
Secondary single-cell foundation-model benchmark
Pretrained Geneformer (V2-104M, gene-corpus 104M) [11] was used in zero-shot mode (no fine-tuning) to embed a grade-balanced subsample of GSE206647 tumor/tumor-like cells (600 cells per WHO grade I/II/III; gene symbols mapped to Ensembl IDs; rank-value tokenization; model_input_size=2048; CPU inference). The analyzed historical embedding had not retained cell and patient identifiers; patients were assigned by a strict one-to-one match on the unique stored program score within grade (1,800/1,800 mappings; maximum absolute difference 9.4×10⁻¹⁷; complete grade agreement). This is a deterministic reconstruction of an existing embedding rather than a new inference, and no primary conclusion depends on it; the corrected workflow now preserves identifiers directly. The primary analysis averaged embeddings within patient before PCA; a complementary analysis performed PCA across cells and then averaged component scores within patient. In both analyses the null distribution of the maximum absolute grade correlation among the top 10 PCs used 100,000 permutations of the 16 patient labels, keeping each patient's cells together. Grade discrimination was evaluated descriptively with repeated nested leave-one-patient-out ridge models; no cell-weighted AUC was calculated, and small-sample discrimination was interpreted using established regression-model validation principles [25]. Patient-level gene prioritization used the prespecified cross-modal evidence matrix rather than foundation-model perturbation scores. This benchmark is reported in the Supplementary Information because of its aggregation-order sensitivity and historical identifier matching.
Patient-level candidate-transcript evidence scoring
Each of the 200 program genes was independently scored using its discovery rank, its patient-level GSE206647 tumor/tumor-like pseudobulk Spearman association with WHO grade (BH-FDR; CPM denominators calculated from the full transcriptome), its tumor-versus-other-cell expression specificity, and its directional concordance in GSE16581/GSE74385, combined into a transparent internal-evidence score kept separate from any druggability claim. Grade association, cellular enrichment, and recurrence evidence were treated as distinct dimensions. An exploratory drug-signature reversal screen of the fixed program against the L1000FWD resource [26] is described in Supplementary Methods; it is treated as hypothesis-generating and is not part of the main-text analysis.
Reproducibility and software environment
Analyses used R (DESeq2, clusterProfiler, glmnet, pROC, logistf, Seurat v5, Harmony, lme4, MCPcounter, CellChat, CopyKAT v1.2.5) and Python (Geneformer V2-104M). Random seeds were set for stochastic steps (NMF, cross-validation, permutation testing, and the Geneformer subsampling). Full package versions and the analysis order are recorded in the public repository (docs/RUN_ORDER.md and session information). Components that were not prospectively version-pinned—principally the original single-cell integration environment and the historical Geneformer embedding—are identified as such rather than reconstructed with unwarranted precision; the numbered scripts released with the paper regenerate the reported values.
A REMARK/STROBE-informed reporting checklist is provided in Table S8.
Cross-cohort gene mapping and leakage control
Each association cohort was scored after platform-appropriate transformation, maximum-mean probe collapse and gene-wise within-cohort z-scaling, then mean(up)-mean(down) over program genes present on that platform; because standardization is within-cohort, absolute scores are not comparable across platforms. GSE16581 retained 142/200 genes and GSE74385 retained 160/200; 25 program entries lack an approved gene symbol and losses are directionally asymmetric. The fixed 139-gene subset measurable on both arrays and within-sample rank scoring of platform-available genes both retained recurrence discrimination in the two cohorts (Supplementary Fig. S2). The dependence of external discrimination on program size in GSE74385 (recurrence-only retrospective AUC rising monotonically from 0.77 at 50 genes to 0.87 at 500 genes; Table S13b) and unconstrained-direction sensitivity analyses were directionally concordant. These checks show that missing-gene asymmetry does not determine the cohort-level association and that the finding is reproducibility of the association across platforms, while rank scoring provides a single-sample-computable sensitivity score rather than a validated threshold. Differences in tissue processing and RNA extraction across the public cohorts could differentially influence transcript classes—for example mitochondrial oxidative-phosphorylation and ribosomal-biogenesis genes relative to core cell-cycle genes—so platform-robustness was assessed against the cell-cycle-anchored core of the program rather than against the metabolic transcripts alone. The LASSO classifier used feature selection inside 10 repeats of five-fold outer cross-validation. Historical cell-level RandomForest and cell-weighted foundation-model estimates were not used for inferential claims; the revised foundation-model comparison used patient-level aggregation and nested leave-one-patient-out evaluation.
Use of AI tools
During manuscript preparation, ChatGPT (OpenAI) and Grammarly were used for English-language editing, grammar, spelling, and style checks. These tools did not autonomously generate data, determine statistical results, or make scientific interpretations. The authors reviewed and verified all code, analyses, figures, and text and take full responsibility for the work.
Results
Cross-cohort discovery and recurrence-association testing
DESeq2 (WHO I vs II, n=116 vs 29) yielded 5,527 DEGs (padj<0.05). The resulting 200-gene program score rose across grade in GSE136661 (WHO I -1.37, II 0.55, III 1.18) and was higher in the recurrence cohort than in primaries. Because the program was defined on the WHO I/II contrast, that comparison is descriptive; WHO III tumors were not used during program definition (Fig. 1A).
Cross-cohort definition and recurrence-association testing of a WHO-grade-associated meningioma transcriptomic program.(A) A 200-gene program was defined from primary tumors in GSE136661 using the WHO grade I versus II contrast and projected into the independent GSE16581 cohort. The WHO I/II separation in GSE136661 is therefore in-sample; WHO III tumors provide held-out extrapolation. (B) In GSE74385, recurrence was analyzed separately from malignant progression. Recurrence-only versus non-recurrent tumors yielded retrospective area under the receiver-operating-characteristic curve (AUC) 0.822 and remained associated after simultaneous adjustment for grade and processing batch (odds ratio [OR] per 1 standard deviation [SD]=5.18, 95% confidence interval [CI] 1.40-25.83, p=0.0118); malignant progression and the batch-confounded grade-I view are reported only in Supplementary Figure S1 and Tables S1 and S12. (C) Gene-set enrichment analysis (GSEA) identified oxidative-phosphorylation and ribosome-biogenesis enrichment with lower synaptic/Wnt programs; this enrichment persisted after cell-cycle adjustment. (D) Grade-adjusted recurrence association across both external bulk cohorts, shown as the Firth penalized-logistic odds ratio per 1 SD of program score (GSE16581, grade-adjusted, OR 14.74, 95% CI 2.77-224.07, based on 10 recurrence events; GSE74385 recurrence-only, grade- and batch-adjusted, OR 5.18, 95% CI 1.40-25.83, 22 events). The wide GSE16581 interval reflects the small number of recurrence events, so the association is directionally consistent but imprecise in magnitude; leave-one-event-out refitting, 2,000-bootstrap coefficient stability, model comparisons and profile-likelihood versus Wald intervals are shown in Supplementary Figure S3 and Table S9. These are retrospective grade-adjusted associations, not calibrated clinical predictions.
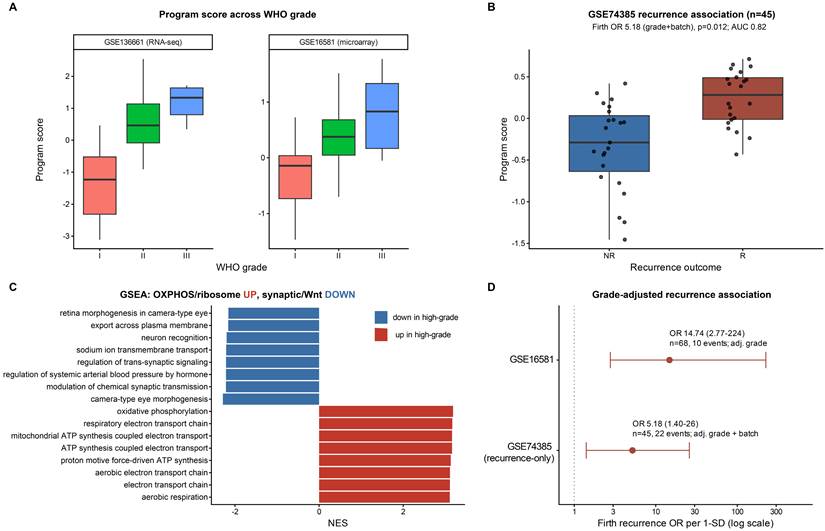
In the independent microarray cohort GSE16581, the program score tracked grade (ANOVA p=1.71×10⁻⁶) and recurrence (nonrecurrent, -0.17; recurrent, 0.99; p=4.78×10⁻⁶). Recurrence events were distributed within grade as 1, 5, and 4 across WHO grades I, II, and III (10 events total; Table S12). High-score tumors showed a nonsignificant trend toward worse overall survival (continuous Cox HR=2.27 per unit score, p=0.10; approximately 10 events). In GSE74385, analyses excluded 8 WHO grade III tumors annotated as 3NA and separated recurrence from malignant progression. Among 45 tumors classified as nonrecurrent (n=23) or recurrent (n=22), the score was higher in recurrent tumors (Wilcoxon p=2.25×10⁻⁴) and remained associated in a Firth model adjusted simultaneously for grade and processing batch (OR per 1-SD increase, 5.18; 95% CI, 1.40-25.83; p=0.0118). The apparent separation within WHO grade I was not interpreted because recurrence and processing batch were fully confounded in that subset (all four grade-I recurrences fell in one batch and all thirteen grade-I non-recurrences in the other; Fig. 1A,B; Supplementary Fig. S1; Tables S1 and S12).
In grade-adjusted Firth models, the score remained associated with recurrence in GSE16581 (10 events/68; OR per 1-SD 14.74, 95% CI 2.77-224.07, p=1.63×10⁻⁴) and in the GSE74385 recurrence-only analysis after adjustment for grade and batch (OR 5.18, 95% CI 1.40-25.83, p=0.0118). Because the GSE16581 estimate rests on only 10 events, we interpret it as a consistent positive association whose magnitude is imprecisely estimated rather than as a clinically calibrated effect size. In GSE74385, malignant progression analyzed separately was weaker in univariable analysis (p=0.12), with an uncertain adjusted estimate (OR 4.18, 95% CI 1.13-35.58). The recurrence-or-progression composite was retained only as a sensitivity endpoint (n=54; adjusted OR 3.20, 95% CI 1.32-9.98) and remained positive after excluding grade III (OR 6.12, 95% CI 1.70-54.52). These estimates describe grade-adjusted associations in small retrospective cohorts; they do not provide a validated clinical threshold or a grade-independent clinical prediction model.
Robustness, biological annotation and classical benchmark
The fixed 139-gene common-platform subset, within-sample rank scoring, programs containing 50-500 genes, and an unconstrained up/down composition all retained directionally concordant recurrence discrimination; exact retrospective AUCs, including the program-size dependence in GSE74385, are reported in the Supplementary Information (Table S13b) rather than repeated in the main text. GSEA on the full ranked gene list showed enrichment of oxidative phosphorylation, aerobic respiration, and electron transport in higher-grade tumors (NES≈3.0-3.2; adjusted p=6.7×10⁻²⁵), together with ribosome-biogenesis enrichment and lower enrichment of synaptic-signaling, Wnt, and cell-junction programs (Fig. 1C; Supplementary Fig. S2). Because these mitochondrial and ribosomal-biogenesis transcripts commonly accompany rapidly dividing cells, we tested whether the enrichment was a cell-cycle artefact by recomputing the grade contrast with a per-sample cell-cycle score as a covariate; the oxidative-phosphorylation and ribosome-biogenesis enrichment persisted (core-term mean NES 2.48→2.67; 14 of 16 core terms remained BH-significant), indicating that it is not explained solely by proliferation. Transcript-level enrichment nonetheless does not by itself indicate increased oxidative flux, so we describe this as enrichment of oxidative-phosphorylation- and ribosome-biogenesis-related transcriptional programs rather than a bioenergetic phenotype.
Separating the program into its up- and down-regulated halves clarified its structure. In the definition cohort, the up-regulated (proliferation) and down-regulated (synaptic/Wnt/ECM-mesenchymal) components tracked grade with comparable strength (Spearman |rho|=0.63 and 0.58, respectively), and the down component carried slightly more variance; in the GSE206647 tumor-cell pseudobulk the up component tracked grade somewhat more strongly than the down component (|rho|=0.88 vs 0.58). At the patient level the summed-count tumor-cell pseudobulk composite correlated with the cell-cycle metaprogram (rho=0.49) but showed larger-magnitude anticorrelations with ECM/mesenchymal metaprograms (rho=-0.63 to -0.68), because the composite subtracts its down component. This rho=0.49 estimate uses the pseudobulk composite in Table S13c; the rho=0.57 estimate reported below uses per-cell AddModuleScore values averaged within patient, as summarized in Table S10. The program is therefore best described as a proliferation-associated, ECM/mesenchymal-down axis—a coordinated shift toward a more proliferative and less differentiated, matrix-associated state—rather than a purely proliferation-driven signature (Tables S10 and S13c).
A secondary 56-gene LASSO benchmark showed retrospective discrimination under repeated nested cross-validation (mean AUC 0.856), but was not treated as a calibrated clinical model. Fig. 1D instead summarizes the grade-adjusted recurrence odds ratios across both external cohorts. The GSE16581 estimate rested on only 10 recurrence events: leave-one-event-out ORs ranged from 10.90 to 18.54, while 2,000 bootstrap coefficients were all positive but yielded a very wide 2.5th-97.5th percentile OR range (4.45-1,419.27). The direction was therefore stable in these resamples, whereas the effect magnitude remained highly imprecise. Categorical and ordinal grade coding gave concordant estimates; event counts, effective model degrees of freedom (4 for GSE16581, 5 for GSE74385; Table S9c), factor coding of grade and batch, exploratory within-grade summaries, model comparisons, and interval-method sensitivity are reported in Supplementary Fig. S3 and Tables S9, S9b and S9c. For GSE74385 the association was likewise robust across parsimonious models (score-only OR 5.23, score-plus-grade OR 5.37, full model OR 5.18) and leave-one-recurrence-event-out refitting (OR range 3.59-9.70).
Against size-matched random and canonical expression signatures, the program exceeded the random null and generic OXPHOS signature in both cohorts; it exceeded a canonical proliferation signature in GSE16581 but not GSE74385 (exact retrospective discrimination estimates are reported in the Supplementary Information). In nested logistic models, adding the program to a proliferation-only model improved recurrence fit in GSE16581 (likelihood-ratio test p=2.7×10⁻⁴), whereas adding proliferation to a program-only model did not (p=0.69); the proliferation-residualized program remained associated with recurrence (p=0.018). Neither direction reached significance in known-outcome GSE74385 (p=0.089 and p=0.061), and its residualized program was non-significant (p=0.12). Thus, the program correlated with proliferation (r≈0.7 in both cohorts) and showed incremental recurrence information beyond proliferation in one cohort but not the other.
Single-cell architecture of meningioma
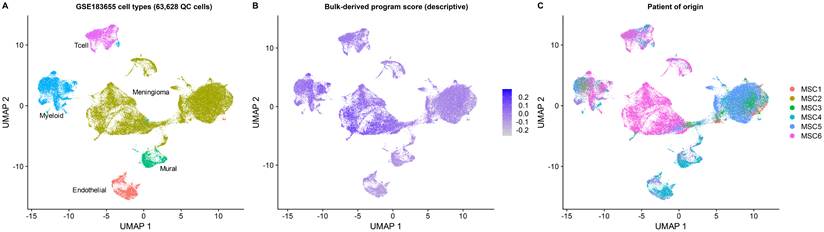
The 63,628-cell atlas (GSE183655) resolved meningioma tumor/tumor-like cells (~67%; patient-specific), myeloid and T-cell immune compartments, and endothelial and mural vascular compartments. The bulk program score was broadly distributed rather than confined to a discrete immune or vascular compartment; this descriptive projection was not used for cell-type-specific inference. Exploratory CellChat analysis inferred candidate secreted-signaling interactions between meningioma cells and endothelial or immune compartments from expression together with prior interaction databases; these are candidate co-expression-based observations rather than demonstrated signaling (Fig. 2).
Single-cell architecture of GSE183655 and compartment-level projection of the program. (A) The GSE183655 meningioma atlas contained 63,628 quality-controlled (QC) cells and resolved patient-specific tumor/tumor-like mesenchymal cells together with myeloid, T-cell, endothelial and mural compartments. Putative meningioma tumor/tumor-like cells were assigned as non-immune, non-endothelial and non-mural patient-specific mesenchymal cells; because copy-number-variation (CNV) confirmation was not performed, the manuscript uses tumor/tumor-like terminology. (B) The bulk-derived program score was broadly distributed and is shown descriptively rather than interpreted as cell-type-specific enrichment. (C) Patient-of-origin patterns are shown as an annotation check. CellChat analyses are presented only as candidate co-expression-based ligand-receptor inferences, not demonstrated signaling.
Patient-level single-cell reproduction of the grade association
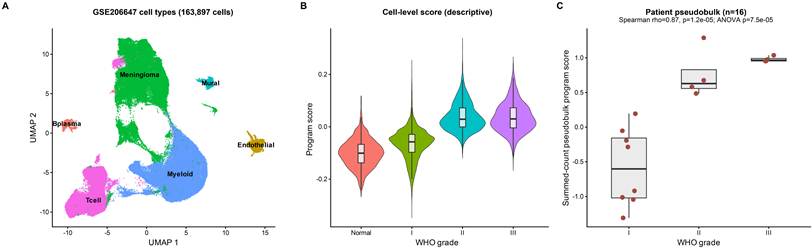
In the grade-stratified cohort GSE206647 (163,897 quality-controlled cells; 16 patient tumors, WHO grades I/II/III, n=8/4/4; plus 2 normal meninges excluded from grade inference), tumor/tumor-like meningioma cells were the dominant compartment (71,717 cells, 44%), alongside myeloid (54,538), T (29,948), endothelial (3,747), B/plasma (2,019), and mural (1,928) cells. Tumor/tumor-like cells were aggregated into per-patient pseudobulk profiles before scoring to avoid cell-level pseudoreplication. The per-patient program score increased with grade (Spearman rho=0.87, p=1.2×10⁻⁵; ANOVA p=7.5×10⁻⁵; Table S3). With only n=8/4/4 tumors across grades, this pattern was driven mainly by the increase from WHO grade I to II, with limited resolution between grades II and III (similar means). In contrast, the bulk program separated WHO grade III from grade II more strongly (Figs. 1A and 3).
Grade-stratified single-cell reproduction of the grade association in GSE206647. (A) The independent grade-stratified GSE206647 cohort contained 163,897 QC cells from 16 grade-labeled tumor patients (WHO grades I/II/III, n=8/4/4) plus 2 normal meninges and resolved 71,717 tumor/tumor-like meningioma cells together with immune and vascular compartments. (B) Cell-level AddModuleScore distributions are shown descriptively and were not used for inference. (C) To avoid cell-level pseudoreplication, tumor/tumor-like cells were aggregated per patient into summed-count pseudobulk profiles before scoring the 200-gene program. The per-patient pseudobulk score rose with WHO grade (Spearman rho=0.87, p=1.2×10⁻⁵; analysis of variance [ANOVA] p=7.5×10⁻⁵), driven mainly by the WHO I to II increase, with limited resolution between grades II and III (n=8/4/4). A cell-level mixed model with patient random intercept retained the grade association after covariate adjustment. In a separate patient-balanced sensitivity analysis, the grade association persisted in CopyKAT-aneuploid pseudobulks from 15 eligible patients (rho=0.868, p=2.71×10⁻⁵; Table S6); because these pseudobulks are nested within the broader tumor/tumor-like pseudobulks, this is a robustness check rather than independent confirmation, and CopyKAT is transcriptome-based CNV inference, not DNA confirmation.
The cell-level grade effect was similar before and after adjustment for S- and G2M-phase scores, detected-gene count and ribosomal/mitochondrial content in a linear mixed model with patient as a random intercept (unadjusted slope 0.051, t=5.9; fully adjusted slope 0.040, t=4.7). Per-cell score was weakly correlated with library size (rho=0.12) and uncorrelated with detected-gene count (rho=0.01). In bulk deconvolution of GSE136661, the endothelial signature decreased with grade (ANOVA p=3.5×10⁻³), which could reflect reduced microvascular content and/or a higher tumor-cell fraction in higher-grade tumors, although deconvolution estimates do not distinguish these possibilities directly; the MCPcounter fibroblast signature was not interpreted as stromal expansion because meningioma tumor cells themselves express mesenchymal markers.
CopyKAT classified cells for all 16 tumors; 15 patients had at least 10 CopyKAT-aneuploid tumor/tumor-like cells, whereas one WHO grade I tumor had none in the balanced subsample. Among the 15 eligible patients, the program remained associated with grade in CopyKAT-aneuploid pseudobulk (rho=0.868, p=2.71×10⁻⁵; ANOVA p=2.43×10⁻⁴). Because the aneuploid pseudobulk is a nested subset of the broader tumor/tumor-like pseudobulk (aneuploid fraction range 0.576-0.983, median≈0.900), its close agreement with the full pseudobulk (rho=0.993, p=2.17×10⁻¹³) is a robustness check rather than an independent confirmation. This sensitivity analysis used transcriptome-based CNV inference rather than genomic confirmation (Fig. 3; Table S6). As complementary expression-dosage context, an expression-inferred chromosome-arm proxy showed lower relative chr22q dosage (below the -0.1 loss threshold) in 13 of 16 tumors and a modestly higher broad autosomal-arm loss burden in higher-grade tumors (Spearman rho=0.40), qualitatively consistent with the canonical meningioma copy-number pattern. Because it uses the same expression data and cell annotations, it is complementary context rather than an orthogonal or DNA-based confirmation (Table S6b).
To reduce the possibility that the grade association reflected differing immune or stromal admixture in the tumor-annotated cells, we excluded cells expressing canonical non-tumor lineage markers (T/NK, myeloid, mast, B/plasma, endothelial, mural and glial), a lineage-marker exclusion sensitivity analysis defined independently of the program genes and scores. Among the 70,251 graded tumor/tumor-like cells this removed 21% (15,070 cells) while retaining all 16 patients (the larger count of 71,717 tumor-annotated cells additionally includes the two normal-meninges samples, which are excluded from grade inference). The primary summed-count pseudobulk grade association was essentially unchanged (Spearman rho 0.87→0.83), as were the gene-level associations (159 measurable genes, 56 at FDR<0.10 of which 55 were directionally consistent with discovery; PI3 rho=0.856, PITX1 rho=0.869), the per-patient AddModuleScore association (rho 0.84→0.82) and the cell-level mixed-model grade slope (0.052 unadjusted, 0.042 fully adjusted; Supplementary Fig. S5A). Because the marker thresholds were heuristic and not externally validated, this analysis reduces but does not eliminate the possibility of residual admixture.
To determine whether the score corresponded to a reproducible tumor-cell program rather than a diffuse gradient, we performed patient-resolved non-negative matrix factorization on lineage-filtered tumor cells (15 of 16 patients met the ≥200-cell threshold) and clustered the resulting programs across patients into reproducible metaprograms. A cell-cycle metaprogram, defined by MKI67, TOP2A, CDK1, TPX2, and BIRC5, was recovered in 6 of these 15 patient-specific solutions and was the only positively grade-associated metaprogram to survive Benjamini-Hochberg correction when scored across the 15 eligible tumors (grade rho=0.68, FDR=0.009); its signature was recovered under a more stringent exclusion rule (Jaccard=0.82; Supplementary Fig. S5B; Tables S10 and S13). An immune-like metaprogram was nominally associated with grade (rho=0.52, p=0.040) but did not survive multiple-testing correction and was sensitive to the exclusion rule. At the patient level, the cell-cycle and immune-like programs correlated similarly with the program score (Spearman rho=0.57 and 0.59, respectively, across the 15 NMF-eligible patients); they were therefore distinguished by multiple-testing significance and cross-filter stability rather than by the magnitude of their score correlations. We could not determine whether the immune-like signal reflected residual admixture, ambient RNA, or a tumor-intrinsic inflammatory state. Together, the grade association and cross-filter signature reproducibility are consistent with a substantial contribution from a proliferative tumor/tumor-like program.
Cross-modal gene-level evidence nominates candidate transcripts
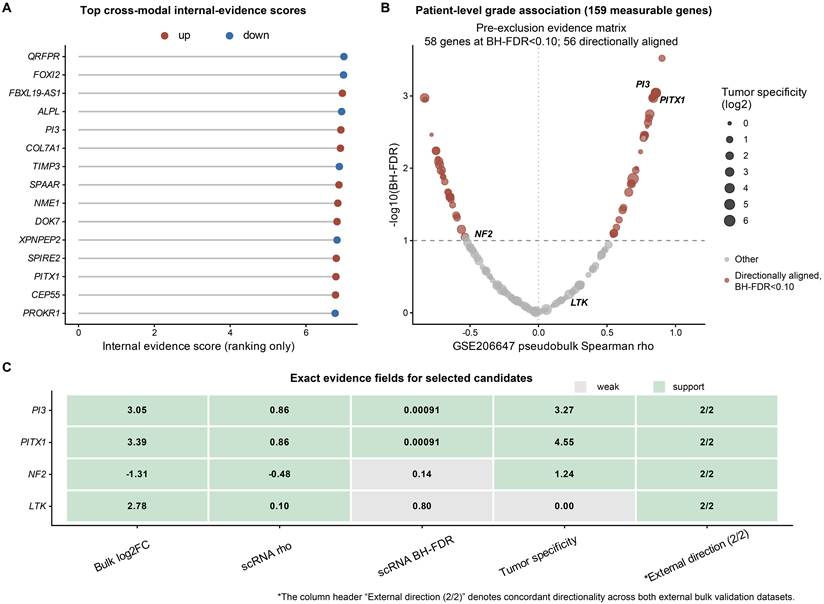
In this prespecified pre-exclusion tumor/tumor-like pseudobulk evidence matrix, 159 of the 200 program genes were measurable in GSE206647. Of the 58 genes that reached FDR<0.10, 56 were directionally consistent with discovery; after lineage-marker exclusion, 56 reached FDR<0.10, of which 55 remained directionally consistent. Treating grade association, cellular enrichment, and recurrence evidence as distinct dimensions, the strongest retained candidates that increased with grade were PI3 (elafin, a secretory peptidase inhibitor; rho=0.86, FDR=9.1×10⁻⁴) and PITX1 (a paired-like homeodomain transcription factor; rho=0.86, FDR=9.1×10⁻⁴). Across the major cell types, 89.6% of PI3 counts arose from the tumor/tumor-like compartment, but PI3 was detected in only 5.7% of tumor cells, so a contribution from ambient RNA or a minor secretory subpopulation cannot be excluded; PITX1 was more broadly detected within tumor cells (96.5% of counts; 19.0% of cells) (Table S5). Both are therefore presented as grade-associated candidate transcripts for orthogonal tissue validation rather than as recurrence or aggressiveness markers. Although NF2 has an established role in meningioma [27], its negative grade correlation did not pass the corrected patient-level threshold (rho=-0.48, FDR=0.14) and reflects transcript abundance rather than NF2 mutation or merlin loss. An anatomical-location analysis was not performed because consistent skull-base versus non-skull-base annotations were not available in the source datasets. LTK showed a weak, nonsignificant patient-level association (rho=0.10, FDR=0.80). An exploratory drug-signature reversal screen found no compound that reproducibly reversed the program across cell lines (Fig. 4; Tables S4 and S5).
Cross-modal prioritization of candidate grade-associated transcripts. (A) Transparent internal-evidence scores integrate discovery rank, patient-level GSE206647 tumor/tumor-like pseudobulk grade association, tumor-cell expression specificity and directional concordance in GSE16581/GSE74385. Scores are ranking aids rather than inferential statistics. (B) In this prespecified pre-exclusion tumor/tumor-like pseudobulk evidence matrix, of the 159 measurable program genes 58 reached Benjamini-Hochberg false-discovery-rate (BH-FDR) <0.10, of which 56 were directionally aligned with discovery (after lineage-marker exclusion, 56 reached BH-FDR<0.10 of which 55 remained directionally aligned; Supplementary Fig. S5). PI3 (elafin) and PITX1 (paired-like homeodomain transcription factor) passed the corrected patient-level threshold; NF2 and LTK are labeled to show, transparently, that neither passed that threshold. (C) Exact evidence fields for these four prespecified genes are displayed without combining them into a druggability claim. The column header “External direction (2/2)” denotes concordant directionality across both external bulk validation datasets. This field indicates directional recovery rather than gene-level recurrence association. These results nominate PI3 and PITX1 as grade-associated candidate transcripts for orthogonal tissue validation, not functional dependencies or validated therapeutic targets.
A supplementary zero-shot Geneformer benchmark showed aggregation-order sensitivity and no stable performance advantage over classical expression features in 16 patients (Supplementary Fig. S4).
Discussion
We characterized a fixed WHO-grade-derived transcriptomic program and evaluated how reproducibly it behaves across independent meningioma cohorts. The program was higher in recurrent tumors and retained a grade-adjusted recurrence association in two small covariate-adjusted retrospective cohorts, its grade association was reproduced at the patient level in an independent single-cell dataset, and a prespecified evidence matrix nominated tumor-cell candidate transcripts. Decomposing the program showed that it captures a coordinated shift toward a more proliferative and less differentiated, matrix-associated state: its up-regulated proliferation half and its down-regulated synaptic/Wnt/ECM-mesenchymal half both track grade, so we describe it as a proliferation-associated, ECM/mesenchymal-down axis. This axis recapitulates, rather than newly discovers, the proliferative biology previously linked to meningioma progression, including the DREAM-complex/FOXM1 program [2,8] and the cell-cycle genes (MKI67, TOP2A, BIRC5) that define aggressive tumors; its contribution is the demonstration that this biology is reproducible across platforms and detectable within tumor/tumor-like cells.
Patient-level single-cell projection reproduced the grade association within tumor/tumor-like cells and showed an increase from WHO I to II with little further increase in WHO III. Lineage-marker exclusion left the grade association essentially unchanged, and patient-resolved metaprogram analysis is consistent with a substantial contribution from a reproducible proliferative program; a nominally grade-associated immune-like program was filter-sensitive and could not be resolved as tumor-intrinsic versus residual admixture. Expression-inferred copy-number context recovered the canonical chromosome-22q loss and a higher broad-loss burden in higher-grade tumors, consistent with meningioma copy-number biology, although this remains expression-inferred rather than genomic. The program's oxidative-phosphorylation and ribosome-biogenesis enrichment persisted after adjustment for cell-cycle signal, indicating that it is not merely a proliferation correlate; we nonetheless interpret it as a transcriptional program rather than evidence of altered oxidative flux, because transcript-level enrichment does not measure metabolism.
The patient-level evidence matrix nominated PI3 and PITX1 as grade-associated candidate transcripts for orthogonal tissue validation, not functional dependencies or drug targets, and their single-cell distribution supports a tumor-cell candidate interpretation pending confirmation. If a targeted multiplex assay for these transcripts is pursued in prospective cohorts, fresh-frozen tissue may provide higher RNA integrity, whereas more routinely available FFPE material will require short-amplicon assay design and analytical validation of transcript detection before any clinical inference. These requirements define future validation needs rather than present clinical applicability. The exploratory drug-signature reversal screen did not identify a compound that reproducibly reversed the program across cell lines; broad cytotoxic hits were deprioritized in light of meningioma stem-like cell resistance [28], and retinoic acid is best regarded as a literature-supported hypothesis based on prior in vitro invasion and adhesion evidence [29] rather than a cross-validated candidate (Table S4). Because these communication and drug-reversal analyses are exploratory, they are reported concisely with fuller detail in the Supplementary Information. Recent matched primary-recurrent single-nucleus profiling has directly characterized longitudinal cellular evolution in meningioma [30]; our contribution is complementary—cross-platform association testing and single-cell contextualization of a fixed grade-derived expression axis rather than discovery of recurrent-cell evolutionary states.
Relative to established molecular tools—DNA-methylation grouping [3-4], integrated molecular-morphologic grading [6-7], and earlier expression recurrence signatures [2,8]—the program is complementary rather than competing: it is a compact grade-derived readout whose association reproduces across two independent bulk cohorts and is detectable within tumor/tumor-like cells. Distinguishing cross-platform reproducibility from clinical transferability is important here. Because the composite is standardized within each cohort, its absolute value depends on cohort composition and it is not a single-sample score; the fixed 139-gene and rank-based analyses show that the association does not depend on platform-specific gene loss but do not provide a common numerical scale, calibration, or threshold. A prespecified single-sample assay, calibration procedure, and prospective time-to-recurrence evaluation would therefore be required before a grade-anchored expression axis could contribute to clinical risk stratification, and the candidate transcripts PI3 and PITX1 warrant orthogonal tissue validation.
Several limitations qualify these findings and are stated once here. The program is defined on the GSE136661 WHO I-versus-II contrast, so its WHO I/II separation in that cohort is in-sample; inferential claims rest on WHO III held-out extrapolation and independent cohorts. Recurrence is grade-confounded, and the public cohorts lack consistent information on extent of resection [31], radiotherapy, Ki-67, histological subtype, molecular class, and follow-up duration, so the models support grade-adjusted retrospective association rather than grade-independent clinical prediction; time-to-recurrence was unavailable, and survival evidence is event-limited and secondary. The GSE16581 recurrence estimate is based on 10 events and is directionally stable but imprecise in magnitude, and malignant progression was analyzed separately and remains exploratory. The single-cell grade-stratified cohort is small (n=8/4/4) with limited resolution between grades II and III; CopyKAT infers copy number from expression in a balanced cell subsample and is not DNA confirmation, one patient lacked an eligible aneuploid pseudobulk, and the chromosome-arm dosage analysis is likewise expression-inferred. The lineage-marker exclusion used heuristic, externally unvalidated thresholds and did not separately model doublets or ambient RNA, so it reduces rather than removes admixture; the metaprogram analysis rested on 15 of 16 patients meeting a cell-count threshold and on NMF rank, clustering-height, and recurrence-frequency choices, and the immune-like program cannot be firmly attributed to tumor cells. The supplementary Geneformer benchmark is restricted to 16 patients, depends on aggregation order, uses an audited deterministic identifier-recovery step, and does not establish superior prediction. All network, in silico, deconvolution, and copy-number-inference evidence is described as candidate or consistent with, not causal.
Abbreviations
WHO: World Health Organization; NMF: non-negative matrix factorization; FDR: false discovery rate; BH: Benjamini-Hochberg; OR: odds ratio; CI: confidence interval; SD: standard deviation; AUC: area under the receiver-operating-characteristic curve; DEG: differentially expressed gene; VST: variance-stabilizing transformation; CPM: counts per million; CNV: copy-number variation; ECM: extracellular matrix; OXPHOS: oxidative phosphorylation; GSEA: gene-set enrichment analysis; NES: normalized enrichment score; scRNA-seq: single-cell RNA sequencing; MP: metaprogram; FM: foundation model.
Supplementary Material
Supplementary figures and tables.

Supplementary tables.
Acknowledgements
The authors thank the investigators who generated and shared the public GEO datasets analyzed in this study.
During manuscript preparation, ChatGPT (OpenAI) and Grammarly were used for English-language editing, grammar, spelling, and style checks. These tools did not autonomously generate data, determine statistical results, or make scientific interpretations. The authors reviewed and verified all code, analyses, figures, and text and take full responsibility for the work.
Funding
This study was supported by the Sun Yat-Sen University Clinical Research 5010 Program (No. 2021001); the “Five and five” Project of the Third Affiliated Hospital of Sun Yat-Sen University (No. 2023WW504); Clinical High and New Technology Projects in Guangzhou (No. 2024P-GX30); and the Guangdong Basic and Applied Basic Research Foundation (No. 2024A1515140177).
Data availability
Public GEO datasets included GSE136661, GSE16581, GSE74385, GSE183655, and GSE206647. The analysis code, lightweight derived tables, and figure files—including the revision analyses and the revised supplementary tables—are publicly available at https://github.com/1210loku-lab/meningioma-aggressiveness-fm (release v1.3.1) and archived at Zenodo (concept DOI: https://doi.org/10.5281/zenodo.21507226, which resolves to the latest archived version). The numbered analysis scripts and their execution order are documented in the repository (docs/RUN_ORDER.md).
Ethics
Not applicable. This study analyzed publicly available, de-identified datasets from the Gene Expression Omnibus (GEO: GSE136661, GSE16581, GSE74385, GSE183655 and GSE206647) and involved no new participant recruitment, intervention, specimen collection, or access to identifiable individual-level data. Ethical approvals and informed-consent procedures for the contributing cohorts are described in their original publications and data-access documentation. The manuscript contains no identifiable individual-level information, images or case details.
Author contributions
M.L., Q.H. and H.W. conceived the study. M.L. and Q.H. curated the data, developed the analysis code, performed the formal analyses and prepared the visualizations. M.L., Q.H., Z.W., L.H., T.S., Y.Z., Q.L., Y.O., P.Y., S.Z., Y.X., C.L. and H.W. interpreted the findings. M.L. and Q.H. drafted the manuscript. H.W. supervised and administered the study. All authors critically reviewed the manuscript and approved the final version.
Competing Interests
The authors have declared that no competing interest exists.
References
1. Ostrom QT, Price M, Neff C. et al. CBTRUS Statistical Report: Primary Brain and Other Central Nervous System Tumors Diagnosed in the United States in 2016-2020. Neuro Oncol. 2023;25:iv1-iv99
2. Patel AJ, Wan YW, Al-Ouran R. et al. Molecular profiling predicts meningioma recurrence and reveals loss of DREAM complex repression in aggressive tumors. Proc Natl Acad Sci USA. 2019;116:21715-21726
3. Sahm F, Schrimpf D, Stichel D. et al. DNA methylation-based classification and grading system for meningioma: a multicentre, retrospective analysis. Lancet Oncol. 2017;18:682-694
4. Choudhury A, Magill ST, Eaton CD. et al. Meningioma DNA methylation groups identify biological drivers and therapeutic vulnerabilities. Nat Genet. 2022;54:649-659
5. Louis DN, Perry A, Wesseling P. et al. The 2021 WHO Classification of Tumors of the Central Nervous System: a summary. Neuro Oncol. 2021;23:1231-1251
6. Nassiri F, Liu J, Patil V. et al. A clinically applicable integrative molecular classification of meningiomas. Nature. 2021;597:119-125
7. Maas SLN, Stichel D, Hielscher T. et al. Integrated Molecular-Morphologic Meningioma Classification: A Multicenter Retrospective Analysis, Retrospectively and Prospectively Validated. J Clin Oncol. 2021;39:3839-3852
8. Vasudevan HN, Braunstein SE, Phillips JJ. et al. Comprehensive Molecular Profiling Identifies FOXM1 as a Key Transcription Factor for Meningioma Proliferation. Cell Rep. 2018;22:3672-3683
9. Ke C, Huang B, Xiang J. et al. Secreted clusterin inhibits tumorigenesis by modulating tumor cells and macrophages in human meningioma. Neuro Oncol. 2024;26:1262-1279
10. Landry AP, Yefet LS, Wang JZ. et al. Spatially resolved single-cell analyses of human meningioma identify novel cell states influencing tumor microenvironment and progression. Nat Genet. 2026;58:1383-1395
11. Theodoris CV, Xiao L, Chopra A. et al. Transfer learning enables predictions in network biology. Nature. 2023;618:616-624
12. Cui H, Wang C, Maan H. et al. scGPT: toward building a foundation model for single-cell multi-omics using generative AI. Nat Methods. 2024;21:1470-1480
13. Love MI, Huber W, Anders S. Moderated estimation of fold change and dispersion for RNA-seq data with DESeq2. Genome Biol. 2014;15:550
14. Yu G, Wang LG, Han Y. et al. clusterProfiler: an R Package for Comparing Biological Themes Among Gene Clusters. OMICS. 2012;16:284-287
15. Friedman J, Hastie T, Tibshirani R. Regularization Paths for Generalized Linear Models via Coordinate Descent. J Stat Softw. 2010;33:1-22
16. Robin X, Turck N, Hainard A. et al. pROC: an open-source package for R and S+ to analyze and compare ROC curves. BMC Bioinformatics. 2011;12:77
17. Heinze G, Schemper M. A solution to the problem of separation in logistic regression. Stat Med. 2002;21:2409-2419
18. Becht E, Giraldo NA, Lacroix L. et al. Estimating the population abundance of tissue-infiltrating immune and stromal cell populations using gene expression. Genome Biol. 2016;17:218
19. Jin S, Guerrero-Juarez CF, Zhang L. et al. Inference and analysis of cell-cell communication using CellChat. Nat Commun. 2021;12:1088
20. Hao Y, Stuart T, Kowalski MH. et al. Dictionary learning for integrative, multimodal and scalable single-cell analysis. Nat Biotechnol. 2024;42:293-304
21. Korsunsky I, Millard N, Fan J. et al. Fast, sensitive and accurate integration of single-cell data with Harmony. Nat Methods. 2019;16:1289-1296
22. Bates D, Mächler M, Bolker B. et al. Fitting linear mixed-effects models using lme4. J Stat Softw. 2015;67:1-48
23. Gao R, Bai S, Henderson YC. et al. Delineating copy number and clonal substructure in human tumors from single-cell transcriptomes. Nat Biotechnol. 2021;39:599-608
24. Gavish A, Tyler M, Greenwald AC. et al. Hallmarks of transcriptional intratumour heterogeneity across a thousand tumours. Nature. 2023;618:598-606
25. Harrell FE Jr. Regression Modeling Strategies: With Applications to Linear Models, Logistic and Ordinal Regression, and Survival Analysis. 2nd ed. New York: Springer. 2015
26. Wang Z, Lachmann A, Keenan AB. et al. L1000FWD: fireworks visualization of drug-induced transcriptomic signatures. Bioinformatics. 2018;34:2150-2152
27. Clark VE, Erson-Omay EZ, Serin A. et al. Genomic analysis of non-NF2 meningiomas reveals mutations in TRAF7, KLF4, AKT1, and SMO. Science. 2013;339:1077-1080
28. Khan I, Baeesa S, Bangash M. et al. Pleomorphism and drug resistant cancer stem cells are characteristic of aggressive primary meningioma cell lines. Cancer Cell Int. 2017;17:72
29. Pereda MP, Hopfner U, Pagotto U. et al. Retinoic acid stimulates meningioma cell adhesion to the extracellular matrix and inhibits invasion. Br J Cancer. 1999;81:381-386
30. Lee JY, Lee EJ, Seo BY. et al. Single-cell analysis reveals a longitudinal trajectory of meningioma evolution and heterogeneity. Nat Commun. 2025;16:5481
31. Behling F, Fodi C, Hoffmann E. et al. The role of Simpson grading in meningiomas after integration of the updated WHO classification and adjuvant radiotherapy. Neurosurg Rev. 2021;44:2329-2336
Author contact
Corresponding author: Hui Wang, Department of Neurosurgery, Third Affiliated Hospital of Sun Yat-Sen University, No. 600th Tianhe Road, Guangzhou 510630, Guangdong, China. Email: wangh22sysu.edu.cn. Telephone: +86 13763322020.