Impact Factor ISSN: 1449-1907




Int J Med Sci 2026; 23(12):3574-3584. doi:10.7150/ijms.139617 This issue Cite
Research Paper
Muscle-Related Parameters and Sarcopenia According to Hearing-Loss Severity and Hearing-Aid Use
Yoon Ah Ko, MD1, Minju Baek, MD2, Sang-Yoon Han, MD, PhD2 
1. Department of Otolaryngology-Head and Neck Surgery, Seoul National University College of Medicine, Seoul, Republic of Korea.
2. Department of Otolaryngology-Head and Neck Surgery, College of Medicine, Hanyang University, Seoul, Republic of Korea.
Received 2026-6-21; Accepted 2026-9-23; Published 2026-10-9
Abstract
Objectives: Hearing loss is linked to various functional deficits, while its relationships with fat distribution and sarcopenia remain unclear. This study investigated the association of hearing status with body composition and muscle-related parameters.
Materials and Methods: This study used data from the ninth Korea National Health and Nutrition Examination Survey (2022-2023), a nationally representative survey. A total of 3,632 individuals with complete data on audiometry, tympanometry, body composition, and handgrip strength were included. Hearing status was classified as normal (≤ 25 dB), mild (> 25 dB to ≤ 40 dB), or moderate-or-worse (> 40 dB). Sarcopenia was defined as low Appendicular Skeletal Muscle Mass Index (ASMI; < 7.0 kg/m² for men, < 5.7 kg/m² for women) combined with low handgrip strength (< 28 kg for men, < 18 kg for women).
Results: Compared with normal hearing, moderate-or-worse hearing loss was associated with lower ASMI in the lower extremities and lower total ASMI and handgrip strength in both sexes; upper-extremity ASMI and body-water indices were lower only in men (all p < 0.05). Higher hearing thresholds were associated with sarcopenia in both sexes (men: p = 0.020; women: p = 0.013), and this association remained consistent among participants aged ≥65 years. In the subgroup analysis, women with hearing thresholds > 55 dB who used hearing aids had higher handgrip strength than non-users (19.95 ± 0.76 vs. 17.46 ± 0.54 kg; p = 0.0096).
Conclusions: Hearing loss may be associated with muscle-related parameters and sarcopenia. Considering this association, appropriate evaluation and intervention for sarcopenia may be warranted in this population.
Keywords: hearing loss, sarcopenia, skeletal muscle mass, handgrip strength, body composition, bioelectrical impedance analysis, hearing aids
Introduction
Hearing loss is one of the most common sensory disorders [1], and age-related hearing loss is the most common form [2], with its prevalence increasing with advancing age [3]. Consequently, hearing loss is increasingly recognized as an important public health issue in aging societies [4]. In Korea, 19.45% of adults aged ≥ 40 years have hearing impairment, affecting nearly two-thirds of those in their 70s [5].
Hearing loss compromises communication, cognitive function, social engagement, and quality of life [6, 7]. It is also linked to physical impairments, including gait disturbance and increased fall risk [8-10], which contribute to loss of independence and disability in later life. These functional deficits tend to progress with advancing age [11]. Therefore, identifying modifiable conditions associated with hearing loss is necessary to preserve quality of life in older adults. Given that reduced physical activity alters body composition [12], hearing loss may also be linked to obesity or sarcopenia.
Recent studies have indicated a potential association between hearing loss and obesity [13-15]. Furthermore, previous studies have reported associations between lower appendicular muscle mass, reduced handgrip strength, and hearing impairment [16-18].
However, most of the prior studies have focused on DXA-derived muscle mass indices (e.g., appendicular skeletal muscle mass), with limited investigation of muscle quality, fat infiltration, or comprehensive segmental body composition [16, 17]. Furthermore, the relationship between hearing rehabilitation and muscle mass or muscle strength has not been adequately characterized.
Building on this background, the present study uses a large, nationally representative database to investigate how bioelectrical impedance analysis (BIA)-derived segmental body composition and muscle strength differ according to the severity of hearing loss and hearing aid use.
Materials and Methods
Study database
This cross-sectional study used data from the ninth Korea National Health and Nutrition Examination Survey (KNHANES) collected during 2022-2023, a nationally representative survey of the noninstitutionalized Korean population conducted by the Korea Disease Control and Prevention Agency (KDCA) using a multistage, stratified, cluster sampling design. KNHANES was first initiated in 1998 and has been conducted annually since 2007 to assess the health and nutritional status of the Korean population, with audiologic assessments included in selected survey cycles. In the ninth KNHANES, the sampling design incorporated stratification by administrative district and housing type, with additional stratification according to sex, age, residential floor area ratio, and demographic characteristics of the household head. The survey was conducted after receiving approval from the Institutional Review Board of the KDCA (IRB Nos. 2018-01-03-4C-A and 2022-11-16-R-A). This study was conducted with a waiver of informed consent approved by the Institutional Review Board of Hanyang University Hospital (IRB No. 2026-01-010).
Study population
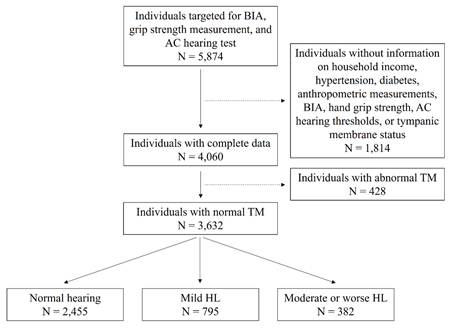
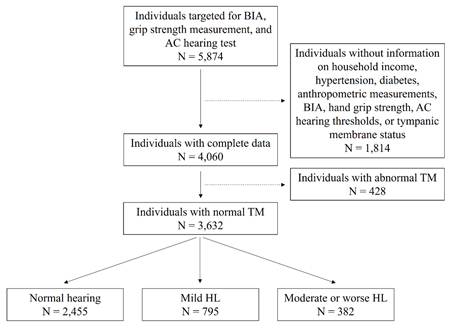
Among a total of 5,874 adults who were candidates for pure-tone audiometry, BIA, and handgrip strength testing, 1,814 individuals with missing information on household income, hypertension, diabetes, anthropometric measurements, BIA parameters, grip strength, air-conduction hearing thresholds, or tympanic membrane status were excluded, leaving 4,060 participants with complete data. Of these, 428 participants with abnormal tympanic membranes on otologic examination were further excluded. Consequently, the final analytic sample consisted of 3,632 individuals, representing 19,812,129 individuals in South Korea, with normal tympanic membranes (type A tympanogram). For each participant, the ear-specific pure-tone average (PTA) was calculated as the arithmetic mean of air-conduction thresholds at 0.5, 1, 2, and 4 kHz. The lower of the right- and left-ear PTA values was used as the better-ear PTA. The final analytic sample was categorized as having normal hearing (≤ 25 dB), mild hearing loss (> 25 to ≤ 40 dB), or moderate-or-worse hearing loss (> 40 dB) according to the better-ear PTA (Figure 1).
Flow chart of participant selection according to eligibility criteria and hearing status categories. N, number; BIA, bioelectrical impedance analysis; AC, air conduction; TM, tympanic membrane; HL, hearing loss.
Otologic evaluation
In the ninth KNHANES, otologic examinations were performed by four trained nurses affiliated with the Korean Society of Otorhinolaryngology-Head and Neck Surgery under otorhinolaryngologist supervision. Tympanic membrane and middle ear status were assessed using tympanometry with a Titan IMP440 screener (Interacoustics, Assens, Denmark), and hearing thresholds were measured with an AD629 audiometer (Interacoustics, Assens, Denmark) in a double-walled soundproof booth. All devices underwent regular and unscheduled maintenance by manufacturer-certified managers. Air-conduction pure-tone audiometry was conducted at 0.5, 1, 2, 4, and 8 kHz. Participants with missing or scale-out audiometric values were excluded, and only individuals with type A tympanograms were included in the analysis.
Hearing-aid usage
The association between hearing aid use and muscle mass or grip strength was evaluated in patients with hearing thresholds > 40 dB, which were regarded as disabling hearing loss. To account for severity-dependent differences in hearing-aid use [19], participants were stratified into moderate and moderately severe or worse groups using a 55-dB cutoff. One male participant with a cochlear implant, classified in the moderate hearing-loss subgroup (better-ear PTA > 40 to ≤ 55 dB), was excluded only from the hearing-aid-use analysis because cochlear implantation represents a different form of auditory rehabilitation. This participant was retained in the primary analyses according to hearing status.
Bioelectric impedance and grip strength
BIA was conducted by four trained nurses, clinical laboratory technologists, and radiologic technologists. All examiners received standardized training twice annually and underwent two on-site quality inspections each year. Equipment calibration was performed once annually and additionally on a weekly basis during examination periods. Body composition was assessed using the InBody 970 device (Biospace, Seoul, Korea). Each body composition index was calculated by dividing the respective component's weight (kg) by the square of the height (m²). The same examiners also evaluated handgrip strength using a digital dynamometer (Takei Digital Grip Strength Dynamometer, Model T.K.K.5401; Takei, Niigata, Japan). Handgrip strength was measured twice for each hand, with a 60-second rest interval between trials. Examiners received both theoretical and practical training twice annually, with additional assessments conducted as needed. The dynamometers were calibrated biannually by the quality control team of the supervising research organization, and daily equipment checks were performed on examination days.
Definition of sarcopenia
According to the Asian Working Group for Sarcopenia (AWGS) 2019 criteria [20], sarcopenia was defined as the combination of low appendicular skeletal muscle mass index (ASMI < 7.0 kg/m² for men and < 5.7 kg/m² for women, respectively) and low muscle strength (handgrip strength < 28 kg for men and < 18 kg for women, respectively).
Statistical analysis
To represent the general population of South Korea, sampling weights for the health interview and examination surveys were applied based on a complex survey design. Because BIA and grip strength measurements were performed only in individuals aged 65 years or older in 2023 due to time and cost constraints, half of the sampling weights for individuals aged 65 years or older were applied for the combined 2022 and 2023 data to represent one year of the general population. Continuous variables were analyzed using general linear models based on the complex survey design, while categorical variables were analyzed using cross-tabulation. Pairwise post-hoc comparisons were performed using the same complex-survey design and sampling-weight specification as the corresponding model. All pairwise contrasts were two-sided and Bonferroni-adjusted within each sex-specific outcome across the three hearing-loss-category comparisons.
All multivariable analyses were conducted separately for men and women and incorporated the complex survey design and sampling weights. Multivariable general linear models were used to estimate adjusted mean body-composition indices and handgrip strength according to hearing-loss category. Models were adjusted for age, household-income quintile, hypertension, and diabetes mellitus. Collinearity between age and PTA was assessed using correlation coefficients and variance inflation factors (VIF). Age and household-income quintile were entered as continuous variables, per 1-year and per 1-quintile increase, respectively, whereas hypertension and diabetes mellitus were entered as binary variables. Adjusted means were derived as estimated marginal means from the fitted models, with continuous covariates evaluated at their sex-specific means.
Multivariable binary logistic-regression analyses were used to estimate adjusted odds ratios for sarcopenia. In the primary model, better-ear pure-tone average (PTA) was entered as a continuous variable per 1-dB increase. To evaluate the association according to hearing-loss severity, an additional model included hearing status categorically, with normal hearing as the reference group. The same covariates were included in both logistic-regression models.
As a sensitivity analysis, the multivariable analyses of handgrip strength and sarcopenia were repeated among participants aged ≥65 years. All tests were two-sided, and p values < 0.05 were considered statistically significant. Statistical values were presented as means ± standard errors. All statistical analyses were conducted using IBM SPSS Statistics, version 25.0 (IBM Corp., Armonk, NY, USA).
Results
Demographics and underlying diseases
When participants were stratified by hearing status (normal hearing, mild hearing loss, and moderate-or-worse hearing loss), groups with worse hearing were markedly older (p < 0.001) and had a higher proportion of men (p < 0.001). Household income quintile decreased with worsening hearing (p < 0.001). Furthermore, the prevalence of hypertension and diabetes mellitus was significantly higher in both the mild and moderate-or-worse hearing loss groups than in the normal hearing group (both p < 0.001). Table 1 summarizes the demographic characteristics and comorbid conditions of the study population according to hearing status.
Demographic factors and underlying diseases of the normal hearing, mild hearing loss, and moderate hearing loss groups.
| Variable | Group | p-value | ||
|---|---|---|---|---|
| Normal hearing (N = 2455/*N= 15758425) | Mild hearing loss (N = 795/*N = 2889723) | Moderate or worse hearing loss (N = 382/*N = 1163981) | ||
| Age (years) | 54.29±0.36 | 67.02±0.55 | 72.16±0.80 | <0.001a |
| Sex | ||||
| Male (%) | 46.70% | 54.05% | 61.64% | <0.001b |
| Female (%) | 53.30% | 45.95% | 38.36% | |
| Household income (quintile) | 3.52±0.05 | 2.77±0.08 | 2.33±0.10 | <0.001a |
| 5th | 29.36% | 15.55% | 7.35% | <0.001b |
| 4th | 25.51% | 20.23% | 14.69% | |
| 3rd | 21.24% | 16.97% | 16.88% | |
| 2nd | 15.28% | 20.64% | 25.91% | |
| 1st | 8.61% | 26.60% | 35.17% | |
| Hypertension (%) | 24.62% | 50.80% | 53.53% | <0.001b |
| Diabetes mellitus (%) | 9.83% | 24.68% | 20.03% | <0.001b |
a, statistical results from complex sample general linear analysis
b, statistical results from complex sample cross-sectional analysis
Bold values indicate significant differences defined as P < 0.05.
N, number.
Anthropometric measurements
In the weighted population of 9,638,731 male participants, anthropometric parameters showed differences according to hearing status. Normal-hearing participants exhibited the highest mean weight, height, and body mass index (BMI) whereas those with moderate-or-worse hearing loss demonstrated significantly lower values (all p < 0.001).
Among the weighted population of 10,173,398 female participants, weight (p < 0.001), height (p < 0.001), BMI (p = 0.003) and waist circumference (WC, p < 0.001) differed across hearing status (Table 2).
Anthropometric measurements and body composition of males and females according to their hearing status.
| Variable | Male group | p-value | Female group | p-value | ||||
|---|---|---|---|---|---|---|---|---|
| Normal hearing (N = 937/*N= 7359194) | Mild HL (N = 391/*N = 1562030) | Mod or worse HL (N = 239/*N = 717507) | Normal hearing (N = 1518/*N= 8399231) | Mild HL (N = 404/*N = 1327693) | Mod or worse HL (N = 143/*N = 446474) | |||
| Anthropometrics | ||||||||
| Weight (kg) | 74.00±0.50 | 69.92±1.06 | 66.05±0.88 | <0.001 | 59.02±0.31 | 57.92±0.54 | 54.83±0.74 | <0.001 |
| Height (cm) | 171.49±0.25 | 168.68±0.52 | 166.44±0.59 | <0.001 | 158.35±0.21 | 154.26±0.32 | 151.49±0.66 | <0.001 |
| BMI (kg/m2) | 25.11±0.14 | 24.50±0.30 | 23.78 ±0.21 | <0.001 | 23.54±0.12 | 24.33±0.21 | 23.87±0.29 | 0.003 |
| Waist circumference (cm) | 89.30±0.36 | 89.79±0.77 | 88.65±0.67 | 0.502 | 80.27±0.36 | 84.49±0.61 | 84.00±0.87 | <0.001 |
| ASMI (kg/m2) | ||||||||
| Upper extremity | 2.16±0.01 | 2.07±0.03 | 1.94±0.02 | <0.001 | 1.55±0.01 | 1.57±0.02 | 1.54±0.02 | 0.479 |
| Lower extremity | 5.82±0.02 | 5.55±0.1 | 5.35±0.04 | <0.001 | 4.69±0.02 | 4.48±0.03 | 4.31±0.05 | <0.001 |
| Total extremity | 7.98±0.03 | 7.62±0.07 | 7.29±0.06 | <0.001 | 6.24±0.02 | 6.05±0.04 | 5.85±0.06 | <0.001 |
| Fat mass index (kg/m2) | ||||||||
| Upper extremity | 0.77±0.01 | 0.80±0.03 | 0.81±0.02 | 0.408 | 1.13±0.02 | 1.27±0.03 | 1.20±0.04 | <0.001 |
| Central | 3.37±0.05 | 3.36±0.09 | 3.32±0.07 | 0.875 | 3.99±0.05 | 4.40±0.08 | 4.25±0.11 | <0.001 |
| Lower extremity | 1.80±0.02 | 1.80±0.04 | 1.84±0.03 | 0.524 | 2.35±0.02 | 2.50±0.04 | 2.43±0.05 | 0.001 |
| Total | 6.35±0.08 | 6.37±0.16 | 6.38±0.12 | 0.981 | 7.91±0.09 | 8.62±0.15 | 8.33±0.20 | <0.001 |
| Body water index (kg/m2) | ||||||||
| Intracellular | 8.58±0.04 | 8.24±0.08 | 7.86±0.06 | <0.001 | 7.07±0.02 | 7.04±0.04 | 6.94±0.06 | 0.132 |
| Extracellular | 5.21±0.02 | 5.12±0.04 | 4.97±0.03 | <0.001 | 4.41±0.01 | 4.50±0.03 | 4.49±0.04 | 0.001 |
| Total | 13.79±0.06 | 13.36±0.12 | 12.83±0.09 | <0.001 | 11.48±0.04 | 11.54±0.07 | 11.43±0.10 | 0.666 |
| Hand grip strength (kg) | 42.17±0.33 | 37.44±0.56 | 34.10±0.67 | <0.001 | 25.18±0.17 | 22.55±0.26 | 19.93±0.49 | <0.001 |
Statistical results in this table were obtained using a complex samples general linear model.
N, number; HL, hearing loss; ASMI, appendicular skeletal muscle mass index; *, weighted sample size based on a complex survey design.
After adjusting for age, household income, hypertension, and diabetes, weight, height, BMI, and WC were not different according to the severity of hearing loss in men (weight, p = 0.643; height, p = 0.544; BMI, p = 0.759; WC, p = 0.496), while women showed differences in weight and height (weight, p = 0.026; height, p = 0.005; BMI, p = 0.365; WC, p = 0.415). In the post hoc analysis among women, the normal hearing group and mild hearing loss group showed higher weight (normal hearing group: 58.76 ± 0.29 kg; mild hearing loss group: 58.94 ± 0.60 kg) and height (normal hearing: 157.67 ± 0.17 cm; mild hearing loss: 157.17 ± 0.34 cm) than the moderate-or-worse hearing loss group (weight: 56.68 ± 0.79 kg, p = 0.012 for normal hearing group, p = 0.011 for mild hearing loss group; height: 155.73 ± 0.58 cm, p = 0.001 for normal hearing, p = 0.016 for mild hearing loss group).
Body composition
Male
In men, unadjusted ASMI and body-water indices differed across hearing-loss categories (all p < 0.001; Table 2). In contrast, upper-extremity, central, lower-extremity, and total fat mass indices did not differ significantly across hearing-loss categories. The VIF between age and PTA was 1.678, indicating acceptable collinearity.
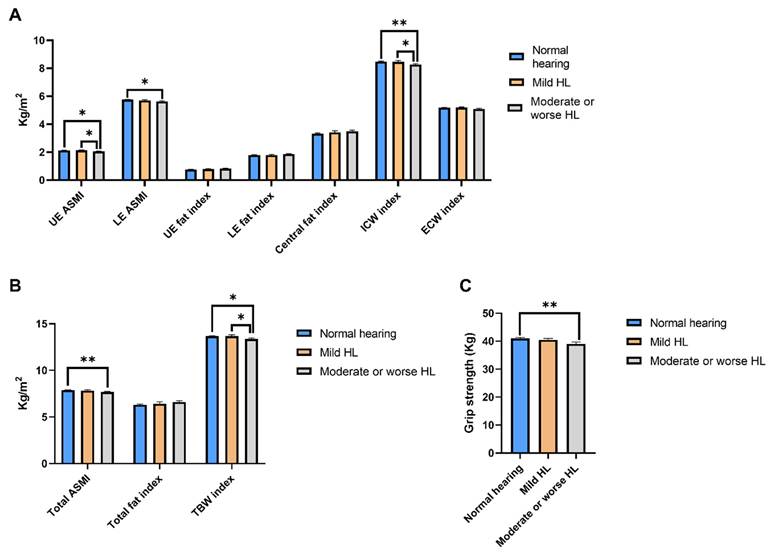
After multivariable adjustment for age, household income, hypertension, and diabetes mellitus, differences in body-composition measures were observed primarily in the moderate-or-worse hearing-loss group. Differences between the normal-hearing and mild hearing-loss groups were not consistently observed (Figures 2A and 2B). Specifically, the moderate-or-worse hearing loss group exhibited significantly lower upper extremity ASMI (2.06 ± 0.03 kg/m2), intracellular water index (8.28 ± 0.07 kg/m2), and total body water index (13.38 ± 0.10 kg/m2) than both the normal-hearing (upper extremity ASMI: 2.13 ± 0.01 kg/m2, p = 0.015; intracellular water index: 8.49 ± 0.04, p = 0.006; total body water index: 13.67 ± 0.05 kg/m2, p = 0.016) and mild hearing loss groups (upper extremity ASMI: 2.13 ± 0.04 kg/m2, p = 0.013; intracellular water index: 8.49 ± 0.04 kg/m2, p = 0.019; total body water index: 13.67 ± 0.15, p = 0.028). In addition, the moderate-or-worse hearing loss group also showed reduced lower extremity ASMI and total ASMI (lower extremity ASMI: 5.63 ± 0.04 kg/m2; total ASMI: 7.69 ± 0.06 kg/m2) compared with the normal hearing group (lower extremity ASMI: 5.76 ± 0.02 kg/m2, p = 0.011; total ASMI: 7.89 ± 0.03 kg/m2, p = 0.006) (Figures 2A and 2B).
Multivariable-adjusted body-composition indices and handgrip strength according to hearing-loss category in men. Segmental muscle, fat, and body-water indices (A), total indices (B), and handgrip strength (C) are shown. Models were adjusted for age, household income, hypertension, and diabetes mellitus. Bars represent estimated marginal means, and error bars represent standard errors; asterisks indicate statistically significant between-group differences (* p < 0.05; ** p < 0.01). UE, upper extremity; LE, lower extremity; ASMI, appendicular skeletal muscle mass index; ICW, intracellular water; ECW, extracellular water; TBW, total body water; HL, hearing loss.
Female
In women, lower-extremity ASMI, total ASMI, upper-extremity fat mass index, central fat index, and total fat mass index differed across hearing-loss categories in the unadjusted analysis (all p < 0.001). Lower-extremity fat mass index and extracellular body-water index also differed across groups (both p = 0.001) (Table 2). The VIF between age and PTA was 1.765, indicating acceptable collinearity.
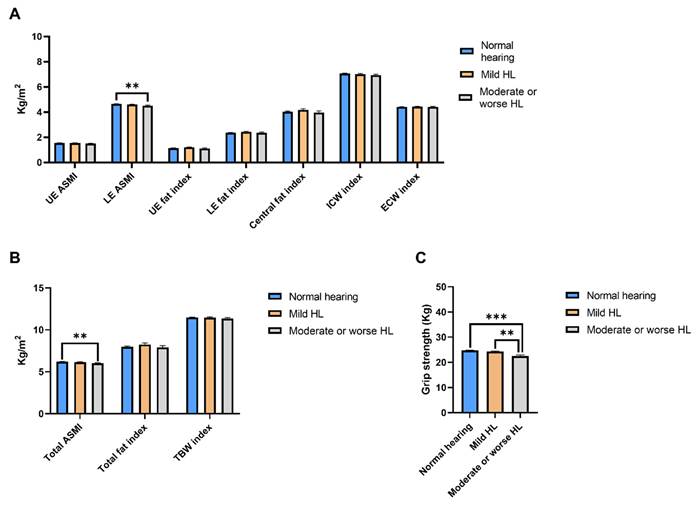
In the multivariable analysis adjusting for age, household income, hypertension, and diabetes, lower extremity and total ASMI were significantly lower in the moderate-or-worse hearing loss group (4.52 ± 0.04 kg/m2 and 6.03 ± 0.07 kg/m2, respectively) than in the normal hearing group (4.66 ± 0.02 kg/m2, p = 0.002 and 6.22 ± 0.02 kg/m2, p = 0.006, respectively). Differences between the normal-hearing and mild hearing-loss groups were not consistently observed (Figures 3A and 3B).
Multivariable-adjusted body-composition indices and handgrip strength according to hearing-loss category in women. Segmental muscle, fat, and body-water indices (A), total indices (B), and handgrip strength (C) are shown. Models were adjusted for age, household income, hypertension, and diabetes mellitus. Bars represent estimated marginal means, and error bars represent standard errors; asterisks indicate statistically significant between-group differences (* p < 0.05; ** p < 0.01; *** p < 0.001). UE, upper extremity; LE, lower extremity; ASMI, appendicular skeletal muscle mass index; ICW, intracellular water; ECW, extracellular water; TBW, total body water; HL, hearing loss.
Grip strength
Handgrip strength differed across hearing-loss categories in both men and women (both p < 0.001; Table 2). After multivariable adjustment for age, household-income quintile, hypertension, and diabetes mellitus, handgrip strength was lower in the moderate-or-worse hearing-loss group (39.03 ± 0.66 kg) than in the normal-hearing group among men (41.04 ± 0.29 kg, p = 0.004) and mild hearing loss group (40.51 ± 0.50 kg, p = 0.033) (Figure 2C). Among women, handgrip strength was lower in the moderate-or-worse hearing-loss group (22.45 ± 0.48 kg) than in both the normal-hearing group (24.78 ± 0.14 kg, p < 0.001) and the mild hearing-loss group (24.28 ± 0.26 kg, p = 0.001) (Figure 3C).
Sarcopenia
Overall, weighted population of 535,569 individuals (weighted prevalence, 2.70 %) met the AWGS 2019 criteria for sarcopenia. Of these, 182,248 were males and 353,321 were females. In males, sarcopenia was identified in 0.4% (n = 28,319) with normal hearing, 4.2% with mild hearing loss (n = 65,708), and 12.3% (n = 88,221) with moderate-or-worse hearing loss, significantly different among the groups (p < 0.001). Among females, sarcopenia was identified in 2.2% (n = 185,077) of those with normal hearing, 6.8% (n = 90,236) of those with mild hearing loss, and 17.5% (n = 78,007) of those with moderate-or-worse hearing loss, showing an increasing trend with increasing hearing loss severity (p < 0.001).
In sex-stratified multivariable logistic-regression analyses, higher hearing thresholds were associated with higher odds of sarcopenia in men (OR 1.044, 95% CI 1.007-1.082; p = 0.020) and women (OR 1.024, 95% CI 1.005-1.043; p = 0.013) after adjustment for age, household income, hypertension, and diabetes mellitus (Table 3).
Binary logistic regression analysis for sarcopenia
| Gender | Variables | OR | 95% CI | p-value |
|---|---|---|---|---|
| Male | Age (years) | 1.109 | 1.020, 1.206 | 0.015 |
| Household income (quintile) | 0.834 | 0.642, 1.083 | 0.173 | |
| Hypertension | 0.675 | 0.395, 1.152 | 0.149 | |
| Diabetes | 2.038 | 1.067, 3.895 | 0.031 | |
| Hearing thresholds (dB) | 1.044 | 1.007, 1.082 | 0.020 | |
| Female | Age (years) | 1.077 | 1.031, 1.126 | 0.001 |
| Household income (quintile) | 0.850 | 0.686, 1.053 | 0.136 | |
| Hypertension | 1.153 | 0.734, 1.810 | 0.535 | |
| Diabetes | 1.066 | 0.632, 1.798 | 0.809 | |
| Hearing thresholds (dB) | 1.024 | 1.005, 1.043 | 0.013 |
The logistic-regression analyses included 1,567 (representing 9,638,731 males) men, of whom 71 (representing 182,248 males) met the AWGS criteria for sarcopenia, and 2,065 women (representing 10,173,398 females), of whom 115 (representing 353,321females) met the AWGS criteria for sarcopenia.
Statistical results in this table were obtained using a complex samples logistic regression model.
OR, odds ratio; CI, confidence interval.
Statistically significant results were described in bold.
Sensitivity analyses
In the sensitivity analysis restricted to participants aged ≥ 65 years, men in the moderate-or-worse hearing-loss group and mild hearing-loss groups had lower adjusted handgrip strength (moderate-or-worse hearing-loss: 34.21 ± 0.52 kg; mild hearing-loss: 34.43 ± 0.40 kg) than those in the normal-hearing (35.49 ± 0.35 kg, p = 0.048 compared to moderate-or-worse hearing-loss; p = 0.042 compared to mild hearing-loss) (Figure 4A). In women, adjusted handgrip strength was lower in the moderate-or-worse hearing-loss group (20.64 ± 0.48 kg) than normal hearing group (22.32 ± 0.18 kg, p < 0.001). Moderate-or-worse hearing-loss group also showed lower handgrip strength compared to mild hearing loss group (21.99 ± 0.24 kg, p = 0.012) (Figure 4C).
Sensitivity analyses of handgrip strength and sarcopenia according to hearing-loss severity among participants aged ≥ 65 years. (A) Multivariable-adjusted handgrip strength and (B) categorical adjusted odds ratios for sarcopenia according to hearing-loss category in men. (C, D) Corresponding analyses in women. Bars represent estimated marginal means, and error bars represent standard errors; asterisks indicate statistically significant differences (* p < 0.05; ** p < 0.01; *** p < 0.001).
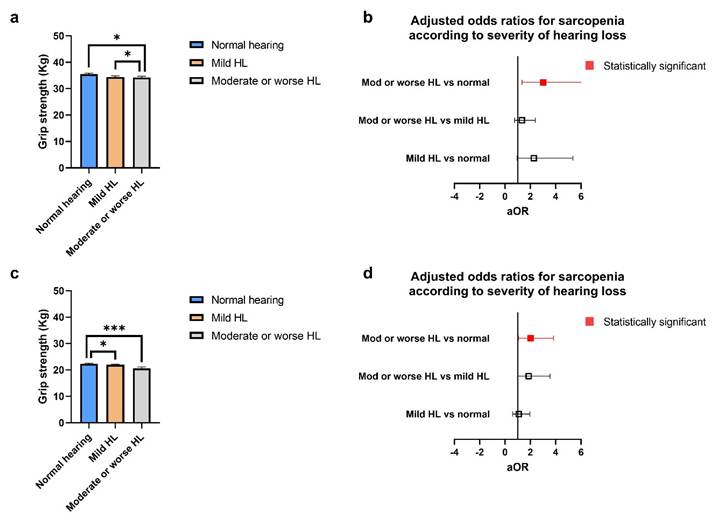
In the multivariable logistic analysis, higher hearing thresholds were significantly associated with higher odds of sarcopenia in men (aOR 1.025, 95% CI 1.007-1.044; p = 0.008) and women (aOR 1.028, 95% CI 1.009-1.047; p = 0.004).
When hearing status was modeled categorically, the adjusted odds ratios for sarcopenia are presented separately for men (Figure 4B) and women (Figure 4D). Compared with normal hearing, moderate-or-worse hearing loss was associated with higher odds of sarcopenia in men (aOR 3.018, 95% CI 1.342-6.791; p = 0.008) and women (aOR 2.005, 95% CI 1.050-3.829; p = 0.035). Mild hearing loss was not significantly associated with sarcopenia in either sex.
Muscle-related parameters by hearing-aid use
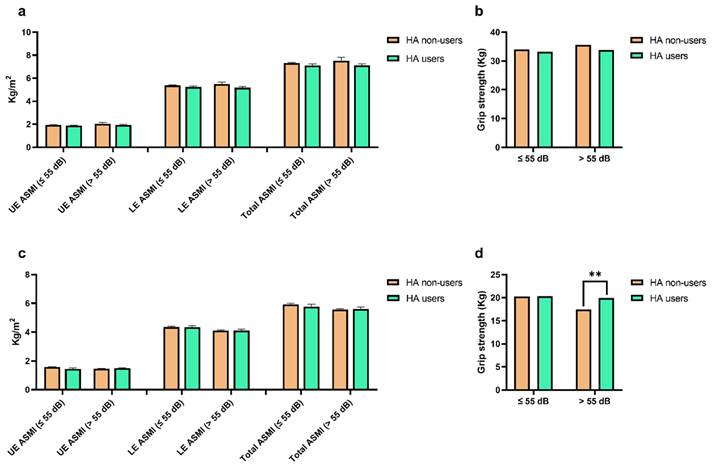
Additional subgroup comparisons of muscle-related parameters according to hearing-aid use were performed within sex-specific hearing-threshold strata. For the hearing-aid-use analysis, one male participant with a cochlear implant and moderate hearing loss (better-ear PTA > 40 to ≤ 55 dB) was excluded. Therefore, the analysis included 177 men (weighted n = 543,710) and 115 women (weighted n = 369,520) with moderate hearing loss. For moderately severe or worse hearing loss (PTA > 55 dB), the corresponding numbers were 61 men (weighted n = 173,558) and 28 women (weighted n = 76,954).
Among women with PTA > 55 dB, hearing-aid users showed a higher unadjusted mean handgrip strength than non-users (19.95 ± 0.76 vs. 17.46 ± 0.54 kg; p = 0.0096). Within this subgroup, hearing-aid users and non-users did not differ significantly in mean age (p = 0.955), household income quintile (p = 0.059), hypertension (p = 0.113), diabetes (p = 0.604), or mean PTA (p = 0.805). As these covariates showed no significant imbalance between groups, the unadjusted estimate was retained without further covariate adjustment.
In contrast, handgrip strength did not differ according to hearing-aid use among women with PTA > 40 to ≤ 55 dB or among men in either hearing-threshold stratum (Figure 5). No muscle-composition index differed according to hearing-aid use in either sex.
Sex-stratified muscle indices and grip strength according to hearing level (55-dB cutoff) and hearing aid use. Segmental and total ASMI and grip strength are shown for men (A, B) and women (C, D). Bars represent unadjusted means ± standard errors. Asterisks indicate unadjusted between-group differences (** p < 0.01). HA, hearing aid; UE, upper extremity; LE, lower extremity; ASMI, appendicular skeletal muscle mass index.
Discussion
In this nationally representative cross-sectional sample, moderate-or-worse hearing loss was associated with lower values for selected ASMI measures and handgrip strength after multivariable adjustment, and higher hearing thresholds were associated with greater odds of sarcopenia in both sexes. By characterizing segmental body composition using BIA and examining hearing-aid use alongside standard anthropometry, the present study extends prior research beyond global muscle mass alone.
In the adjusted analyses, several muscle-related indices were lower predominantly in participants with moderate-or-worse hearing loss. Additionally, intracellular and total body-water indices were lower in the moderate-or-worse hearing-loss group, consistent with their relation to muscle mass [21]. Several pathways might account for these associations. Hearing loss has been associated with communication difficulties, social isolation, and depressive symptoms [22], which may contribute to lower physical activity [23]. Although physical activity was not directly evaluated in the present study, these mechanisms may contribute to the development of sarcopenia.
The observed associations may also reflect shared age-related causes. Shared factors related to cardiometabolic disease, microvascular dysfunction, mitochondrial dysfunction, chronic inflammation, and oxidative stress may contribute to concurrent vulnerability of the auditory and musculoskeletal systems [9, 24, 25]. Another hypothesis is a shared underlying early-life etiology of hearing loss and sarcopenia. Specifically, early-life undernutrition and adverse developmental environments may also predispose individuals to concurrent vulnerability in both systems in later life [25, 26]. To clarify the relationship between hearing loss and sarcopenia, further prospective studies are warranted.
Lower muscle mass can impair gait and balance, increase fall risk, and reduce functional independence in older adults [27]. Its decline has been linked to frailty, disability and mortality [28, 29]. Beyond muscle mass, poorer hearing was associated with lower handgrip strength. Handgrip strength, a key component of sarcopenia definitions [20], reflects motor unit integrity, neural drive, and overall physical performance [30, 31]. Therefore, reduced handgrip strength in patients with hearing loss may indicate impaired muscle functional quality and reduced physical performance. This finding is consistent with prior reports of associations between hearing impairment and poorer physical function [18, 32]. Accordingly, to assess physical function in patients with hearing loss, evaluation of both muscle mass and handgrip strength could be useful. Furthermore, consideration of potential functional impairment in patients with hearing loss may be necessary in clinical practice.
Hearing-aid use has been associated with higher physical activity and reduced sedentary time among older adults with hearing loss [8, 32]. In our subgroup analysis, women with PTA > 55 dB who used hearing aids showed higher handgrip strength than non-users. Previous research has suggested that patients with more severe hearing loss may report greater subjective benefit from hearing aids than those with milder hearing loss [33]. In addition, hearing-aid use has been associated with greater improvements in quality of life and out-of-home activity among women in some studies [34, 35]. Furthermore, a previous study reported that women with severe-to-profound hearing impairment showed higher adherence to audiological rehabilitation [36]. These reports provide context for the observed subgroup difference. However, because the present finding arose from a small cross-sectional subgroup, it may also reflect differences in socioeconomic circumstances, health-seeking behavior, or baseline physical function. Prospective studies are needed to clarify this relationship.
This study has several limitations. First, the cross-sectional design precludes determination of the temporal direction of the observed associations between hearing loss and muscle-related parameters. Second, given the substantial age differences across hearing-loss categories, residual confounding by age and other age-related factors, such as frailty, nutritional status, and overall health status, cannot be excluded despite multivariable adjustment. Consistent with this concern, the per-1-dB adjusted odds ratio for sarcopenia in men attenuated from 1.044 in the full sample to 1.025 in the sensitivity analysis restricted to participants aged ≥65 years. Therefore, the findings should be interpreted cautiously, considering possible residual confounding by age. Third, analyses of hearing-aid use involved small subgroups, limiting statistical power and adjustment for potential confounders. Fourth, the lack of physical-performance data, such as gait speed or the Short Physical Performance Battery, prevented assessment of sarcopenia severity according to the AWGS 2019 criteria [20]. In addition, data on physical activity also could not be used due to the substantial number of participants that would be excluded because of missing data. Fifth, participants without analyzable air-conduction threshold data were excluded. Because the available data did not distinguish scale-out thresholds from noncompletion, refusal, or other reasons for missing audiometric data, we could not determine how many participants were excluded specifically because of scale-out thresholds. This may have limited the generalizability of our findings to individuals with profound hearing loss.
Despite these limitations, this study consistently revealed an association between hearing loss and sarcopenia. The nationally representative dataset and standardized audiologic and body-composition measurements are also strengths of this study. Prospective studies with prespecified assessment of muscle-related parameters, physical activity, and comprehensive physical-performance measures are needed to clarify temporal relationships and to examine whether hearing rehabilitation is associated with subsequent changes in physical function.
Conclusion
Hearing loss was significantly associated with lower ASMI, reduced handgrip strength, and a higher prevalence of sarcopenia. In addition, among women with advanced hearing loss, hearing aid use was related to higher grip strength, suggesting a potential role of hearing rehabilitation in preserving muscle function. These findings support hearing loss as an important correlate of sarcopenia and underscore the need to consider both hearing rehabilitation and muscle-strengthening interventions in the comprehensive care of individuals with hearing loss.
Acknowledgements
Funding
This work was supported by the research fund of Hanyang University (HY-202500000003704).
Data availability statement
The dataset used in this study is available at the following link:
https://mdis.kostat.go.kr/dwnlSvc/ofrSurvSearch.do?curMenuNo=UI_POR_P9240
ORCID
Yoon Ah Ko: 0009-0006-4948-4191. Minju Baek: 0009-0007-3944-4134. Sang-Yoon Han: 0000-0002-4014-8531.
Author contributions
Yoon Ah Ko: Investigation, visualization, writing - original draft. Minju Baek: Project administration. Sang-Yoon Han: Conceptualization, data curation, formal analysis, funding acquisition, investigation, methodology, resources, software, supervision, validation, writing - review & editing.
Competing Interests
The authors have declared that no competing interest exists.
References
1. Sheffield AM, Smith RJH. The Epidemiology of Deafness. Cold Spring Harb Perspect Med. 2019;9(9):a033258
2. Tu NC, Friedman RA. Age-related hearing loss: Unraveling the pieces. Laryngoscope Investig Otolaryngol. 2018;3(2):68-72
3. Reed NS, Jiang K, Deal JA. Hearing Loss Among Older Adults: Epidemiology, Disparities, and Gaps in Research. Annu Rev Public Health. 2026;47(1):41-58
4. Ciorba A, Bianchini C, Pelucchi S, Pastore A. The impact of hearing loss on the quality of life of elderly adults. Clin Interv Aging. 2012;7:159-163
5. Han SY, Seo HW, Lee SH, Chung JH. Revisiting Age-Related Normative Hearing Levels in Korea. J Korean Med Sci. 2025;40(2):e3
6. Chou KL. Combined effect of vision and hearing impairment on depression in older adults: evidence from the English Longitudinal Study of Ageing. J Affect Disord. 2008;106(1-2):191-196
7. Mick P, Kawachi I, Lin FR. The association between hearing loss and social isolation in older adults. Otolaryngol Head Neck Surg. 2014;150(3):378-384
8. Han SY, Seo HW, Lee SH, Chung JH. Physical Inactivity and Sedentariness in Older Hearing Loss patients: Restoration With Hearing Aids. Laryngoscope. 2024;134(12):5109-5115
9. Brenowitz WD, Wallhagen MI. Does Hearing Impairment Affect Physical Function?: Current Evidence, Potential Mechanisms, and Future Research Directions for Healthy Aging. JAMA Netw Open. 2021;4(6):e2114782
10. Jiam NT, Li C, Agrawal Y. Hearing loss and falls: A systematic review and meta-analysis. Laryngoscope. 2016;126(11):2587-2596
11. Harridge SD, Lazarus NR. Physical Activity, Aging, and Physiological Function. Physiology (Bethesda). 2017;32(2):152-161
12. Westerterp KR. Changes in physical activity over the lifespan: impact on body composition and sarcopenic obesity. Obes Rev. 2018;19(Suppl 1):8-13
13. Fransen E, Topsakal V, Hendrickx JJ. et al. Occupational noise, smoking, and a high body mass index are risk factors for age-related hearing impairment and moderate alcohol consumption is protective: a European population-based multicenter study. J Assoc Res Otolaryngol. 2008;9(3):264-263
14. Hwang JH. et al. Association of central obesity with the severity and audiometric configurations of age-related hearing impairment. Obesity (Silver Spring). 2009;17:1796-801
15. Kim TS, Park SW, Kim DY, Kim EB, Chung JW, So HS. Visceral adipose tissue is significantly associated with hearing thresholds in adult women. Clin Endocrinol (Oxf). 2014;80(3):368-375
16. Lee J, Han K, Song JJ, Im GJ, Chae SW. Sarcopenia and Hearing Loss in Older Koreans: Findings from the Korea National Health and Nutrition Examination Survey (KNHANES) 2010. PLoS One. 2016;11(3):e0150281
17. Park CH, Yoon KJ, Lee YT, Jin SM, Lee SH, Kim TH. Impact of Low Skeletal Muscle Mass and Obesity on Hearing Loss in Asymptomatic Individuals: A Population-Based Study. Healthcare (Basel). 2022;10(10):2022
18. Zhang Z. Association between sarcopenia and hearing impairment in middle-aged and elderly people in China: a prospective cohort study. Sci Rep. 2024;14:6061
19. Reed NS, Garcia-Morales EE, Myers C. et al. Prevalence of Hearing Loss and Hearing Aid Use Among US Medicare Beneficiaries Aged 71 Years and Older. JAMA Netw Open. 2023;6(7):e2326320
20. Chen LK, Woo J, Assantachai P. et al. Asian Working Group for Sarcopenia: 2019 Consensus Update on Sarcopenia Diagnosis and Treatment. J Am Med Dir Assoc. 2020;21(3):300-307.e2
21. Serra-Prat M, Lorenzo I, Palomera E, Ramírez S, Yébenes JC. Total Body Water and Intracellular Water Relationships with Muscle Strength, Frailty and Functional Performance in an Elderly Population. J Nutr Health Aging. 2019;23(1):96-101
22. Shukla A, Harper M, Pedersen E. et al. Hearing Loss, Loneliness, and Social Isolation: A Systematic Review. Otolaryngol Head Neck Surg. 2020;162(5):622-633
23. Hawkley LC, Thisted RA, Cacioppo JT. Loneliness predicts reduced physical activity: cross-sectional & longitudinal analyses. Health Psychol. 2009;28(3):354-363
24. Maniaci A, La Via L, Lechien JR. et al. Hearing Loss and Oxidative Stress: A Comprehensive Review. Antioxidants (Basel). 2024;13(7):842
25. Azzolino D, Spolidoro GCI, Saporiti E, Luchetti C, Agostoni C, Cesari M. Musculoskeletal Changes Across the Lifespan: Nutrition and the Life-Course Approach to Prevention. Front Med (Lausanne). 2021;8:697954
26. Emmett SD, Schmitz J, Karna SL. et al. Early childhood undernutrition increases risk of hearing loss in young adulthood in rural Nepal. Am J Clin Nutr. 2018;107(2):268-277
27. Peoples BM, Harrison KD, Santamaria-Guzman KG, Campos-Vargas SE, Monaghan PG, Roper JA. Functional lower extremity strength influences stepping strategy in community-dwelling older adults during single and dual-task walking. Sci Rep. 2024;14(1):13379
28. Park TS, Shin MJ. Comprehensive Assessment of Lower Limb Function and Muscle Strength in Sarcopenia: Insights from the Sit-to-Stand Test. Ann Geriatr Med Res. 2024;28(1):1-8
29. de Santana FM, Premaor MO, Tanigava NY, Pereira RMR. Low muscle mass in older adults and mortality: A systematic review and meta-analysis. Exp Gerontol. 2021;152:111461
30. Carson RG. Get a grip: individual variations in grip strength are a marker of brain health. Neurobiol Aging. 2018;71:189-222
31. Bohannon RW. Grip Strength: An Indispensable Biomarker For Older Adults. Clin Interv Aging. 2019;14:1681-1691
32. Martinez-Amezcua P, Powell D, Kuo PL. et al. Association of Age-Related Hearing Impairment With Physical Functioning Among Community-Dwelling Older Adults in the US. JAMA Netw Open. 2021;4(6):e2113742
33. Ziemska-Gorczyca M, Dżaman K, Kantor I. Impact of Hearing Loss Severity on Hearing Aid Benefit Among Adult Users. Healthcare (Basel). 2024;12(23):2450
34. Joanovič E, Kisvetrová H, Nemček D. et al. Gender differences in improvement of older-person-specific quality of life after hearing-aid fitting. Disabil Health J. 2019;12(2):209-213
35. Zahl SM. Effects of Receiving Hearing Aids on Health-Related Quality of Life in Adults With Mild Hearing Loss. J Audiol Otol. 2023;27(1):24-29
36. Turunen-Taheri S, Carlsson PI, Johnson AC, Hellström S. Severe-to-profound hearing impairment: demographic data, gender differences and benefits of audiological rehabilitation. Disabil Rehabil. 2019;41(23):2766-2774
Author contact
Corresponding author: Sang-Yoon Han, M.D., Ph.D., Department of Otolaryngology-Head and Neck Surgery, College of Medicine, Hanyang University, Seoul, Republic of Korea, 222, Wangsimni-ro, Seongdong-gu, Seoul, Republic of Korea, 04763. Tel: +82-2-2290-8580; Fax: +82-2-2293-3335; E-mail: hsy9010com.