Impact Factor ISSN: 1449-1907




Int J Med Sci 2026; 23(11):3336-3355. doi:10.7150/ijms.126351 This issue Cite
Review
Metabolomics in the Prediction and Early Diagnosis of Type 2 Diabetes Mellitus: Advances and Applications
Xiaokai Wei1,2*, Min He2,3*, Haili Wang4, Xin Xiang1, Mengyuan Li2,3, Mengmeng Li1,2, Thanh Tuan Vu Le1,2, Zhongxian Wang1,2, Dingqi Zhang1, Lei Cheng1, Mengmeng Sun2,3  , Hongfeng Wang2,3
1. College of Acupuncture and Tuina, Changchun University of Chinese Medicine, Changchun, Jilin, China.
2. Jilin Provincial International Cooperation Key Laboratory of Traditional Medicine for Prevention and Treatment of Metabolic Diseases, Changchun University of Chinese Medicine, Jingyue Economic Development District, Changchun, Jilin, China.
3. Northeast Asia Institute of Traditional Chinese Medicine, Changchun University of Chinese Medicine, Changchun, Jilin, China.
4. College of Traditional Chinese Medicine, Changchun University of Chinese Medicine, Changchun, Jilin, China.
*These authors contributed equally to this work.
Received 2025-10-7; Accepted 2026-9-2; Published 2026-9-11
Abstract
Early detection and intervention can prevent the onset and progression of type 2 diabetes mellitus (T2DM); however, achieving early diagnosis and accurate prediction remains challenging. Metabolomics, a potent diagnostic tool in systems biology, makes it possible to systematically identify important biomarkers linked to type 2 diabetes, which provides vital proof for risk assessment and early diagnosis. This review summarizes research advances in metabolomics for T2DM prediction and early detection since 2010 by incorporating both the reported prospective and cross-sectional metabolic evidence, with a focus on putative biomarkers and their metabolic characteristics identified across diverse biological samples. Furthermore, it highlights the unique advantages of metabolomics in T2DM early warning, aiming to offer novel insights for future research on personalized prevention and early diagnostic strategies.
Keywords: diabetes, metabolomics, prediction, early diagnosis, biomarkers, sample
1. Introduction
Type 2 diabetes mellitus (T2DM), characterized by insulin resistance and a progressive loss of insulin secretion, is a chronic metabolic disease with a sharply increasing global prevalence. The International Diabetes Federation (IDF) estimates that 537 million adults had diabetes in 2021, a number projected to reach 783 million by 2045 [1]. Unmanaged hyperglycemia leads to severe micro- and macrovascular complications, profoundly impacting quality of life and imposing a substantial economic burden on healthcare systems [2]. Therefore, the early and accurate identification of T2DM is crucial, and halting disease progression represents a key preventive strategy.
Prediabetes is the intermediary phase where blood glucose exceeds normal ranges but does not yet meet the diagnostic criteria for diabetes [3]. This stage is potentially reversible, and precision or personalised nutritional interventions have been shown to improve cardiometabolic risk factors in this population [4]. However, current diagnostic tools, including fasting plasma glucose, 2-hour postprandial glucose, and glycated hemoglobin (HbA1c), possess notable limitations. The sample source is restricted to human blood specimens; fasting blood glucose is temporally constrained, exhibits low sensitivity, and may result in overlooked diagnoses; postprandial blood glucose demonstrates inadequate stability and reproducibility; the oral glucose tolerance test necessitates multiple blood collections, is invasive, and is time-consuming, rendering it inappropriate for extensive population screening. In addition, HbA1c reflects average blood glucose levels over the preceding 2-3 months and may not capture acute glycemic fluctuations.
Human diabetes is a multifaceted disease shaped by environmental and genetic factors, often remaining asymptomatic for extended periods [5]. Progression from prediabetes to T2DM can vary from months to over 10 years [6]. Traditional risk factors like age, gender, and BMI offer limited predictive accuracy for the onset of T2DM [7]. Consequently, there is an imperative necessity to identify precise biomarkers that can forecast the beginning of T2DM, enabling timely intervention.
Metabolomics, the study of endogenous small-molecule metabolites, offers a powerful solution. As an analytical method examining metabolic products and pathways, it provides detailed and dependable insights into T2DM onset and progression [8]. Metabolomics has been effectively utilized for disease prediction and biomarker screening [9,10], as the differential expression of metabolites can elucidate molecular mechanisms at various stages of the disease [11]. Over the past decade, metabolomics research in T2DM has advanced significantly. Initial studies often employed non-targeted techniques with small sample sizes to identify linked metabolites [12]. This has progressed to large-scale, multi-cohort validations and mechanistic explorations [13]. Recently, the focus has shifted to integrating multi-omics data and using advanced technologies like machine learning to develop robust prediction models from diverse biological samples such as blood, urine, and saliva [14,15].
Therefore, this review synthesizes metabolomics research since 2010 relating to T2DM prediction and early diagnosis across diverse clinical samples, by incorporating both the reported prospective and cross-sectional metabolic evidence. To achieve this, we will also summarize common methodological approaches and highlight critical research gaps that need to be addressed to advance the field. Ultimately, this review aims to provide a clear perspective on the current applications and future potential of metabolomics in the early management of T2DM.
2. Basic overview of metabolomics
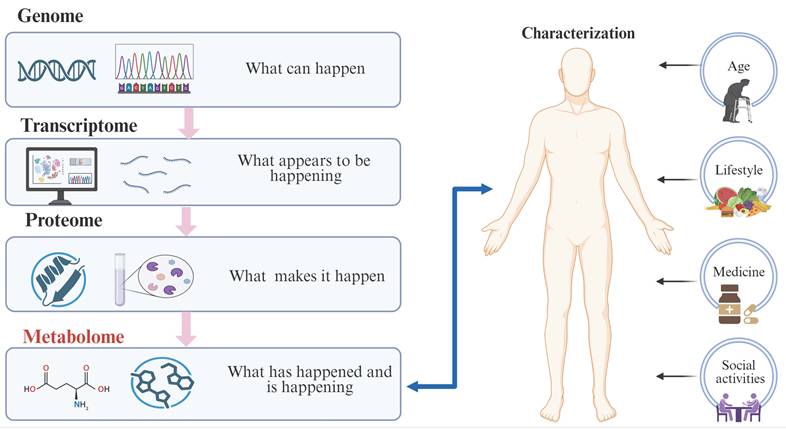
Metabolites are endogenous small molecules with a molecular weight of less than 1000 Da that take part in metabolic processes within living organisms. They reflect comprehensive physiological and pathological changes in cells or tissues and constitute the ultimate outcomes of gene expression [16]. Every metabolite found in a biological system during metabolic processes is included in the metabolome [17], and the chemical profile of a specific biological system serves as a reflection of its current phenotype. This profile is frequently utilized to analyze pathophysiological processes associated with disease progression and to investigate potential biomarkers for disease diagnosis or prognosis [18]. Metabolomics constitutes a fundamental aspect of “omics” science, focusing on the analysis of chemical products or metabolites generated by cells and organisms. It investigates biological systems through the analysis of metabolite alterations resulting from stimulation or disruption of cells, tissues, or organisms. Metabolomics is recognized for its extensive capacity to predict phenotypes and has developed into a significant research tool in natural and life sciences [19], facilitating the understanding of biological system responses to internal and external stimuli [20]. Metabolites, being the result of various interactions including those with the genome and proteome, enable metabolomics to accurately reflect an organism's phenotype with high sensitivity. This feature allows metabolomics to significantly contribute to the investigation of disease biomarkers (Figure 1). Metabolomics has offered a novel perspective on complex diseases, including diabetes, through ongoing research. Finding pertinent metabolites can help elucidate disease mechanisms and make it easier to find biomarkers for diagnosis and prognosis [21,22].
Metabolomics and other omics in relation to each other. Overview of the relationship between metabolomics and other omics layers, showing that the metabolome reflects physiological and pathological states and is influenced by multiple factors. Created with BioRender.com (Agreement number: HY29M9Q500).
3. Methods in metabolomics research
The two primary categories of metabolomics research methodologies are targeted metabolomics and non-targeted metabolomics (Figure 2). Targeted and non-targeted metabolomics research techniques have significantly improved over the past decade.
Non-targeted metabolomics and targeted metabolomics. Comparison of the methods and main characteristics of non-targeted and targeted metabolomics. Created with BioRender.com (Agreement number: AM29M9Q3XZ).
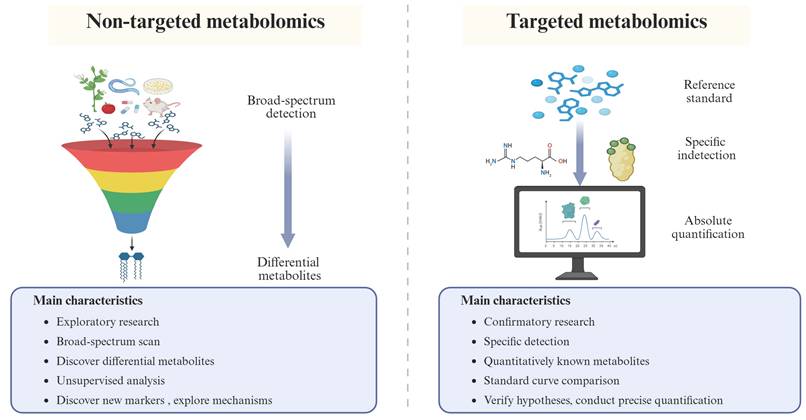
Non-targeted metabolomics serves as the method of choice for hypothesis-free exploration. By achieving extensive metabolic coverage, this broad-spectrum strategy facilitates the bioinformatic identification of differential features and relevant pathways [23]. It is particularly suited for discovering previously unidentified metabolites and novel biomarkers [24], thereby revealing new biological insights that might be missed by focused approaches [25].
Conversely, targeted metabolomics concentrates on the precise quantification of specifically known compounds [26]. Frequently employed to validate non-targeted findings [27], this method integrates standard references to correct for matrix effects, enabling the accurate detection of low-abundance metabolites. It is essential for verifying specific disease correlations and elucidating pathophysiological mechanisms, especially in metabolic disorders, making it an indispensable tool for clinical diagnosis and biomarker investigation [28].
4. Technologies for metabolite detection
Analytical platforms such as chromatography, mass spectrometry (MS), nuclear magnetic resonance spectroscopy (NMR), and capillary electrophoresis (CE) are frequently employed in metabolomics research (Figure 3). When selecting the optimal detection technology, research goals must be carefully considered. Among these, NMR and MS—coupled with various separation techniques—dominate the field. Currently, the most prevalent methodologies are NMR, gas chromatography-mass spectrometry (GC-MS), and liquid chromatography-mass spectrometry (LC-MS).
Frequently employed metabolomics methods. Common analytical platforms used in metabolomics, together with their respective characteristics and areas of application. Created with BioRender.com (Agreement number: UF29M9PZWE).
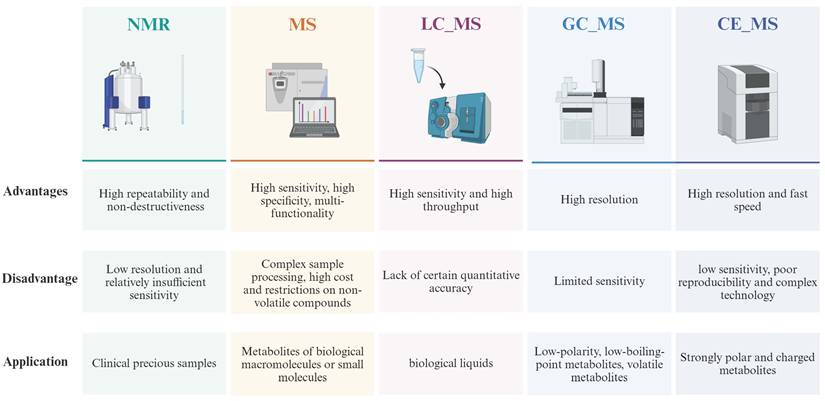
NMR is widely utilized due to its non-destructive nature and capacity to concurrently identify numerous organic molecules in biological samples [29-31]. This integrity-preserving characteristic makes it particularly suitable for stable isotope-labeled metabolic flux investigations and the analysis of valuable clinical samples, such as tissue biopsies. However, the technology faces challenges in effectively examining low-abundance metabolites due to limited resolution and sensitivity [32]. Furthermore, the widespread application of NMR is restricted by its reliance on costly superconducting magnet equipment [33].
GC-MS is the preferred method for analyzing volatile, low-polarity, and thermally stable metabolites [34]. While it offers high resolution for identifying specific compound classes like alcohols and organic acids, it is unsuitable for highly polar or thermally unstable substances in their native form [35]. A significant operational challenge is the frequent requirement for chemical derivatization to increase sample volatility; this step complicates pretreatment, and compounds resistant to derivatization cannot be quantified.
LC-MS provides a broader analytical scope than GC-MS because the detection process is unaffected by sample volatility or thermal stability. Consequently, it is widely utilized for profiling complex biological fluids, including tissue extracts, blood, and urine [36-39]. This platform eliminates the need for derivatization, thereby simplifying the workflow while delivering high sensitivity and throughput. Despite these advantages, the quantitative accuracy of LC-MS can be compromised by matrix effects, such as ion suppression or amplification [40].
For effective disease prediction or early diagnosis, the selection of biological samples and analytical platforms must be carefully tailored to the specific disease context and research objectives.
5. Metabolomics-based research for T2DM prediction and early diagnosis
5.1 Literature search and selection strategy
To identify relevant studies for background and comparison, a literature search was conducted across PubMed, Web of Science, and Embase for articles published between January 1, 2010, and March 31, 2026. The search utilized keywords such as "metabolomics," "type 2 diabetes," "prediabetes," "prediction," and "early diagnosis." The search was restricted to articles in English.
All retrieved records were imported into Zotero for duplicate removal. Two authors (X.W. and M.H.) independently screened the titles and abstracts of the remaining articles. Subsequently, the full texts of potentially eligible articles were assessed for final inclusion based on predefined criteria. Any disagreements during the screening process were resolved by a third author (H.W.).
To provide a comprehensive overview of metabolomics in 'early detection', our scope was designed to intentionally include two types of studies. The inclusion criteria were therefore formulated to capture both: (1) predictive studies, which investigate future (incident) T2DM risk in individuals healthy at baseline, and (2) diagnostic/cross-sectional studies, which identify biomarkers that distinguish individuals with prevalent prediabetes or early T2DM from healthy controls. We consider both study designs essential for a complete synthesis of the field.
Following this framework, the specific inclusion criteria were: (1) human studies (observational or interventional); (2) application of metabolomics for predicting future T2DM or diagnosing prediabetes/early T2DM; (3) reporting of specific metabolite biomarkers; and (4) original research articles.
Exclusion criteria were: (1) reviews, conference abstracts, or editorials; (2) animal or in vitro studies; (3) studies on type 1 or gestational diabetes; and (4) studies with a sample size < 20 or insufficient data for extraction.
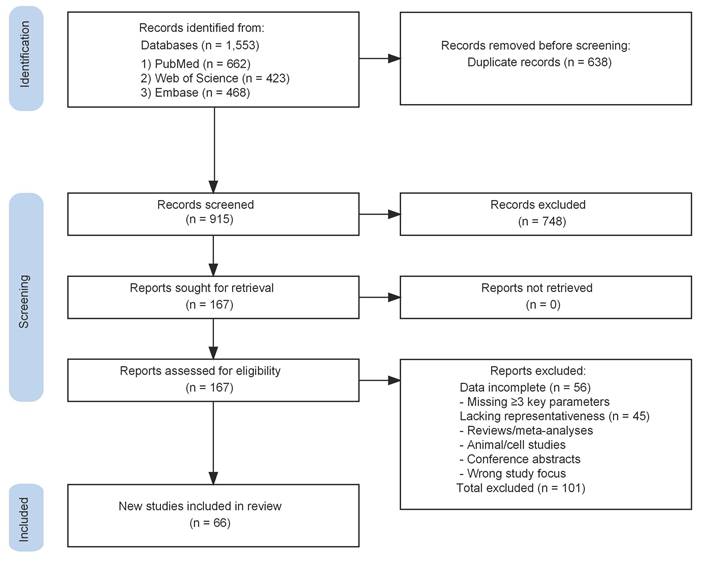
The entire screening process is illustrated in the PRISMA flow diagram (Figure 4).
Flowchart of the literature selection process. PRISMA flowchart illustrating the process of literature retrieval, screening, eligibility assessment, and final inclusion of studies in this review.
5.2 Characteristics of included studies
Following an extensive literature search, 66 studies were selected to representatively summarize the current progress in metabolomics applications for early T2DM diagnosis. These included both prospective and cross-sectional study designs. These studies represent a broad geographical and ethnic diversity, covering 19 nations across Europe, Asia, North America, and the Middle East, and including populations such as Han Chinese, Native Americans, African Americans, and multiethnic European cohorts. This global distribution underscores the growing interest in metabolomics for T2DM early diagnosis.
The sample sizes of the included studies varied widely, ranging from under one hundred to nearly one hundred thousand participants, reflecting a mix of small-scale exploratory studies and large-scale validation cohorts. The age range of subjects was also broad (14 to 90 years), with some studies focusing on specific age groups for targeted analysis. Notably, several recent studies specifically addressed gender differences in T2DM risk prediction, acknowledging the higher incidence rates observed in males [41,42] and contributing to personalized medicine approaches.
In terms of diagnostic criteria, the majority of studies follow recommendations from the American Diabetes Association (ADA) or the World Health Organization (WHO) (Table 1), which generally divide people into groups with prediabetes, healthy populations, and T2DM patients based on HbA1c, 2-hour postprandial blood glucose, and fasting blood glucose levels. Other studies have developed additional criteria specific to regional features or experimental needs.
Diagnostic criteria for T2DM and prediabetes
| Authoritative institution | FPG (mmol/L) | 2hPG (mmol/L) | HbA1c (%) | Reference | |
|---|---|---|---|---|---|
| T2DM | WHO | ≥ 7.0 | ≥ 11.1 | ≥ 6.5 | [43] |
| ADA | ≥ 7.0 | ≥ 11.1 | ≥ 6.5 | [44] | |
| IDF | ≥ 7.0 | ≥ 11.1 | ≥ 6.5 | [45] | |
| Prediabetes | WHO | 6.1-6.9 | 7.8-11.0 | NR | [43] |
| ADA | 5.6-6.9 | 7.8-11.0 | 5.7-6.4 | [44] | |
| IDF | 5.6/6.1-6.9 | 7.8-11.0 | 5.7-6.4/NR | [45] |
NR: Data not reported in the original publication; WHO: World Health Organization; ADA: American Diabetes Association; IDF: International Diabetes Federation; FPG: fasting plasma glucose; 2hPG: 2-h plasma glucose; HbA1c: glycated hemoglobin
The range of sample types includes metabolomics examination of biological samples, including blood, urine, saliva, feces and cerebrospinal fluid. Due to its simplicity of collection and good data stability, blood is the most commonly utilized sample among these; in contrast, cerebrospinal fluid is the least commonly used sample because of operational and ethical limitations in medicine. These diverse samples offer a multitude of information for clarifying the pathophysiology of T2DM as well as potentially acting as early disease diagnostic markers. Table 2 summarizes the general characteristics of the 66 included studies. By analyzing diverse biological samples, metabolomics not only yields novel insights for predicting T2DM but also provides critical evidence for designing and conducting subsequent clinical trials.
Summary of characteristics of the 66 included studies
| Characteristic | Category | Number of Studies (n) | Percentage (%) |
|---|---|---|---|
| Study Design | Predictive (Prospective) | 33 | 50.0 |
| Diagnostic (Cross-sectional) | 33 | 50.0 | |
| Sample Type | Blood (Plasma/Serum) | 54 | 81.8 |
| Urine | 1 | 1.5 | |
| Saliva | 2 | 3.0 | |
| Feces | 2 | 3.0 | |
| CSF | 1 | 1.5 | |
| Multi-sample | 6 | 9.1 | |
| Analytical Platform | LC-MS based | 36 | 54.5 |
| NMR | 13 | 19.7 | |
| GC-MS based | 3 | 4.5 | |
| Other | 8 | 12.1 | |
| Combined | 6 | 9.1 | |
| Validation Strategy | Internal Validation / No Validation | 49 | 74.2 |
| Independent External Validation | 17 | 25.8 | |
| Sample Size | < 100 participants | 15 | 22.7 |
| 100-1000 participants | 30 | 45.5 | |
| > 1000 participants | 21 | 31.8 | |
| Geographic Region | Europe | 26 | 39.4 |
| Asia & Middle East | 27 | 40.9 | |
| North America | 9 | 13.6 | |
| Multi-continental | 4 | 6.1 |
Abbreviations: CSF, cerebrospinal fluid; GC-MS, gas chromatography-mass spectrometry; LC-MS, liquid chromatography-mass spectrometry; NMR, nuclear magnetic resonance.
5.3 Heterogeneity in analytical platforms and data processing
Although these findings are encouraging, we observed significant methodological heterogeneity in data preprocessing, statistical analysis, and validation strategies, which exerts a crucial impact on the discovery and reproducibility of biomarkers.
In terms of data preprocessing, various methods were employed for missing value handling, including half of the minimum value [46], the k-nearest neighbor algorithm [47], and direct exclusion of metabolites with high missing rates. Normalization strategies were also inconsistent, with common approaches including total peak intensity normalization [48], internal standard correction, and batch correction based on quality control samples [49,50]. For scaling and transformation, common approaches included log transformation [46, 51], Z-score standardization or Pareto scaling to improve data distribution [8, 12, 52]. Technical differences in these preprocessing steps may introduce potential technical biases and affect the consistency of results across studies.
Regarding statistical analysis methods, a combined strategy of univariate and multivariate analyses was widely adopted [13, 53, 54]: univariate methods, including t-test, Wilcoxon rank-sum test, and Mann-Whitney U test, were used for preliminary screening of differential metabolites; multivariate analyses extensively employed PCA, PLS-DA, and OPLS-DA for data dimensionality reduction and inter-group classification, with some studies further combining algorithms such as LASSO regression [55] and Random Forest to optimize feature selection [56]. Notably, there were obvious discrepancies in multiple test correction strategies: when multiple-testing correction was reported, commonly used approaches included FDR or Bonferroni [13, 57, 58], while some studies did not clearly state the correction method. Such inconsistency in correction strategies may increase the risk of false-positive results.
In terms of validation, only a few studies conducted validation in independent external cohorts, and most relied on internal cross-validation or did not perform validation. This current situation highlights an important methodological bottleneck that metabolomic biomarker research needs to overcome before achieving generalizability and clinical translation. Future studies should promote the standardization of data preprocessing and statistical analysis workflows, and strengthen independent cohort validation to improve the reliability and clinical applicability of metabolic biomarkers.
5.4 Machine learning application status
In addition to the heterogeneity in analytical platforms and data processing mentioned earlier, machine learning has become a core analytical method in metabolomics-based T2DM prediction research.
Regarding algorithm application, logistic regression, random forest, and LASSO regression are the most commonly used. Logistic regression often serves as a stable and interpretable baseline model, with reported AUC values often falling in the range of 0.75-0.85 [49, 55, 59]. Random forest excels at handling nonlinear relationships in high-dimensional data, achieving AUC values above 0.85 in some studies through internal validation [56]. LASSO regression, owing to its automatic feature selection capability, is widely used to screen key biomarkers from a large number of metabolites to construct concise predictive models. Furthermore, although partial least squares discriminant analysis and its variants are commonly employed for preliminary pattern recognition and biomarker discovery, they are mainly used for exploratory analysis and are less frequently used as final models subjected to rigorous external validation.
Model construction generally centers on metabolite features, with amino acids and lipid metabolites frequently reported as key predictors across studies [8, 49, 53]. Some studies further integrated clinical features (such as age, BMI, and blood glucose indicators) [7, 49, 60]. This integrative strategy typically enhances the biological plausibility and clinical utility of the models.
However, the rigor of model validation varies significantly, which directly impacts the assessment of their true efficacy. Among the 66 included studies, 15 (22.7%) have sample sizes of fewer than 100. Although such small-sample studies often report excellent performance in internal validation, most lack independent external validation or show significant performance degradation upon external testing, suggesting overfitting risks and limited generalizability. Overall, among the 66 studies included, approximately 74% rely solely on internal cross-validation, while only 17 studies have undergone rigorous independent external validation (Table 2). Study-level details, including sample size and study design for each of the 66 included studies, are provided in Supplementary Table S1. Across externally validated studies, findings were more consistently observed at the metabolic pathway level than at the individual metabolite level, with amino acid metabolism being the most frequently identified domain across different cohorts.
Furthermore, models incorporating a large number of metabolite predictors may be complex and costly to implement in routine clinical practice, potentially hindering their translation. There is also a paucity of head-to-head comparisons demonstrating whether metabolomics-based models provide incremental value over established clinical risk scores (e.g., based on age, BMI, and HbA1c). Therefore, future efforts should focus on constructing models within large-scale, multi-center cohorts, prioritize parsimonious models, and regard independent external validation as a necessary prerequisite for model evaluation and clinical translation, to enhance the robustness and generalizability of predictive tools.
6. Application of metabolomics in different samples for the prediction and early diagnosis of T2DM
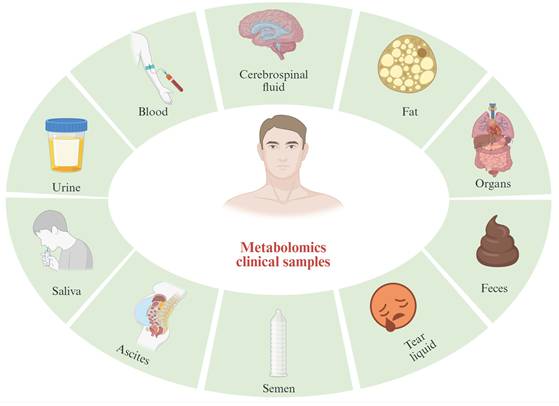
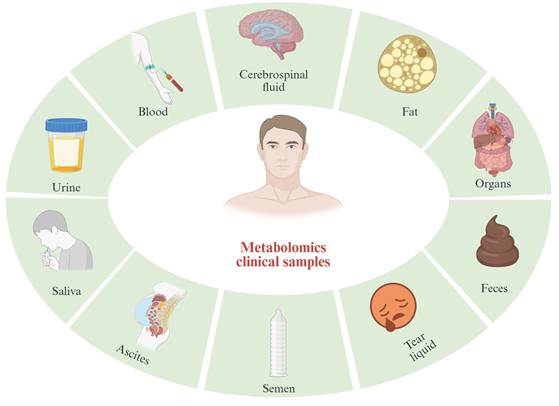
Metabolomics research is inherently dependent on biological samples, whose characteristics, collection protocols, and extraction methods are key determinants [106]. Different biological matrices present varying levels of accessibility and analytical challenges [18]. Current T2DM research predominantly focuses on blood (plasma/serum), urine, saliva, cerebrospinal fluid, and feces (Figure 5). These matrices allow researchers to characterize metabolic perturbations induced by genetic and environmental factors, facilitating the identification of predictive biomarkers.
Samples frequently utilized in clinical metabolomics investigations. Biological matrices used in clinical metabolomics studies for the prediction and early diagnosis of T2DM, including blood, urine, saliva, feces, cerebrospinal fluid, and other sample types. Created with BioRender.com (Agreement number: IR29M9Q1LG).
Building upon the analysis in the previous section, this discussion expands to a broader range of literature to comprehensively elucidate the applications of metabolomics across different biological samples. By delving into the physiological characteristics, detection advantages, and underlying mechanisms of each sample type, this section aims to provide a holistic perspective on their application potential for the early prediction of T2DM.
6.1 Application of blood metabolomics for predicting and early-diagnosing T2DM
In studies on metabolomics, blood is the most often utilized research sample. Along with being biomarkers, their associated metrics can be used to predict particular outcomes by acting as indications of physiological or pathological processes [107]. Serum and plasma, the primary metabolite carriers of biological organisms, can provide a wealth of information regarding the physiological and pathological state of specific biological systems at specific times. Because serum and plasma are relatively easy to acquire and highly informative, their metabolites are commonly used for T2DM risk prediction and biomarker discovery [13, 67]. For instance, the risk of T2DM is linked to amino acids, lipids, and carbohydrates [108]. Therefore, serum and plasma represent ideal matrices for the early detection of a wide range of diseases.
Both plasma and serum are widely used in metabolomics, though they differ in preparation: plasma is collected with anticoagulants and retains clotting factors, whereas serum is obtained after clotting and centrifugation. Some evidence suggests that plasma may better preserve certain labile metabolites, while the clotting process in serum preparation may introduce additional variability [109]. Among the studies reviewed here, both matrices yielded largely comparable findings. Core biomarkers, including the branched-chain amino acids (BCAAs), particularly leucine and valine, the aromatic amino acid phenylalanine, glycine, serine, and α-hydroxybutyric acid (also known as 2-hydroxybutyric acid), showed largely consistent directional changes across plasma- and serum-based studies. However, a small number of metabolites, such as lysine and arginine, showed inconsistent trends between the two matrices in our synthesis [54, 70, 88, 89], which may reflect differences in sample preparation, study populations, or analytical platforms. Notably, no studies in our review performed a direct within-cohort comparison of serum versus plasma. Even the few studies that utilized both matrices did so for cross-cohort purposes, such as combining results or validating models, rather than for a direct comparison [13, 102].
Regarding amino acid metabolism, a highly robust finding is the alteration of several key amino acids. A study by Jabbar Al-Rikabi et al. [69] identified significant differences in glycine, serine, and proline between prediabetes and normal groups. In another representative study, Wenrui Ji et al. [11] identified L-leucine and L-arginine as biomarkers of prediabetes progression. The elevation of BCAAs like leucine is widely thought to interfere with insulin signaling [110], while changes in glycine and serine may reflect disruptions in oxidative stress defense and insulin sensitivity [111, 112]. This consistent pattern of amino acid dysregulation across multiple cohorts highlights its central role in early T2DM pathogenesis.
In the lipid domain, the accumulation of specific acylcarnitines is frequently reported, and this suggests incomplete mitochondrial fatty acid oxidation [8, 54, 85]. Furthermore, other novel biomarkers linked to energy metabolism and related pathways have been identified. For instance, α-hydroxybutyrate (α-HB) has emerged as a powerful early marker of insulin resistance [86, 113]. In the same line of research, peptide metabolites such as hydroxyproline-kynurenine ([Hyp3]-BK) were also identified as potential biomarkers. As a modified bradykinin, [Hyp3]-BK is involved in regulating vascular function, and its alteration may be linked not only to T2DM risk but also to future microvascular complications [114]. Other markers like mannose have also been noted, potentially indicating disturbances in protein glycosylation pathways [86, 115].
In summary, blood metabolomics provides a powerful and consistent set of biomarkers for T2DM prediction. While the amino acid signature—particularly BCAAs—is remarkably robust, some variability exists in reported lipid biomarkers. This discrepancy can often be attributed to methodological differences. For instance, despite notable differences in the overall biomarker profiles identified by prospective (identifying future risk) versus cross-sectional (reflecting the current disease state) studies, a consistent directional trend is nevertheless often reported for certain key metabolites, such as elevated BCAAs and reduced glycine [48, 60]. Furthermore, the choice of analytical platform plays a crucial role; LC-MS-based approaches excel at identifying a wide array of individual species, whereas NMR-based analyses focus on broader lipoprotein profiles, leading to complementary sets of biomarkers. Despite these variations, integrating blood-based metabolic markers with established clinical risk factors holds great promise for improving early and accurate risk assessment [8].
6.2 Application of urine metabolomics for predicting and early-diagnosing T2DM
Urine can be collected non-invasively in relatively large volumes, making it well-suited for metabolomics studies that require substantial sample sizes [116]. Urine metabolomics has been applied to a range of conditions, including diabetes [117], cancer [118], autism [119], and liver disease [120]. Although urine metabolomics has been less extensively studied than blood in the context of T2DM biomarker development, preliminary findings suggest it may provide complementary metabolic information for risk assessment and early diagnosis [12].
Reflecting systemic metabolic stress, urinary levels of acylcarnitines and BCAA catabolites have been identified as potential biomarkers. For instance, Salihovic et al. [121] proposed urine 3-hydroxyundecyl carnitine as a biomarker, while another study found the BCAA metabolite 3-methyl-2-oxopentanoate (3-MMPO) to be a strong predictor for impaired fasting glucose [82]. These findings mirror the mitochondrial dysfunction observed in blood studies.
Urine metabolomics also effectively reflects contributions from the gut microbiome. A study by Xinjie Zhao et al. [12], for instance, identified that urine concentrations of several metabolites linked to gut microbiota activity, such as methylxanthine, methyluric acid, and hippuric acid, were lower in people with impaired glucose tolerance. This highlights how urine can serve as a valuable, non-invasive matrix for capturing metabolic signals related to gut dysbiosis.
Furthermore, findings from urine metabolomics have underscored the importance of gender-specific analysis. A notable study by Nele Friedrich et al. [122], for example, found distinct sets of predictive urinary metabolites in men and women. In women, metabolites like acetic acid and carnitine were predictive, while in men, valine and 4-hydroxyphenylacetic acid were key biomarkers. This work underscores the need for gender-stratified analysis in future biomarker research.
In summary, given the limited number of urine metabolomics studies identified in this review, current evidence is preliminary. Larger, particularly longitudinal, cohorts are needed to advance biomarker discovery and validation. A major challenge in this field is the high variability introduced by diet, medication, and hydration status, which, combined with inconsistent collection and normalization protocols, contributes to discrepancies across studies. Therefore, future efforts could prioritize standardized operating procedures and rigorous validation in large, well-controlled longitudinal studies to help establish the clinical utility of urinary biomarkers.
6.3 Application of salivary metabolomics for predicting and early-diagnosing T2DM
Saliva is a colorless, thin, and slightly viscous fluid generated in the oral cavity. It is slightly acidic and is mostly made by three pairs of major salivary glands: the parotid, sublingual, and submandibular glands, as well as a few smaller salivary glands [123]. Like blood testing, saliva testing can reflect systemic health and disease status [124]. Salivary metabolomics examines dynamic changes in small-molecule metabolites to identify biomarkers for oral diseases [125,126], systemic diseases [127-129], and individual health variations [130]. Owing to its straightforward, rapid, cost-effective, and non-invasive collection [131], saliva enables repeated sampling with minimal adverse effects and is highly suitable for large-scale population screening [132]. Although salivary metabolomics has been applied to various conditions—including periodontitis [133], diabetes [134], Parkinson's disease [135], cancer [136], and Sjögren's syndrome [137]—studies specifically focused on T2DM prediction remain relatively scarce.
Saliva can mirror key metabolic changes of T2DM. A cross-sectional study by Virginia M. Barnes et al. [97] indicated that saliva from diabetic individuals showed elevated glucose, increased α-HB, and reduced levels of 1,5-Anhydroglucitol (1,5-AG) compared to non-diabetic controls. A similar pattern was observed by Noha A. Yousri et al. [98], who also noted changes in amino acids like alanine and glutamate.
The reduction of salivary 1,5-AG, a well-established marker of short-term glycemic control, shows promise for non-invasive glucose monitoring [138]. However, research in salivary metabolomics for T2DM prediction remains nascent. The current scarcity of large-scale longitudinal studies precludes the identification of a validated, saliva biomarker panel. Therefore, despite the ease of collection which makes saliva ideal for screening, extensive validation in large, diverse cohorts is urgently needed to confirm the clinical reliability and utility of these findings [139].
6.4 Application of cerebrospinal fluid (CSF) metabolomics for predicting and early-diagnosing T2DM
Cerebrospinal fluid (CSF) is closely associated with the central nervous system (CNS) and therefore provides a useful matrix for metabolomic investigation. The mean CSF volume is approximately 150 mL, which is renewed approximately four times every 24 hours [140]. Because CSF enables metabolic exchanges between blood and the brain [141] and is directly connected to the brain and spinal cord, CSF metabolomics may more accurately reflect physiological alterations within the CNS than other sample types. Consequently, it is considered important for understanding disease mechanisms and drug discovery [142], and is more relevant to neurological disorders than peripheral samples [143]. Notably, only one study on CSF metabolomics in T2DM was identified in this review.
This single study revealed a distinct metabolic signature in T2DM patients compared to controls, characterized by higher levels of mannose, lactic acid, pyruvic acid, and several amino acids, while histidine was reduced [101]. These findings, some of which appeared more pronounced in CSF than in plasma [101], point to heightened glycolysis and amino acid dysregulation within the CNS, offering a unique window into the metabolic state of the brain during T2DM development.
While these preliminary findings are promising, the practical application of CSF metabolomics is restricted by the invasive nature of lumbar puncture, which limits studies to small sample sizes [144]. This scarcity of data makes it difficult to draw robust conclusions or compare findings across studies. Therefore, future progress in this area will likely depend on multi-center collaborations to increase sample sizes and validate these promising but preliminary findings.
6.5 Application of fecal metabolomics for predicting and early-diagnosing T2DM
Fecal metabolites correlate with age, gender, and body fat [145], providing valuable insights for disease diagnosis and treatment monitoring [146]. In T2DM, shifts in intestinal microbiota abundance alter metabolites—including branched-chain amino acids, short-chain fatty acids, and bile acids [147]—which may drive disease progression. Thus, fecal metabolomics is a promising resource for early intervention, though only two studies were identified in this review.
One key study by Rebiya Nuli et al. [99] revealed significant shifts in fecal lipid composition, particularly fatty acyl and glycerophospholipid compounds, across normal, impaired glucose regulation, and T2DM groups. This indicates that abnormal host lipid metabolism is reflected in fecal contents. Furthermore, integrating fecal metabolomics with gut microbiota analysis is a valuable strategy for understanding T2DM pathogenesis [100], as it clarifies how microbial shifts drive metabolic changes that contribute to diabetes. This combined approach offers critical information for both diagnostics and targeted interventions.
In summary, fecal metabolomics provides a direct window into the gut microbiota-host axis. Moreover, evidence from fecal metabolomics remains limited. The fecal metabolomics study analyzed in this review employed a cross-sectional design [99], which restricts causal inference. Diet and sample handling may also introduce variability. Therefore, future progress will rely on larger, well-designed longitudinal studies with standardized protocols to improve reproducibility and clinical relevance.
7. Discussion and Outlook
Our synthesis of 66 human studies shows that the metabolic signature of each biological sample has its own distinct features, and these features largely determine how useful that sample can be for early prediction and diagnosis of T2DM (Figure 6, Table 3). In Table 3, serum and plasma are presented separately for detailed reporting, whereas in Figure 6 they were combined into the single category “blood” to provide an integrated comparison across sample types. Blood is by far the most extensively studied sample type. Its core metabolic markers have been repeatedly reported across populations, making blood-based metabolomics a relatively mature area for potential clinical translation. By contrast, only a very limited number of studies examined urine and fecal metabolomics. Preliminary evidence suggests that urinary metabolites may reflect renal handling of glucose and related metabolic perturbations, whereas fecal metabolites may offer insight into gut microbiota-host interactions in T2DM development. Although only a small number of salivary metabolomics studies have been identified, these studies generally suffer from small sample sizes and limited analytical depth. Despite this, preliminary evidence indicates partial overlap of certain metabolites between saliva and blood, consistent with Figure 6, where salivary metabolites were shared with blood rather than being saliva-unique, suggesting potential for non-invasive screening. Cerebrospinal fluid metabolomics may provide additional information on central nervous system metabolism in T2DM; however, because only one CSF study was identified, its relevance for early prediction or diagnosis remains highly preliminary. In summary, different biological matrices may offer complementary metabolic perspectives, but for non-blood samples this possibility remains insufficiently validated because of the limited number of available studies.
Reported metabolite markers for the prediction and early diagnosis of T2DM
| Metabolic pathway | Metabolite | Change | Sample | Collection time | Metabolomics technology | Study design | Reference |
|---|---|---|---|---|---|---|---|
| Amino acid | Leucine | ↑ | plasma | not eating or drinking since 8:00 the night before (≥10h) | LC-MS | Cross-sectional | [48] |
| ↑ | serum | after a 10-hour overnight fast; fasting was not required before blood collection | GC-MS; LC-MS | Cross-sectional/ Prospective | [90,57] | ||
| ↑ | CSF | fasting | NMR | Cross-sectional | [101] | ||
| ↓ | saliva | in the afternoon | UHPLC-MS/MS; GC-MS/MS | Cross-sectional | [98] | ||
| Valine | ↑ | plasma | not eating or drinking since 8:00 the night before (≥10h); after a 12-h fasting period; fasting; fast for 8-12 h | LC-MS; UPLC-MS; LC-MS/MS; MS | Cross-sectional | [48,67,54,69] | |
| ↑ | serum | after a 10-hour overnight fast, fasting was not required before blood collection | GC-MS; LC-MS | Cross-sectional/ Prospective | [90,57] | ||
| ↓ | serum | after 12 h fasting, in the morning | NMR | Cross-sectional | [103] | ||
| ↑ | CSF | fasting | NMR | Cross-sectional | [101] | ||
| Tryptophan | ↑ | blood | in the morning, between 8:00 and 10:30 am, after not eating for at least 10 hours | UPLC | Cross-sectional | [84] | |
| ↑ | plasma | fasting | LC-MS/MS | Cross-sectional | [54] | ||
| ↑ | urine | after an overnight fast under standardized conditions | UPLC-QTOF-MS | Cross-sectional | [12] | ||
| Histidine | ↑ | plasma | after an overnight fast, not eating or drinking since 8:00 the night before (≥10h) | MS | Cross-sectional | [48] | |
| ↓ | CSF | fasting | NMR | Cross-sectional | [101] | ||
| ↓ | plasma | overnight fast | UPLC-MS/MS | Prospective | [77] | ||
| ↓ | serum | after 12 h fasting, in the morning | NMR | Cross-sectional | [103] | ||
| Tyrosine | ↑ | plasma | Fasting; Fasting; mostly non-fasting | LC-MS; LC-MS/MS; NMR | Prospective/Cross-sectional/Prospective | [64,54,102] | |
| ↑ | serum | mostly non-fasting | NMR | Prospective | [102] | ||
| ↑ | CSF | fasting | NMR | Cross-sectional | [101] | ||
| Phenylalanine | ↑ | serum | fasting was not required before blood collection; fasting; after a 10-hour overnight fast | LC-MS; LC-MS; GC-MS | Prospective/Prospective/Cross-sectional | [57,89,90] | |
| ↑ | plasma | fasting after a 12-h fasting period | LC-MS; UPLC-MS; LC-MS/MS | Prospective/Cross-sectional/Cross-sectional | [64,67,54] | ||
| ↑ | CSF | fasting | NMR | Cross-sectional | [101] | ||
| ↓ | serum | overnight fasting | NMR | Cross-sectional | [88] | ||
| ↑ | saliva | in the afternoon | UHPLC-MS/MS; GC-MS/MS | Cross-sectional | [98] | ||
| Alanine | ↑ | serum | after a 10-hour overnight fast. | GC-MS | Cross-sectional | [90] | |
| ↓ | serum | after 12 h fasting, in the morning | NMR | Cross-sectional | [103] | ||
| ↑ | plasma | Fasting; fasting (≥8 h) | LC-MS; NMR | Cross-sectional/Prospective/Prospective/Cross-sectional | [54,63,64,101] | ||
| ↑ | CSF | fasting | NMR | Cross-sectional | [101] | ||
| ↓ | plasma | overnight fast of at least 8 h | FIA-MS/MS; LC-MS/MS | Cross-sectional | [68] | ||
| ↑ | saliva | in the afternoon | UHPLC-MS/MS; GC-MS/MS | Cross-sectional | [98] | ||
| Proline | ↑ | serum | after a 10-hour overnight fast. | GC-MS; LC-MS | Cross-sectional | [90] | |
| ↑ | plasma | after a 12-h fasting period; fasting; fast for 8-12 h | UPLC-MS; LC-MS/MS; MS | Cross-sectional | [67,54,69] | ||
| ↑ | saliva | in the afternoon | UHPLC-MS/MS; GC-MS/MS | Cross-sectional | [98] | ||
| Glutamic acid | ↑ | serum | after a 10-hour overnight fast; fasting; after 12 h fasting, in the morning | GC-MS; LC-MS; NMR | Cross-sectional/Prospective/Cross-sectional | [90,89,103] | |
| ↓ | serum | overnight fasting | NMR | Cross-sectional | [88] | ||
| ↑ | plasma | fasting | LC-MS/MS | Cross-sectional | [54] | ||
| Glycine | ↓ | serum | fasting | LC-MS | Prospective | [79,89] | |
| ↑ | CSF | fasting | NMR | Cross-sectional | [101] | ||
| ↓ | plasma | fasting; fast for 8-12 h | LC-MS/MS; MS | Cross-sectional | [54,69] | ||
| Lysine | ↑ | plasma | after a 12-hour fasting period | UPLC-QTOF-MS | Cross-sectional | [70] | |
| ↓ | serum | overnight fasting | NMR | Cross-sectional | [88] | ||
| Methionine | ↓ | serum | overnight fasting | NMR | Cross-sectional | [88] | |
| ↑ | plasma | fasting | LC-MS/MS | Cross-sectional | [54] | ||
| Serine | ↓ | blood | in the morning, between 8:00 and 10:30 am, after not eating for at least 10 hours | UPLC | Cross-sectional | [84] | |
| ↓ | serum | fasting serum | LC-MS | Prospective | [89] | ||
| ↓ | plasma | fasting | LC-MS/MS | Cross-sectional | [54] | ||
| ↓ | plasma | fast for 8-12 h | MS | Cross-sectional | [69] | ||
| Arginine | ↑ | serum | fasting | LC-MS | Prospective | [89] | |
| ↓ | plasma | Fasting; fasted overnight for at least 12 h | LC-MS/MS | Cross-sectional | [54,11] | ||
| Ornithine | ↓ | plasma | fasting | LC-MS/MS | Cross-sectional | [54] | |
| ↑ | saliva | in the afternoon | UHPLC-MS/MS; GC-MS/MS | Cross-sectional | [98] | ||
| Dimethylglycine | ↑ | plasma | fasting | LC-MS | Prospective | [62] | |
| 2-Pyrrolidone glycine | ↑ | plasma | following a 12-hour overnight fast, from 6:30 to 9:30 | UPLC-QTOF-MS | Prospective | [73] | |
| Cystine | ↑ | plasma | no food or drink since 20:00 the night before (≥10h) | LC-MS | Cross-sectional | [48] | |
| Homocysteine | ↓ | blood | in the morning, between 8:00 and 10:30 am, after not eating for at least 10 hours | UPLC | Cross-sectional | [84] | |
| Aspartic acid | ↑ | plasma | overnight fast | UPLC-MS/MS | Prospective | [77] | |
| Threonine | ↓ | plasma | fasting | LC-MS/MS | Cross-sectional | [54] | |
| ↓ | serum | after 12 h fasting, in the morning | NMR | Cross-sectional | [103] | ||
| Beta-threonine | ↓ | blood | in the morning (8:00-10:30 am) after a period of ≥10 hrs fasting | UPLC | Cross-sectional | [84] | |
| Lipid | Palmitic acid | ↑ | serum | after a 10-hour overnight fast | GC-MS; LC-MS | Cross-sectional | [90] |
| ↑ | serum | fasting | UPLC-MS | Cross-sectional | [92] | ||
| Stearic acid | ↑ | plasma | following a standardized overnight fast | UPLC-QTOF-MS | Cross-sectional | [12] | |
| ↑ | serum | after a 10-hour overnight fast | GC-MS; LC-MS | Cross-sectional | [90] | ||
| Acetyl carnitine | ↑ | plasma | not eating or drinking since 8:00 the night before (≥10h); fasting | LC-MS; LC-MS/MS | Cross-sectional | [48,54] | |
| ↑ | serum | fasting | LC-MS | Prospective | [85] | ||
| Lysophosphatidylcholine (LysoPC) | ↓ | plasma | following a standardized overnight fast | UPLC-QTOF-MS | Cross-sectional | [12] | |
| ↓ | urine | following a standardized overnight fast | UPLC-QTOF-MS | Cross-sectional | [12] | ||
| ↑ | fecal | fasting | LC-MS; GC-MS | Cross-sectional | [100] | ||
| Sphingomyelin | ↓ | serum | after a 10-hour overnight fast | GC-MS; LC-MS | Cross-sectional | [90] | |
| ↑ | serum | in the morning | UPLC-MS | Cross-sectional | [92] | ||
| ↓ | plasma | overnight fast of at least 8 h | FIA-MS/MS; LC-MS/MS | Cross-sectional | [68] | ||
| Deoxycholic acid | ↑ | plasma, serum | NR | LC-MS/MS | Prospective | [13] | |
| ↑ | serum | in the morning | UPLC-MS | Cross-sectional | [92] | ||
| Chenodeoxycholic acid | ↑ | plasma | following a standardized overnight fast | UPLC-QTOF-MS | Cross-sectional | [12] | |
| ↑ | serum | in the morning | UPLC-MS | Cross-sectional | [92] | ||
| Myristic acid | ↑ | serum | after a 10-hour overnight fast | GC-MS; LC-MS | Cross-sectional | [90] | |
| Oleic acid ester | ↑ | plasma | following a standardized overnight fast | UPLC-QTOF-MS | Cross-sectional | [12] | |
| Docosahexaenoic acid | ↓ | plasma | NR | UHPLC-MS/MS; GC-MS/MS | Prospective | [66] | |
| 3-Hydroxybutyrylcarnitine | ↑ | plasma | fasting | LC-MS/MS | Cross-sectional | [54] | |
| LysoPC(14:0) | ↑ | plasma | after a 12-h fasting period | UPLC-QTOF-MS | Cross-sectional | [70] | |
| Decanoylcarnitine | ↑ | plasma | after a 12-h fasting period | UPLC-QTOF-MS | Cross-sectional | [70] | |
| Glycocholic acid | ↓ | fecal | fasting | LC-MS; GC-MS | Cross-sectional | [100] | |
| VLDL | ↑ | plasma | NR | NMR | Prospective | [65] | |
| HDL cholesterol | ↓ | plasma | NR | NMR | Prospective | [65] | |
| Cholesterol sulfate | ↑ | serum | in the morning | UPLC-MS | Cross-sectional | [92] | |
| Diacylglycerol | ↓ | plasma | Overnight fasting | LC-MS | Prospective | [79] | |
| Organic acid | α-hydroxybutyric acid | ↑ | plasma | not eating or drinking since 8:00 the night before (≥10h) | LC-MS; LC-MS | Cross-sectional /Prospective | [48,62] |
| ↑ | CSF | not eating or drinking since 8:00 the night before (≥10h) | NMR | Cross-sectional | [101] | ||
| ↓ | saliva | in the afternoon | UHPLC-MS/MS; GC-MS/MS | Cross-sectional | [98] | ||
| ↑ | serum | fasting | UHPLC-MS; GC-MS; UHPLC-MS/MS | Prospective | [86] | ||
| ↑ | saliva | fasting | LC-MS; GC-MS | Cross-sectional | [97] | ||
| 3-Hydroxybutyric acid | ↑ | serum | after a 10-hour overnight fast; mostly non-fasting | GC-MS; LC-MS; NMR | Cross-sectional/ Prospective | [90,102] | |
| ↑ | plasma | overnight fast of at least 8 h; mostly non-fasting | FIA-MS/MS; LC-MS/MS; NMR | Cross-sectional/ Prospective | [68,102] | ||
| Pyruvic acid | ↓ | serum | after a 10-hour overnight fast | GC-MS; LC-MS | Cross-sectional | [90] | |
| ↑ | serum | mostly non-fasting | NMR | Prospective | [102] | ||
| ↑ | CSF | Fasting | NMR | Cross-sectional | [101] | ||
| ↑ | plasma | fasting (≥8 h); mostly non-fasting | NR; NMR | Prospective/ Prospective | [63,102] | ||
| Acetic acid | ↑ | plasma | Fasting | NMR | Cross-sectional | [101] | |
| ↓ | plasma | mostly non-fasting | NMR | Prospective | [102] | ||
| ↓ | serum | mostly non-fasting | NMR | Prospective | [102] | ||
| Citric acid | ↓ | plasma | Fasting | NMR | Cross-sectional | [101] | |
| ↑ | plasma | mostly non-fasting | NMR | Prospective | [102] | ||
| ↑ | serum | mostly non-fasting | NMR | Prospective | [102] | ||
| Lactic acid | ↑ | plasma | mostly non-fasting | NMR | Prospective | [102] | |
| ↑ | serum | mostly non-fasting | NMR | Prospective | [102] | ||
| ↑ | CSF | Fasting | NMR | Cross-sectional | [101] | ||
| Trimethyluric acid | ↑ | plasma | overnight fast of at least 8 h | FIA-MS/MS; LC-MS/MS | Cross-sectional | [68] | |
| Ethyl lactate | ↑ | serum | at 7:00-8:30 AM after an overnight fast | UHPLC/Q-Orbitrap-HRMS | Cross-sectional | [58] | |
| 2-Hydroxy-2,4-pentadienoic acid | ↑ | serum | at 7:00-8:30 AM after an overnight fast | UHPLC/Q-Orbitrap-HRMS | Cross-sectional | [58] | |
| Isocitric acid | ↑ | plasma | fasting (≥8 h) | NR | Prospective | [63] | |
| 3-Methyl-2-oxobutyrate | ↑ | serum | after 12 hours of fasting | NR | Cross-sectional | [87] | |
| Nucleotide | Uric acid | ↑ | plasma | fasting | LC-MS | Prospective | [62] |
| ↓ | urine | following a standardized overnight fast | UPLC-QTOF-MS | Cross-sectional | [12] | ||
| Xanthine | ↑ | plasma | fasting | LC-MS | Prospective | [62] | |
| ↑ | urine | following a standardized overnight fast | UPLC-QTOF-MS | Cross-sectional | [12] | ||
| Methyluric acid | ↓ | urine | following a standardized overnight fast | UPLC-QTOF-MS | Cross-sectional | [12] | |
| Methylxanthine | ↓ | urine | following a standardized overnight fast | UPLC-QTOF-MS | Cross-sectional | [12] | |
| Carbohydrates | Fructose | ↑ | serum | after a 10-hour overnight fast | GC-MS; LC-MS | Cross-sectional | [90] |
| ↓ | saliva | in the afternoon | UHPLC-MS/MS; GC-MS/MS | Cross-sectional | [98] | ||
| 1,5-Anhydroglucitol | ↓ | plasma | NR | UHPLC-MS/MS; GC-MS/MS | Prospective | [66] | |
| ↓ | saliva | fasting; in the afternoon | GC-MS; LC-MS; UHPLC-MS/MS; GC-MS/MS | Cross-sectional | [97,98] | ||
| Mannose | ↑ | plasma | NR | UHPLC-MS/MS; GC-MS/MS | Prospective | [66] | |
| ↓ | saliva | in the afternoon | UHPLC-MS/MS; GC-MS/MS | Cross-sectional | [98] | ||
| ↑ | serum | Fasting; after 12 h fasting, in the morning | UHPLC-MS; GC-MS; UHPLC-MS/MS; NMR | Prospective/ Cross-sectional | [86,103] | ||
| ↑ | CSF | fasting | NMR | Cross-sectional | [101] | ||
| Glucose | ↑ | serum | Fasting; after 12 h fasting, in the morning; mostly non-fasting | UHPLC-MS; GC-MS; UHPLC-MS/MS; NMR | Prospective /Cross-sectional/Prospective | [86,103,102] | |
| ↑ | plasma | mostly non-fasting | NMR | Prospective | [102] | ||
| ↑ | saliva | fasting | LC-MS; GC-MS | Cross-sectional | [97] | ||
| ↑ | saliva | in the afternoon | UHPLC-MS/MS; GC-MS/MS | Cross-sectional | [98] | ||
| L-Arabinose | ↓ | serum | at 7:00-8:30 AM after an overnight fast | UHPLC/Q-Orbitrap-HRMS | Cross-sectional | [58] | |
| ↓ | saliva | in the afternoon | UHPLC-MS/MS; GC-MS/MS | Cross-sectional | [98] | ||
| N-acetylglycoprotein | ↑ | plasma | Fasting; non-fasting | NMR; NMR | Cross-sectional/ Prospective | [101,104] |
NR: Data not reported in the original publication; MS: Mass Spectrometry; FIA-MS/MS: Flow Injection Analysis-Tandem Mass Spectrometry; GC-MS: Gas Chromatography-Mass Spectrometry; GC-MS/MS: Gas Chromatography-Tandem Mass Spectrometry; LC-MS: Liquid Chromatography-Mass Spectrometry; LC-MS/MS: Liquid Chromatography-Tandem Mass Spectrometry; NMR: Nuclear Magnetic Resonance Spectroscopy; UPLC: Ultra Performance Liquid Chromatography; UPLC-MS: Ultra Performance Liquid Chromatography-Mass Spectrometry; UPLC-QTOF-MS: Ultra Performance Liquid Chromatography-Quadrupole Time-of-Flight Mass Spectrometry; UHPLC-MS: Ultra High Performance Liquid Chromatography-Mass Spectrometry; UHPLC-MS/MS: Ultra High Performance Liquid Chromatography-Tandem Mass Spectrometry; UHPLC/Q-Orbitrap-HRMS: Ultra High Performance Liquid Chromatography/Quadrupole-Orbitrap High Resolution Mass Spectrometry.
Note: Serum and plasma are presented separately in Table 3, but were grouped together as “blood” in Figure 6.
Venn diagram illustrating the overlap of metabolites associated with the early prediction and diagnosis of T2DM. The numbers within each section represent the count of unique or shared metabolites identified across the 66 reviewed studies. In this figure, “blood” refers to the combined category of serum and plasma. Due to the limited number of reported overlapping metabolites in fecal and CSF studies, Figure 6 focuses on the three sample types with sufficient comparative data: blood, urine, and saliva. Blue, red, and green circles correspond to blood, urine, and saliva samples, respectively.
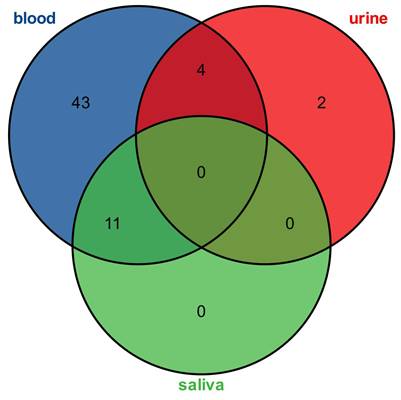
A summary of the 66 studies in Table 3 shows that valine and phenylalanine were among the most frequently reported upregulated metabolites, whereas glycine was frequently reported as downregulated, particularly in blood-based studies. However, the direction of glycine change was not uniform across all sample types, as an opposite trend was reported in CSF. Branched-chain and aromatic amino acids showed relatively consistent directional trends across studies, although matrix-specific variability was observed for some metabolites, suggesting that they represent some of the most consistently reported candidate biomarkers for early-stage T2DM.
It should be noted that predictive and diagnostic studies (prospective and cross-sectional studies) reflect biologically different disease states. Prospective studies relate to future risk prediction, whereas cross-sectional studies relate to the diagnosis of prevalent prediabetes or early T2DM. However, taken together, they offer complementary insights into metabolic changes relevant to early detection of T2DM. In this review, the study design of each included article is explicitly indicated in Supplementary Table S1, which provides a transparent overview of key study-level information.
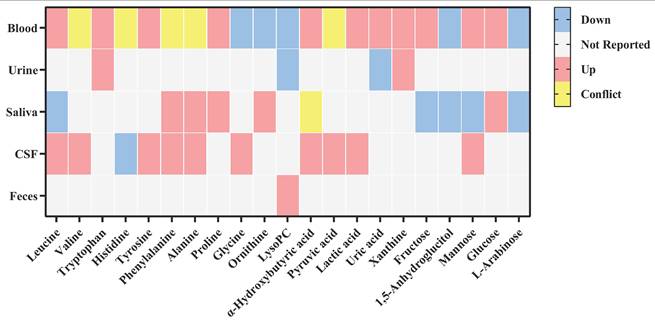
To further analyze the expression characteristics of metabolic biomarkers across different samples, we screened core metabolites that appeared in two or more sample types from 66 included studies and constructed an expression characteristic heatmap (Figure 7). The strength of evidence for each metabolite varies across the literature. For example, phenylalanine [54, 57, 64, 67, 88-90, 98, 101], alanine [54, 63, 64, 68, 90, 98, 101, 103], and valine [48, 54, 57, 67, 69, 90, 101, 103] were reported in 9, 8, and 8 independent studies, respectively, indicating relatively consistent findings across studies. These key metabolites were reported across both study designs. This may suggest that the metabolic dysregulation they reflect, particularly in amino acid metabolism, is not restricted to a specific disease stage. Instead, it appears to be a continuum from early insulin resistance to established T2DM. Therefore, these markers may be valuable both for predicting future risk and for diagnosing metabolic disruption in its early clinical phases. With this context in mind, the heatmap suggests several patterns, although the level of supporting evidence differs markedly among metabolites and sample types. In the amino acid pathway, leucine, valine, and tyrosine were upregulated in both blood and cerebrospinal fluid, whereas glycine showed opposite directions between blood and CSF. In lipid metabolism, lysophosphatidylcholine was downregulated in blood and urine but upregulated in feces. Among carbohydrate-related metabolites, glucose and 1,5-AG showed similar directional changes in blood and saliva, while mannose exhibited opposite trends. Uric acid was increased in blood but decreased in urine. However, it should be noted that findings for urine, saliva, fecal, and CSF matrices are based on a very limited number of studies; therefore, these cross-matrix patterns should be interpreted with caution and require further validation in larger cohorts.
Heatmap of abundance trends for core metabolites across multiple biological samples. The heatmap displays representative metabolites reported in at least two distinct sample types among the 66 included studies. The colors indicate the direction of metabolite level changes in T2DM/Prediabetes groups compared to controls: Red represents upregulation; Blue represents downregulation; Yellow indicates conflicting results across different studies (both up- and downregulation reported); and White denotes that the metabolite was not reported or detected in that specific sample type.
The distinct metabolic characteristics offer significant evidence for the multidimensional prediction of T2DM. Metabolomics testing results are influenced by factors including individual differences [61,56], sample type [82,101], collection time [55], and gender [122], demonstrating distinct personalized characteristics. The observed differences may arise from multiple factors, such as sample collection procedures, methods, timing, fasting status, processing and storage conditions, and testing techniques. In metabolomics research, it is essential to strictly control experimental variables and standardize operational procedures to ensure the reliability of results.
Currently, metabolomics has advanced considerably in the early prediction and diagnosis of T2DM; however, several limitations persist. Firstly, current research predominantly employs a singular sample type, with a heavy emphasis on blood analysis, while other biological samples that permit non-invasive collection receive inadequate attention. This limitation may impede the thorough investigation of metabolic biomarkers associated with diabetes. Secondly, metabolomics research is characterized by a lack of standardization in sample collection and testing protocols, resulting in inconsistencies in the identification of essential biomarkers. Variations in the process increase the incomparability between studies and interfere with the determination of diabetes biomarkers. Finally, due to medical ethical constraints, the routine acquisition of certain invasive samples in human studies is challenging. Consequently, metabolomics data from cerebrospinal fluid, tissue biopsies, and other sources predominantly derive from animal experimental models [148]. Sample acquisition limitations present challenges to the discovery and validation of disease-specific metabolic markers in humans, potentially impacting the reliability of research conclusions. In addition, as a narrative review, the included studies varied substantially in design, sample type, analytical platform, and study objectives; therefore, a formal standardized risk-of-bias assessment using a single tool was not performed.
To advance metabolomics research for the prediction and early diagnosis of T2DM, future studies should focus on addressing existing challenges in the following areas:
(a) Explore diverse biological samples. Most current human studies predominantly use blood (serum/plasma), whereas only a very small number investigate urine, saliva, feces, or cerebrospinal fluid. At present, available evidence is insufficient to determine whether combining multiple sample types improves T2DM prediction compared with single-matrix approaches. Given that different biofluids may reflect distinct metabolic processes, exploring multi-sample strategies therefore emerges as a particularly promising research direction. Future studies should investigate, in adequately powered cohorts, whether biomarker combinations across different matrices can improve early diabetes prediction beyond blood-based markers alone.
(b) Promote standardized operational procedures. A key finding from our review is that methodological heterogeneity may partly account for inconsistencies in reported biomarkers. Standardization is important because differences in sample matrix, collection time, fasting status, storage conditions, analytical platform, and data processing can directly affect the comparability of metabolomic findings across studies, thereby limiting biomarker reproducibility. For example, in serum, phenylalanine was reported as upregulated when analyzed by GC-MS or LC-MS [90,57], but downregulated when NMR was used [88]; similarly, in plasma, alanine was found to be upregulated by NMR [101], yet downregulated by FIA-MS/MS [68]. Although these discordant findings may also reflect differences in population characteristics, fasting status, or study design, they suggest that analytical platform and pre-analytical handling can materially influence the reported associations. However, because these discordant findings were derived from studies conducted in different countries and populations, the current literature does not allow us to determine definitively whether the observed inconsistencies are primarily attributable to analytical methods rather than biological differences. In addition, many included studies did not provide sufficient detail regarding collection time, storage temperature, storage duration, freeze-thaw conditions, metabolite identification standards, calibration procedures, or quality-control workflows, making it difficult to determine whether between-study differences reflect true biological variation or technical variation. Future dedicated methodological studies or reviews are needed to systematically address this gap and to establish consensus guidelines for pre-analytical and analytical standardization in T2DM metabolomics research.
(c) Strengthen animal model research. This review focused exclusively on human studies, and animal model research was not systematically assessed. However, several limitations identified in the reviewed literature highlight the need for animal studies. While numerous candidate biomarkers have been associated with T2DM risk in observational human cohorts, the causal metabolic pathways underlying these associations remain largely unclear. Animal models can circumvent the ethical and technical constraints associated with acquiring invasive human tissues and facilitate mechanistic investigations under controlled experimental conditions. Future research should clarify which specific biomarker-pathway relationships identified in human metabolomics studies require validation through animal experiments, particularly for metabolites whose mechanistic roles in insulin resistance and beta-cell dysfunction remain speculative.
(d) Advance the integration of personalized medicine and TCM. Among the reviewed studies, metabolomic analyses were predominantly conducted at the population level, with only a few studies attempting to perform personalized analyses. This represents a significant limitation, as metabolite profiles are known to vary considerably across these subgroups. Currently, the clinical application of metabolomics-based personalized medicine for T2DM remains in its infancy, and no study in this review demonstrated a complete pathway from biomarker discovery to individualized clinical decision-making. One emerging approach in this direction is the integration of metabolomics with Traditional Chinese Medicine (TCM) syndrome differentiation. Studies by Wei et al. [52] and He et al. [149] have attempted to identify metabolic subtypes corresponding to specific TCM syndromes in prediabetic populations, suggesting that metabolomics may provide an objective molecular basis for TCM classification. However, these efforts remain preliminary, with small sample sizes and limited external validation. Future research should further explore this synergy in larger, more diverse populations to enhance the precision of early diabetes prediction and advance personalized prevention strategies.
(e) Integrate multi-omics data and machine learning. Currently, the research frontier is expanding from single-omics to the integrated analysis of multi-omics data. For example, a recent study successfully constructed a model to predict diabetes progression by integrating metabolomic, lipidomic, and proteomic data and applying multiple machine learning algorithms, including LASSO, ridge regression, and random forests [150]. This study confirmed that even though models built using classical clinical indicators such as age, BMI, and HbA1c already demonstrate good predictive performance, the discriminative ability of the models can be further enhanced by incorporating multi-omics molecular information, thereby verifying the independent incremental predictive value of molecular markers relative to traditional risk factors. To strengthen the molecular foundation for early intervention, future research should focus on promoting deeper integration of multi-omics data and the continuous optimization of intelligent predictive models [151]. In this process, rigorous external validation in independent cohorts is essential for improving the reliability of risk assessment and advancing the clinical translation of precision interventions.
(f) Accelerate clinical translation of metabolomic findings. A critical gap identified in this review is the distance between biomarker discovery and clinical application. Among the human studies reviewed here, a small number conducted external validation in independent cohorts, but none progressed to the development of clinically deployable diagnostic tools or implementation in clinical practice. Clinical translation requires additional steps including large-scale multi-center validation, regulatory approval, and industry collaboration, processes beyond the scope of typical metabolomics research. While commercial assays such as the Quantose™ IR test [152] have demonstrated feasibility, widely accessible tools like point-of-care devices remain scarce [153]. Future efforts should prioritize multi-center validation of consistently identified biomarkers and foster collaboration among researchers, clinicians, and industry partners to bridge the gap between discovery and clinical application.
8. Conclusion
In the study of T2DM, metabolomics has emerged as a pivotal tool for early diagnosis and disease prediction. To identify novel biomarkers, elucidate underlying mechanisms of pathogenesis, and clarify the causal relationships of metabolic abnormalities, future research must prioritize conducting additional multicenter, large-scale cohort studies. These studies should investigate metabolic profiles across diverse populations and distinct disease stages. Ultimately, this will be instrumental in translating metabolomic discoveries from basic research into clinical practice, enabling early warning for T2DM.
Supplementary Material
Supplementary table.

Acknowledgements
The authors would like to thank BioRender for providing a great platform to create beautiful schematic diagrams for scientific publications.
Funding
This research was supported by the National Natural Science Foundation of China (Grant No. T2341021); Jilin Provincial Scientific and Technological Development Program (Grant No. YDZJ202502CXJD079).
Author contributions
Xiaokai Wei: Conceptualization, Methodology, Writing - original draft. Min He: Investigation, Writing - original draft, Project administration. Haili Wang: Supervision. Xin Xiang: Supervision. Mengyuan Li: Investigation, Formal analysis. Mengmeng Li: Investigation, Formal analysis. Thanh Tuan Vu Le: Investigation, Formal analysis. Zhongxian Wang: Data curation, Methodology. Dingqi Zhang: Data curation, Methodology. Lei Cheng: Data curation, Methodology. Mengmeng Sun: Supervision, Writing - review & editing. Hongfeng Wang: Funding acquisition, Writing - review & editing.
AI usage statement
During the preparation of this work, the authors used Gemini (Google AI) to improve the readability and language of the manuscript. After using this tool, the authors reviewed and edited the content as needed and take full responsibility for the content of the published article.
Competing Interests
The authors have declared that no competing interest exists.
References
1. Zimmet PZ, Magliano DJ, Herman WH, Shaw JE. Diabetes: a 21st century challenge. Lancet Diabetes Endocrinol. 2014;2:56-64
2. Finer S, Robb P, Cowan K, Daly A, Robertson E, Farmer A. Top ten research priorities for type 2 diabetes: results from the Diabetes UK-James Lind Alliance Priority Setting Partnership. Lancet Diabetes Endocrinol. 2017;5:935-6
3. American Diabetes Association Professional Practice Committee. 2. Diagnosis and Classification of Diabetes: Standards of Care in Diabetes-2024. Diabetes Care. 2024;47:S20-42
4. Robertson S, Clarke ED, Gómez-Martín M, Cross V, Collins CE, Stanford J. Do Precision and Personalised Nutrition Interventions Improve Risk Factors in Adults with Prediabetes or Metabolic Syndrome? A Systematic Review of Randomised Controlled Trials. Nutrients. 2024;16:1479
5. Knowler WC, Barrett-Connor E, Fowler SE. et al. Reduction in the incidence of type 2 diabetes with lifestyle intervention or metformin. N Engl J Med. 2002;346:393-403
6. Zhang X, Wu H, Fan B. et al. Lifetime risk of developing diabetes in Chinese people with normoglycemia or prediabetes: A modeling study. PLOS Med. 2022;19:e1004045
7. Walford GA, Porneala BC, Dauriz M. et al. Metabolite Traits and Genetic Risk Provide Complementary Information for the Prediction of Future Type 2 Diabetes. Diabetes Care. 2014;37:2508-14
8. Li X, Li Y, Liang Y, Hu R, Xu W, Liu Y. Plasma Targeted Metabolomics Analysis for Amino Acids and Acylcarnitines in Patients with Prediabetes, Type 2 Diabetes Mellitus, and Diabetic Vascular Complications. Diabetes Metab J. 2021;45:195-208
9. Di Minno A, Gelzo M, Caterino M, Costanzo M, Ruoppolo M, Castaldo G. Challenges in Metabolomics-Based Tests, Biomarkers Revealed by Metabolomic Analysis, and the Promise of the Application of Metabolomics in Precision Medicine. Int J Mol Sci. 2022;23:5213
10. Buergel T, Steinfeldt J, Ruyoga G. et al. Metabolomic profiles predict individual multidisease outcomes. Nat Med. 2022;28:2309-20
11. Ji W, Xie X, Bai G. et al. Metabolomic approaches to dissect dysregulated metabolism in the progression of pre-diabetes to T2DM. Mol Omics. 2024;20:333-47
12. Zhao X, Fritsche J, Wang J. et al. Metabonomic fingerprints of fasting plasma and spot urine reveal human pre-diabetic metabolic traits. Metabolomics. 2010;6:362-74
13. Fall T, Salihovic S, Brandmaier S. et al. Non-targeted metabolomics combined with genetic analyses identifies bile acid synthesis and phospholipid metabolism as being associated with incident type 2 diabetes. Diabetologia. 2016;59:2114-24
14. Goodrich JA, Wang H, Walker DI. et al. Postprandial Metabolite Profiles and Risk of Prediabetes in Young People: A Longitudinal Multicohort Study. Diabetes Care. 2024;47:151-9
15. Leiherer A, Muendlein A, Mink S. et al. Machine Learning Approach to Metabolomic Data Predicts Type 2 Diabetes Mellitus Incidence. Int J Mol Sci. 2024;25:5331
16. Fiehn O. Metabolomics - the link between genotypes and phenotypes. Plant Mol Biol. 2002;48:155-71
17. Pebriana RB, Sánchez-López E, Giera M. (Pre)Clinical Metabolomics Analysis. Methods Mol Biol. 2025;2855:3-19
18. Bujak R, Struck-Lewicka W, Markuszewski MJ, Kaliszan R. Metabolomics for laboratory diagnostics. J Pharm Biomed Anal. 2015;113:108-20
19. Schrimpe-Rutledge AC, Codreanu SG, Sherrod SD, McLean JA. Untargeted Metabolomics Strategies-Challenges and Emerging Directions. J Am Soc Mass Spectrom. 2016;27:1897-905
20. Ribbenstedt A, Ziarrusta H, Benskin JP. Development, characterization and comparisons of targeted and non-targeted metabolomics methods. PLOS ONE. 2018;13:e0207082
21. Sun Y, Zhang X, Hang D. et al. Integrative plasma and fecal metabolomics identify functional metabolites in adenoma-colorectal cancer progression and as early diagnostic biomarkers. Cancer Cell. 2024;42:1386-1400.e8
22. Vich Vila A, Zhang J, Liu M, Faber KN, Weersma RK. Untargeted faecal metabolomics for the discovery of biomarkers and treatment targets for inflammatory bowel diseases. Gut. 2024;73:1909-20
23. Dunn WB, Broadhurst D, Begley P. et al. Procedures for large-scale metabolic profiling of serum and plasma using gas chromatography and liquid chromatography coupled to mass spectrometry. Nat Protoc. 2011;6:1060-83
24. Pirhaji L, Milani P, Leidl M. et al. Revealing disease-associated pathways by network integration of untargeted metabolomics. Nat Methods. 2016;13:770-6
25. Cai Y, Zhou Z, Zhu Z-J. Advanced analytical and informatic strategies for metabolite annotation in untargeted metabolomics. TrAC Trends Anal Chem. 2023;158:116903
26. Johnson CH, Ivanisevic J, Siuzdak G. Metabolomics: beyond biomarkers and towards mechanisms. Nat Rev Mol Cell Biol. 2016;17:451-9
27. Roberts LD, Souza AL, Gerszten RE, Clish CB. Targeted metabolomics. Curr Protoc Mol Biol. 2012 Chapter 30: Unit 30.2.1-24
28. Lin C, Tian Q, Guo S. et al. Metabolomics for Clinical Biomarker Discovery and Therapeutic Target Identification. Molecules. 2024;29:2198
29. Spratlin JL, Serkova NJ, Eckhardt SG. Clinical Applications of Metabolomics in Oncology: A Review. Clin Cancer Res. 2009;15:431-40
30. Markley JL, Brüschweiler R, Edison AS. et al. The future of NMR-based metabolomics. Curr Opin Biotechnol. 2017;43:34-40
31. Salmerón AM, Tristán AI, Abreu AC, Fernández I. Serum Colorectal Cancer Biomarkers Unraveled by NMR Metabolomics: Past, Present, and Future. Anal Chem. 2022;94:417-30
32. Soga T. Advances in capillary electrophoresis mass spectrometry for metabolomics. TrAC Trends Anal Chem. 2023;158:116883
33. Wishart DS. Emerging applications of metabolomics in drug discovery and precision medicine. Nat Rev Drug Discov. 2016;15:473-84
34. Fiehn O, Kopka J, Dörmann P, Altmann T, Trethewey RN, Willmitzer L. Metabolite profiling for plant functional genomics. Nat Biotechnol. 2000;18:1157-61
35. Ramautar R, Somsen GW, Jong GJ de. CE-MS in metabolomics. Electrophoresis. 2009;30:276-91
36. Rodríguez-Morató J, Pozo ÓJ, Marcos J. Targeting Human Urinary Metabolome by LC-MS/MS: A Review. Bioanalysis. 2018;10:489-516
37. Wang Y, Sun Y, Wang Y. et al. Urine metabolomics phenotyping and urinary biomarker exploratory in mild cognitive impairment and Alzheimer's disease. Front Aging Neurosci. 2023;15:1273807
38. Pan X, Chandrasekaran S, Woodside JV. et al. Development, validation and application of an LC-MS/MS method quantifying free forms of the micronutrients queuine and queuosine in human plasma using a surrogate matrix approach. Anal Bioanal Chem. 2024;416:5711-9
39. Gong S, Wang Q, Huang J. et al. LC-MS/MS platform-based serum untargeted screening reveals the diagnostic biomarker panel and molecular mechanism of breast cancer. Methods. 2024;222:100-111
40. Hirayama A, Igarashi K, Tomita M, Soga T. Development of quantitative method for determination of γ-glutamyl peptides by capillary electrophoresis tandem mass spectrometry: An efficient approach avoiding matrix effect. J Chromatogr A. 2014;1369:161-9
41. Kautzky-Willer A, Leutner M, Harreiter J. Sex differences in type 2 diabetes. Diabetologia. 2023;66:986-1002
42. Delaney KZ, Santosa S. Sex differences in regional adipose tissue depots pose different threats for the development of Type 2 diabetes in males and females. Obes Rev. 2022;23:e13393
43. World Health Organization, International Diabetes Federation. Definition and diagnosis of diabetes mellitus and intermediate hyperglycaemia: report of a WHO/IDF consultation. World Health Organization. 2006
44. American Diabetes Association Professional Practice Committee. 2. Diagnosis and Classification of Diabetes: Standards of Care in Diabetes-2025. Diabetes Care. 2025;48:S27-49
45. International Diabetes Federation. IDF global clinical practice recommendations for managing type 2 diabetes - 2025. Diabetes Res Clin Pract. 2025;222:112152
46. Wittenbecher C, Guasch-Ferré M, Haslam DE. et al. Changes in metabolomics profiles over ten years and subsequent risk of developing type 2 diabetes: Results from the Nurses' Health Study. eBioMedicine. 2022;75:103799
47. Tulipani S, Palau-Rodriguez M, Miñarro Alonso A. et al. Biomarkers of Morbid Obesity and Prediabetes by Metabolomic Profiling of Human Discordant Phenotypes. Clin Chim Acta. 2016;463:53-61
48. Fiehn O, Garvey WT, Newman JW, Lok KH, Hoppel CL, Adams SH. Plasma Metabolomic Profiles Reflective of Glucose Homeostasis in Non-Diabetic and Type 2 Diabetic Obese African-American Women. PLoS ONE. 2010;5:e15234
49. Ferrannini E, Natali A, Camastra S. et al. Early Metabolic Markers of the Development of Dysglycemia and Type 2 Diabetes and Their Physiological Significance. Diabetes. 2013;62:1730-7
50. Zhou W, Sailani MR, Contrepois K. et al. Longitudinal multi-omics of host-microbe dynamics in prediabetes. Nature. 2019;569:663-71
51. Zhao J, Zhu Y, Hyun N. et al. Novel Metabolic Markers for the Risk of Diabetes Development in American Indians. Diabetes Care. 2015;38:220-7
52. Wei H, Pasman W, Rubingh C. et al. Urine metabolomics combined with the personalized diagnosis guided by Chinese medicine reveals subtypes of pre-diabetes. Mol Biosyst. 2012;8:1482
53. Xuan Q, Hu C, Zhang Y. et al. Serum lipidomics profiles reveal potential lipid markers for prediabetes and type 2 diabetes in patients from multiple communities. Front Endocrinol. 2022;13:966823
54. Hosseinkhani S, Arjmand B, Dilmaghani-Marand A. et al. Targeted metabolomics analysis of amino acids and acylcarnitines as risk markers for diabetes by LC-MS/MS technique. Sci Rep. 2022;12:8418
55. Wildberg C, Masuch A, Budde K. et al. Plasma Metabolomics to Identify and Stratify Patients With Impaired Glucose Tolerance. J Clin Endocrinol Metab. 2019;104:6357-70
56. Zhong H, Fang C, Fan Y. et al. Lipidomic profiling reveals distinct differences in plasma lipid composition in healthy, prediabetic, and type 2 diabetic individuals. GigaScience. 2017;6:1-12
57. Lu Y, Wang Y, Ong C-N. et al. Metabolic signatures and risk of type 2 diabetes in a Chinese population: an untargeted metabolomics study using both LC-MS and GC-MS. Diabetologia. 2016;59:2349-59
58. Long J, Liu L, Jia Q. et al. Integrated biomarker for type 2 diabetes mellitus and impaired fasting glucose based on metabolomics analysis using ultra-high performance liquid chromatography quadrupole-Orbitrap high-resolution accurate mass spectrometry. Rapid Commun Mass Spectrom. 2020;34:e8779
59. Savolainen O, Fagerberg B, Vendelbo Lind M, Sandberg A-S, Ross AB, Bergström G. Biomarkers for predicting type 2 diabetes development-Can metabolomics improve on existing biomarkers? PLOS ONE. 2017;12:e0177738
60. Bragg F, Trichia E, Aguilar-Ramirez D, Bešević J, Lewington S, Emberson J. Predictive value of circulating NMR metabolic biomarkers for type 2 diabetes risk in the UK Biobank study. BMC Med. 2022;20:159
61. Ahola-Olli AV, Mustelin L, Kalimeri M. et al. Circulating metabolites and the risk of type 2 diabetes: a prospective study of 11,896 young adults from four Finnish cohorts. Diabetologia. 2019;62:2298-309
62. Vangipurapu J, Fernandes Silva L, Kuulasmaa T, Smith U, Laakso M. Microbiota-Related Metabolites and the Risk of Type 2 Diabetes. Diabetes Care. 2020;43:1319-25
63. Guasch-Ferré M, Santos JL, Martínez-González MA. et al. Glycolysis/gluconeogenesis- and tricarboxylic acid cycle-related metabolites, Mediterranean diet, and type 2 diabetes. Am J Clin Nutr. 2020;111:835-44
64. Qiu G, Zheng Y, Wang H. et al. Plasma metabolomics identified novel metabolites associated with risk of type 2 diabetes in two prospective cohorts of Chinese adults. Int J Epidemiol. 2016;45:1507-16
65. Bragg F, Kartsonaki C, Guo Y. et al. Circulating Metabolites and the Development of Type 2 Diabetes in Chinese Adults. Diabetes Care. 2022;45:477-80
66. Yu D, Moore SC, Matthews CE. et al. Plasma metabolomic profiles in association with type 2 diabetes risk and prevalence in Chinese adults. Metabolomics. 2016;12:3
67. Kim M, Kim M, Han JY, Lee S-H, Jee SH, Lee JH. The metabolites in peripheral blood mononuclear cells showed greater differences between patients with impaired fasting glucose or type 2 diabetes and healthy controls than those in plasma. Diab Vasc Dis Res. 2017;14:130-8
68. Fikri AM, Smyth R, Kumar V, Al-Abadla Z, Abusnana S, Munday MR. Pre-diagnostic biomarkers of type 2 diabetes identified in the UAE's obese national population using targeted metabolomics. Sci Rep. 2020;10:17616
69. Jabbar Al-Rikabi SA, Etemadi A, Morad MM. et al. Metabolomics Signature in Prediabetes and Diabetes: Insights from Tandem Mass Spectrometry Analysis. Endocrinol Diabetes Metab. 2024;7:e00484
70. Ha CY, Kim JY, Paik JK. et al. The association of specific metabolites of lipid metabolism with markers of oxidative stress, inflammation and arterial stiffness in men with newly diagnosed type 2 diabetes. Clin Endocrinol (Oxf). 2012;76:674-82
71. Cobb J, Eckhart A, Perichon R. et al. A Novel Test for IGT Utilizing Metabolite Markers of Glucose Tolerance. J Diabetes Sci Technol. 2015;9:69-76
72. Carter TC, Rein D, Padberg I. et al. Validation of a metabolite panel for early diagnosis of type 2 diabetes. Metabolism. 2016;65:1399-408
73. Zeng H, Tong R, Tong W. et al. Metabolic Biomarkers for Prognostic Prediction of Pre-diabetes: results from a longitudinal cohort study. Sci Rep. 2017;7:6575
74. Merino J, Leong A, Liu C-T. et al. Metabolomics insights into early type 2 diabetes pathogenesis and detection in individuals with normal fasting glucose. Diabetologia. 2018;61:1315-24
75. Libert DM, Nowacki AS, Natowicz MR. Metabolomic analysis of obesity, metabolic syndrome, and type 2 diabetes: amino acid and acylcarnitine levels change along a spectrum of metabolic wellness. PeerJ. 2018;6:e5410
76. Li-Gao R, De Mutsert R, Rensen PCN. et al. Postprandial metabolite profiles associated with type 2 diabetes clearly stratify individuals with impaired fasting glucose. Metabolomics. 2018;14:13
77. Owei I, Umekwe N, Stentz F, Wan J, Dagogo-Jack S. Amino acid signature predictive of incident prediabetes: A case-control study nested within the longitudinal pathobiology of prediabetes in a biracial cohort. Metabolism. 2019;98:76-83
78. Papandreou C, Bulló M, Ruiz-Canela M. et al. Plasma metabolites predict both insulin resistance and incident type 2 diabetes: a metabolomics approach within the Prevención con Dieta Mediterránea (PREDIMED) study. Am J Clin Nutr. 2019;109:626-34
79. Schillemans T, Shi L, Donat-Vargas C. et al. Plasma metabolites associated with exposure to perfluoroalkyl substances and risk of type 2 diabetes - A nested case-control study. Environ Int. 2021;146:106180
80. Ketavarapu V, Addipilli R, Ragi N. et al. Plasma Metabolite Profiling Identifies Nondiabetic Chronic Pancreatitis Patients with Metabolic Alterations Progressing to Prediabetes Before HbA1c. Clin Transl Gastroenterol. 2024;15:e1
81. Liu J, Semiz S, Van Der Lee SJ. et al. Metabolomics based markers predict type 2 diabetes in a 14-year follow-up study. Metabolomics. 2017;13:104
82. Menni C, Fauman E, Erte I. et al. Biomarkers for Type 2 Diabetes and Impaired Fasting Glucose Using a Nontargeted Metabolomics Approach. Diabetes. 2013;62:4270-6
83. Yengo L, Arredouani A, Marre M. et al. Impact of statistical models on the prediction of type 2 diabetes using non-targeted metabolomics profiling. Mol Metab. 2016;5:918-25
84. Al-Aama JY, Al Mahdi HB, Salama MA. et al. Detection of Secondary Metabolites as Biomarkers for the Early Diagnosis and Prevention of Type 2 Diabetes. Diabetes Metab Syndr Obes Targets Ther. 2019;12:2675-84
85. Wang-Sattler R, Yu Z, Herder C. et al. Novel biomarkers for pre-diabetes identified by metabolomics. Mol Syst Biol. 2012;8:615
86. Peddinti G, Cobb J, Yengo L. et al. Early metabolic markers identify potential targets for the prevention of type 2 diabetes. Diabetologia. 2017;60:1740-50
87. Rawshani A, Eliasson B, Rawshani A. et al. Adipose tissue morphology, imaging and metabolomics predicting cardiometabolic risk and family history of type 2 diabetes in non-obese men. Sci Rep. 2020;10:9973
88. Del Coco L, Vergara D, De Matteis S. et al. NMR-Based Metabolomic Approach Tracks Potential Serum Biomarkers of Disease Progression in Patients with Type 2 Diabetes Mellitus. J Clin Med. 2019;8:720
89. Gunther SH, Khoo CM, Tai E-S. et al. Serum acylcarnitines and amino acids and risk of type 2 diabetes in a multiethnic Asian population. BMJ Open Diabetes Res Care. 2020;8:e001315
90. Xu F, Tavintharan S, Sum CF, Woon K, Lim SC, Ong CN. Metabolic Signature Shift in Type 2 Diabetes Mellitus Revealed by Mass Spectrometry-based Metabolomics. J Clin Endocrinol Metab. 2013;98:E1060-5
91. Ciborowski M, Adamska E, Rusak M. et al. CE-MS-based serum fingerprinting to track evolution of type 2 diabetes mellitus. ELECTROPHORESIS. 2015;36:2286-93
92. Zhao Q, Zhang A, Zong W. et al. Exploring potential biomarkers and determining the metabolic mechanism of type 2 diabetes mellitus using liquid chromatography coupled to high-resolution mass spectrometry. RSC Adv. 2017;7:44186-98
93. De Mello VD, Paananen J, Lindström J. et al. Indolepropionic acid and novel lipid metabolites are associated with a lower risk of type 2 diabetes in the Finnish Diabetes Prevention Study. Sci Rep. 2017;7:46337
94. Gu X, Al Dubayee M, Alshahrani A. et al. Distinctive Metabolomics Patterns Associated with Insulin Resistance and Type 2 Diabetes Mellitus. Front Mol Biosci. 2020;7:609806
95. Long J, Yang H, Yang Z. et al. Integrated biomarker profiling of the metabolome associated with impaired fasting glucose and type 2 diabetes mellitus in large-scale Chinese patients. Clin Transl Med. 2021;11:e432
96. Menni C, Zhu J, Le Roy CI. et al. Serum metabolites reflecting gut microbiome alpha diversity predict type 2 diabetes. Gut Microbes. 2020;11:1632-42
97. Barnes VM, Kennedy AD, Panagakos F. et al. Global Metabolomic Analysis of Human Saliva and Plasma from Healthy and Diabetic Subjects, with and without Periodontal Disease. PLoS ONE. 2014;9:e105181
98. Yousri NA, Mook-Kanamori DO, Selim MME-D. et al. A systems view of type 2 diabetes-associated metabolic perturbations in saliva, blood and urine at different timescales of glycaemic control. Diabetologia. 2015;58:1855-67
99. Nuli R, Azhati J, Cai J, Kadeer A, Zhang B, Mohemaiti P. Metagenomics and Faecal Metabolomics Integrative Analysis towards the Impaired Glucose Regulation and Type 2 Diabetes in Uyghur-Related Omics. J Diabetes Res. 2019;2019:1-15
100. Zhao L, Lou H, Peng Y, Chen S, Zhang Y, Li X. Comprehensive relationships between gut microbiome and faecal metabolome in individuals with type 2 diabetes and its complications. Endocrine. 2019;66:526-37
101. Lin H-T, Cheng M-L, Lo C-J. et al. 1H Nuclear Magnetic Resonance (NMR)-Based Cerebrospinal Fluid and Plasma Metabolomic Analysis in Type 2 Diabetic Patients and Risk Prediction for Diabetic Microangiopathy. J Clin Med. 2019;8:874
102. Xie R, Herder C, Sha S. et al. Novel type 2 diabetes prediction score based on traditional risk factors and circulating metabolites: model derivation and validation in two large cohort studies. eClinicalMedicine. 2025;79:102971
103. Trivedi R, Kumar S, Kumar P. et al. NMR-based serum metabolomics and correlation analysis unraveled metabolic alterations underlying pathophysiology of type 2 diabetes mellitus. ACS Omega. 2025;10:37761-37772
104. Liu J, Shang X, Zhang X. et al. Metabolomic network reveals novel biomarkers for type 2 diabetes mellitus in the UK Biobank study. Diabetes Obes Metab. 2025;27:3335-3346
105. Satheesh G, Asokan AK, Vijayakumar G. et al. Early metabolic predictors of type 2 diabetes mellitus in normoglycemic adults: insights from six-year prospective cohort study. Metabolomics. 2025;21:104
106. De Souza HMR, Pereira TTP, De Sá HC, Alves MA, Garrett R, Canuto GAB. Critical Factors in Sample Collection and Preparation for Clinical Metabolomics of Underexplored Biological Specimens. Metabolites. 2024;14:36
107. Nahavandi S, Seah J-M, Shub A, Houlihan C, Ekinci EI. Biomarkers for Macrosomia Prediction in Pregnancies Affected by Diabetes. Front Endocrinol. 2018;9:407
108. Morze J, Wittenbecher C, Schwingshackl L. et al. Metabolomics and Type 2 Diabetes Risk: An Updated Systematic Review and Meta-analysis of Prospective Cohort Studies. Diabetes Care. 2022;45:1013-24
109. Yu Z, Kastenmüller G, He Y. et al. Differences between human plasma and serum metabolite profiles. PLoS ONE. 2011;6:e21230
110. De Bandt J-P, Coumoul X, Barouki R. Branched-Chain Amino Acids and Insulin Resistance, from Protein Supply to Diet-Induced Obesity. Nutrients. 2023;15:68
111. Koopman R, Caldow MK, Ham DJ, Lynch GS. Glycine metabolism in skeletal muscle: implications for metabolic homeostasis. Curr Opin Clin Nutr Metab Care. 2017;20:237-242
112. Rodriguez AE, Ducker GS, Billingham LK. et al. Serine Metabolism Supports Macrophage IL-1β Production. Cell Metab. 2019;29:1003-1011.e4
113. Gall WE, Beebe K, Lawton KA. et al. α-Hydroxybutyrate Is an Early Biomarker of Insulin Resistance and Glucose Intolerance in a Nondiabetic Population. PLOS ONE. 2010;5:e10883
114. Peddinti G, Bergman M, Tuomi T, Groop L. 1-Hour Post-OGTT Glucose Improves the Early Prediction of Type 2 Diabetes by Clinical and Metabolic Markers. J Clin Endocrinol Metab. 2019;104:1131-40
115. Sharma V, Ichikawa M, Freeze HH. Mannose metabolism: More than meets the eye. Biochem Biophys Res Commun. 2014;453:220-8
116. Zhang A, Sun H, Wu X. et al. Urine metabolomics. Clin Chim Acta. 2012;414:65-9
117. Theron IJ, Mason S, van Reenen M. et al. Characterizing poorly controlled type 2 diabetes using 1H-NMR metabolomics. Metabolomics. 2024;20:54
118. Dinges SS, Hohm A, Vandergrift LA. et al. Cancer metabolomic markers in urine: evidence, techniques and recommendations. Nat Rev Urol. 2019;16:339-62
119. Gevi F, Zolla L, Gabriele S, Persico AM. Urinary metabolomics of young Italian autistic children supports abnormal tryptophan and purine metabolism. Mol Autism. 2016;7:47
120. Liang Q, Liu H, Wang C, Li B. Phenotypic Characterization Analysis of Human Hepatocarcinoma by Urine Metabolomics Approach. Sci Rep. 2016;6:19763
121. Salihovic S, Broeckling CD, Ganna A. et al. Non-targeted urine metabolomics and associations with prevalent and incident type 2 diabetes. Sci Rep. 2020;10:16474
122. Friedrich N, Budde K, Suhre K. et al. Sex differences in urine metabolites related with risk of diabetes using NMR spectroscopy: results of the study of health in pomerania. Metabolomics. 2015;11:1405-15
123. Kubala E, Strzelecka P, Grzegocka M. et al. A review of selected studies that determine the physical and chemical properties of saliva in the field of dental treatment. Biomed Res Int. 2018;2018:6572381
124. Kaczor-Urbanowicz KE, Martin Carreras-Presas C, Aro K, Tu M, Garcia-Godoy F, Wong DT. Saliva diagnostics - Current views and directions. Exp Biol Med. 2017;242:459-72
125. Albahri J, Allison H, Whitehead KA, Muhamadali H. The role of salivary metabolomics in chronic periodontitis: bridging oral and systemic diseases. Metabolomics. 2025;21:24
126. Kashyap B, Hyvärinen E, Laitinen I, Kullaa AM. Salivary metabolomics in patients with oral lichen planus: a preliminary study based on NMR spectroscopy. Clin Oral Investig. 2024;28:103
127. Huan T, Tran T, Zheng J. et al. Metabolomics Analyses of Saliva Detect Novel Biomarkers of Alzheimer's Disease. J Alzheimer's Dis. 2018;65:1401-16
128. Kuwabara H, Katsumata K, Iwabuchi A. et al. Salivary metabolomics with machine learning for colorectal cancer detection. Cancer Sci. 2022;113:3234-43
129. Hyvärinen E, Solje E, Vepsäläinen J, Kullaa A, Tynkkynen T. Salivary Metabolomics in the Diagnosis and Monitoring of Neurodegenerative Dementia. Metabolites. 2023;13:233
130. Gardner A, Parkes HG, So PW, Carpenter GH. Determining bacterial and host contributions to the human salivary metabolome. J Oral Microbiol. 2019;11:1617014
131. Calixto PS, Ferraz FC, Dutra GC. et al. Exploring Saliva as a Sample for Non-Invasive Glycemic Monitoring in Diabetes: A Scoping Review. Biomedicines. 2025;13:713
132. Ai J-Y, Smith B, Wong DT. Bioinformatics advances in saliva diagnostics. Int J Oral Sci. 2012;4:85-7
133. Romano F, Meoni G, Manavella V. et al. Analysis of salivary phenotypes of generalized aggressive and chronic periodontitis through nuclear magnetic resonance-based metabolomics. J Periodontol. 2018;89:1452-60
134. Haslam DE, Liang L, Guo K. et al. Discovery and validation of plasma, saliva and multi-fluid plasma-saliva metabolomic scores predicting insulin resistance and diabetes progression or regression among Puerto Rican adults. Diabetologia. 2024;67:1838-52
135. De Bartolo MI, Belvisi D, Mancinelli R. et al. A systematic review of salivary biomarkers in Parkinson's disease. Neural Regen Res. 2024;19:2613-2625
136. Kajiwara N, Kakihana M, Maeda J. et al. Salivary metabolomic biomarkers for non-invasive lung cancer detection. Cancer Sci. 2024;115:1695-705
137. Bosman P, Pichon V, Acevedo AC. et al. Identification of potential salivary biomarkers for Sjögren's syndrome with an untargeted metabolomic approach. Metabolomics. 2023;19:76
138. Yamanouchi T, Akanuma Y. Serum 1,5-anhydroglucitol (1,5 AG): New clinical marker for glycemic control. Diabetes Res Clin Pract. 1994;24:S261-8
139. Hyvärinen E, Savolainen M, Mikkonen JJW, Kullaa AM. Salivary Metabolomics for Diagnosis and Monitoring Diseases: Challenges and Possibilities. Metabolites. 2021;11:587
140. Sakka L, Coll G, Chazal J. Anatomy and physiology of cerebrospinal fluid. Eur Ann Otorhinolaryngol Head Neck Dis. 2011;128:309-16
141. Blennow K, Hampel H, Weiner M, Zetterberg H. Cerebrospinal fluid and plasma biomarkers in Alzheimer disease. Nat Rev Neurol. 2010;6:131-44
142. Xu D, Dai X, Zhang L. et al. Mass spectrometry for biomarkers, disease mechanisms, and drug development in cerebrospinal fluid metabolomics. TrAC Trends Anal Chem. 2024;173:117626
143. Simrén J, Ashton NJ, Blennow K, Zetterberg H. An update on fluid biomarkers for neurodegenerative diseases: recent success and challenges ahead. Curr Opin Neurobiol. 2020;61:29-39
144. Panyard DJ, Kim KM, Darst BF. et al. Cerebrospinal fluid metabolomics identifies 19 brain-related phenotype associations. Commun Biol. 2021;4:1-11
145. Matysik S, Le Roy CI, Liebisch G, Claus SP. Metabolomics of fecal samples: A practical consideration. Trends Food Sci Technol. 2016;57:244-55
146. Chen F, Dai X, Zhou C-C. et al. Integrated analysis of the faecal metagenome and serum metabolome reveals the role of gut microbiome-associated metabolites in the detection of colorectal cancer and adenoma. Gut. 2022;71:1315-25
147. Canfora EE, Meex RCR, Venema K, Blaak EE. Gut microbial metabolites in obesity, NAFLD and T2DM. Nat Rev Endocrinol. 2019;15:261-73
148. Mora-Ortiz M, Nuñez Ramos P, Oregioni A, Claus SP. NMR metabolomics identifies over 60 biomarkers associated with Type II Diabetes impairment in db/db mice. Metabolomics. 2019;15:89
149. He M, Sun M, Koval S. et al. Traditional Chinese Medicine-Based Subtyping of Early-Stage Type 2 Diabetes Using Plasma Metabolomics Combined with Ultra-Weak Photon Emission. Engineering. 2019;5:916-23
150. Slieker RC, Münch M, Donnelly LA. et al. An omics-based machine learning approach to predict diabetes progression: a RHAPSODY study. Diabetologia. 2024;67:885-94
151. Kant S, Deepika, Roy S. Integrative Multi-Omics and Artificial Intelligence: A New Paradigm for Systems Biology. OMICS J Integr Biol. 2025;29:576-87
152. Cobb J, Gall W, Adam K-P. et al. A Novel Fasting Blood Test for Insulin Resistance and Prediabetes. J Diabetes Sci Technol. 2013;7:100-10
153. Song J, Wang C, Zhao T. et al. Multi-omics approaches for biomarker discovery and precision diagnosis of prediabetes. Front Endocrinol. 2025;16:1520436
Author contact
Corresponding authors: Prof. Dr. Hongfeng Wang, Changchun University of Chinese Medicine, No. 1035, Boshuo Rd, Jingyue Economic Development District, Changchun 130117, China, Email: ccwhfcom. Prof. Dr. Mengmeng Sun, Changchun University of Chinese Medicine, No. 1035, Boshuo Rd, Jingyue Economic Development District, Changchun 130117, China, Email: sunmmedu.cn.