Impact Factor ISSN: 1449-1907




Int J Med Sci 2026; 23(9):2884-2898. doi:10.7150/ijms.131007 This issue Cite
Research Paper
CRISPR/Cas9-Driven Fndc5 Knockout Reveals Augmented Mitochondrial Structural and Dynamic Alterations in Diabetic Nephropathy
Chien-Wei Huang1,2,3, Hsin-Hung Chen4, Tzu-Ming Jao5, Chia-Jung Li6,7, Junne-Ming Sung1,8, Yau-Sheng Tsai1,  , Jin-Shuen Chen2,9,
1. Institute of Clinical Medicine, College of Medicine, National Cheng Kung University, Tainan, Taiwan.
2. Division of Nephrology, Department of Internal Medicine, Kaohsiung Veterans General Hospital, Kaohsiung, Taiwan.
3. School of Medicine, National Yang Ming Chiao Tung University, Taipei, Taiwan.
4. Department of Medical Education and Research, Kaohsiung Veterans General Hospital, Kaohsiung, Taiwan.
5. Global Innovation Joint Degree Program, International Joint Degree Master's Program in Agro-Biomedical Science in Food and Health, College of Medicine, National Taiwan University, Taipei, Taiwan.
6. Department of Obstetrics and Gynaecology, Kaohsiung Veterans General Hospital, Kaohsiung, Taiwan.
7. Institute of Biopharmaceutical Sciences, National Sun Yat-sen University, Kaohsiung, Taiwan.
8. Division of Nephrology, Department of Internal Medicine, National Cheng Kung University Hospital, College of Medicine, National Cheng Kung University, Tainan, Taiwan.
9. Institute of Precision Medicine, National Sun Yat-Sen University, Kaohsiung, Taiwan.
*These authors contributed equally to this work.
Received 2026-1-6; Accepted 2026-7-3; Published 2026-7-30
Abstract
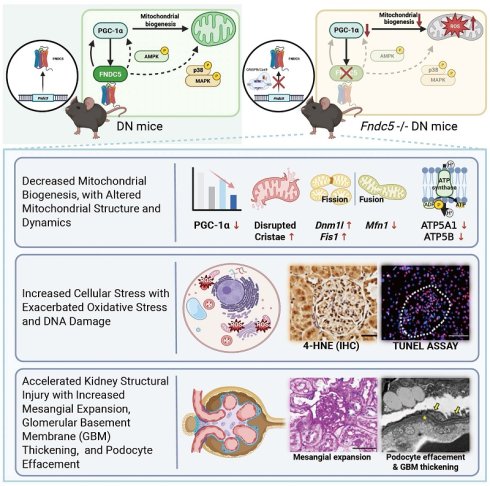
FNDC5 has been implicated in glucose homeostasis and is associated with mitochondrial function. Its role in diabetes and diabetic nephropathy (DN) remains unclear. This study hypothesizes that FNDC5 deficiency predisposes the kidney to accelerated mitochondrial dysfunction in diabetes and DN. Systemic Fndc5 knockout (KO) C57BL/6 mice were generated using CRISPR/Cas9. DN were induced in six-week-old Fndc5 wild-type (WT) and KO mice using high-fat diet combined with streptozotocin injection. Weekly blood and urine analyses assessed glucose, cholesterol, triglycerides, blood urea nitrogen, creatinine, and proteinuria. At 15 weeks, kidneys and metabolic tissues including pancreas, muscle and adipose were collected for histological and molecular analyses. Results showed that while both Fndc5 WT and KO mice were successfully induced with hyperglycemia, the Fndc5 KO DN group exhibited a slightly lower cumulative glycemic burden compared with the WT DN group. Despite this milder metabolic stress, proteinuria remained comparable between the two groups. Furthermore, histological analysis revealed that Fndc5 KO DN mice displayed more severe mesangial expansion, glomerular basement membrane thickening, and podocyte effacement compared with WT DN mice. The elevated lipid peroxidation, reduced PGC-1α expression, and increased DNA fragmentation were also evident in Fndc5 KO DN. More swollen mitochondria with a significantly higher percentage of disrupted cristae were observed in Fndc5 KO DN mice compared with WT DN mice. This was accompanied by the upregulation of mitochondrial fission-related genes (Dnm1l and Fis1), downregulation of the fusion-related gene (Mfn1), and reduced expression of ATP synthase subunits (ATP5A1 and ATP5B). Systemic analysis of other metabolic tissues, including the pancreas and muscle and adipose tissues, revealed increased lipid peroxidation and decreased PGC-1α expression. These findings underscore FNDC5's role in maintaining mitochondrial integrity and cellular health under diabetic conditions, positioning FNDC5 as a potential therapeutic target.
Keywords: Fndc5, irisin, mitochondrial morphology, mitochondrial dynamics, oxidative stress, diabetic nephropathy
Introduction
Diabetes, characterized by insulin resistance and hyperglycemia, represents a major global health challenge with substantial morbidity and mortality [1]. Among its complications, diabetic nephropathy (DN) is a leading cause of end-stage kidney disease (ESKD) [2]. Understanding the complex molecular mechanisms underlying DN is crucial for effective therapeutic strategies. Mitochondrial dysfunction plays a central role in the pathophysiology of diabetes and DN, contributing to both insulin resistance and deficiency [3, 4]. In diabetes, impaired mitochondrial coupling and excessive reactive oxygen species (ROS) production lead to oxidative damage, further exacerbating insulin resistance [5, 6]. This dysfunction is particularly evident in insulin-sensitive tissues, such as skeletal muscle, white adipose tissue, and liver, where diminished mitochondrial function further predisposes individuals to ectopic lipid accumulation [7]. Furthermore, mitochondrial dysfunction contributes to DN by increasing oxidative stress via excessive production of ROS and impaired oxidative phosphorylation [4]. Elevated ROS levels initiate cascades of inflammation, cellular damage, and apoptosis, ultimately resulting in kidney fibrosis and progressive kidney function decline. Collectively, these findings underscore the pivotal role of mitochondrial function in the pathophysiology of diabetes and DN, emphasizing the potential of targeting mitochondrial pathways as therapeutic interventions [8].
Irisin, a myokine derived from the extracellular domain of fibronectin type III domain-containing protein 5 (FNDC5), has garnered significant attention for its role in glucose homeostasis and metabolic regulation [9-12]. Studies have shown that irisin promotes the browning of white adipose tissue, enhances thermogenesis, and improves systemic lipid metabolism [13]. Irisin also modulates obesity-induced inflammation, as demonstrated in high-fat diet-induced obese mice. Fndc5 gene deletion exacerbates obesity, insulin resistance, and inflammation, while its overexpression attenuates these conditions through AMPK-mediated macrophage polarization [14]. For diabetes, clinical studies have reported that diabetic patients have lower serum irisin levels compared with healthy controls [15, 16]. Additionally, patients with diabetes and DN exhibit even lower serum irisin levels compared with those without DN [17]. Nevertheless, the precise role of irisin in DN remains elusive. Furthermore, mitochondrial biogenesis has been proposed as a potential signalling pathways which irisin exerts its effects in myocytes and adipocytes [11]. However, the influence of irisin on mitochondrial function in diabetes and DN remains unclear.
This study aims to elucidate the role of FNDC5 in diabetes and DN by investigating the systemic and molecular effects of FNDC5 deficiency in a mouse model. We employed CRISPR/Cas9 technology to generate global Fndc5 knockout (KO) mice on a C57BL/6 background and established DN by combining a high-fat diet with low-dose streptozotocin (STZ) injection, a well-established approach for modeling diabetes related kidney injury. We analyzed metabolic responses, pathophysiological changes, cellular and mitochondrial functions in various tissues, with a particular focus on the kidneys. Our findings reveal that FNDC5 deficiency is associated with aggravated mitochondrial injury characterized by structural disintegration and dynamic alterations in kidney tissues, leading to heightened oxidative stress, DNA damage, and aggravated glomerular injury. Additionally, significant systemic effects were observed in metabolic tissues, including the pancreas, muscle, brown adipose tissue, and white adipose tissues, underscoring the critical role of FNDC5 in maintaining metabolic homeostasis under diabetic conditions. These insights highlight the potential of FNDC5 as a therapeutic target for mitigating diabetes and DN complications.
Methods
Animal Housing and Care
Fndc5 wild-type (WT) and KO C57BL/6 mice (total: 36; age: six weeks; weight: 16-25 g; 15 females and 21 males) were used in the study. The cohort consisted of 7 WT and 6 Fndc5 KO mice assigned to the control groups, and 10 WT and 13 Fndc5 KO mice subjected to the diabetic induction protocol. Detailed records regarding the diabetic induction success rate and the subsequent longitudinal survival numbers are provided in Fig. S1. Systemic C57BL/6JNarl-Fndc5em1Jsc mice were generated using CRISPR/Cas9 gene-editing technology (Supplementary Method 1). The project involved designing and producing Fndc5 exon2 and exon3 KO. The mice were purchased from The Jackson Laboratory and backcrossed to BALB/cByJNarl strain (National Laboratory Animal Center, Taipei, Taiwan). Tail tip tissue samples (approximately 1 mm) were collected from 4-week-old mice under isoflurane anesthesia (4-5% for induction and 1-3% for maintenance) for PCR-based genotyping to confirm the presence of the targeted genes. Animal experiments were conducted in strict adherence to the standards and procedures approved by the Ethics Committee for Animal Care and Use at Kaohsiung Veterans General Hospital, Kaohsiung, Taiwan (Approval No: IACUC-2022-2023-A038). All procedures conformed to the institutional guidelines for animal experimentation. Mice were housed in the specific pathogen-free facility of the Laboratory Animal Center at Kaohsiung Veterans General Hospital. They were maintained in individually ventilated cages with positive pressure, at a controlled ambient temperature of 20-25 °C and humidity levels of 50-60%. A 12-hour light/dark cycle was strictly enforced. The mice were provided with unlimited access to standard laboratory chow and water. To ensure animal welfare throughout the study, humane endpoints were established based on specific clinical signs, including significant weight loss, loss of appetite, severe infection, clinical signs of severe organ dysfunction unresponsive to treatment, and moribund or near-death condition. Euthanasia was performed by 30% vol/min CO2 absorption. Death was confirmed by cardiac arrest, respiratory arrest, absence of blink response, and lack of pain reflex, with an observation period of 3 minutes. If death was uncertain, cervical dislocation was performed to ensure euthanasia.
Induction of DN Mouse Models
For the induction of DN, six weeks-old C57BL/6 mice with Fndc5 WT and KO were randomly divided into two groups: the control group and the DN group. The control group was fed a normal-fat diet for 10 weeks (Altromin 1310, Supplementary Method 2), while the DN group was fed a high-fat diet for 10 weeks (D12492, Research Diets, Supplementary Method 3). At seven weeks of age, the mice in the DN group were fasted for 12 hours before being induced to develop DN. They were intraperitoneally injected with 100 mg/kg body weight STZ (S0130, Sigma-Aldrich) in 0.1 M citrate buffer (pH 4.5). The control group, serving as the normal control group, received an intraperitoneal injection of 0.1 M citrate buffer (pH 4.5) at seven weeks of age. Fasting blood glucose levels were monitored the following week using blood samples (100 μL) collected from the retro-orbital plexus under isoflurane anesthesia (4-5% for induction, 1-3% for maintenance), and mice with blood glucose concentrations exceeding 200 mg/dL were classified as diabetic. The retro-orbital sinus was chosen as the site of blood collection due to its ability to yield sufficient blood volume with minimal stress and no significant long-term adverse effects [18]. To prevent complications, the site was alternated weekly between the eyes. To assess the development and progression of DN, the urine protein to creatinine ratio (uPCR) was measured weekly to confirm the onset and quantify the severity of proteinuria.
Biochemical Assays of Blood and Urine
Blood and urine samples were collected, microcentrifuged, and stored at -80°C until analysis. Blood samples (100 μL) were collected weekly from the retro-orbital plexus under isoflurane anesthesia. Fasting blood glucose levels were monitored using the Accu-Chek Instant system (Roche). The maximum weight loss induced by fasting was 5.6%. After centrifugation, serum was separated and stored. Serum concentrations of blood urea nitrogen (BUN), creatinine, cholesterol, and triglycerides were measured using the Ortho-Clinical Diagnostics VITROS 350 System. Urine samples (0.5-1.5 mL) were collected weekly using metabolic cages (SN-783, Hinano). Urinary protein concentration was quantified using a bicinchoninic acid protein assay kit (Pierce), and proteinuria was calculated as the ratio of urinary protein (mg/mL) to urinary creatinine (mg/dL). Urine creatinine levels were measured using the Ortho-Clinical Diagnostics VITROS 350 System. All assays were performed in duplicate according to the manufacturer's instructions.
Sample Collection and Tissue Preparation
Body weight was recorded weekly to monitor changes in the mice. At the end of the experiment, when the mice were 15 weeks old, samples of blood, pancreas, kidneys, muscle, and adipose tissues were collected following mice euthanasia. Blood samples were centrifuged and stored at -80 °C until analysis. Tissue samples were quickly frozen and stored at -80 °C. Additionally, some tissue samples were fixed in 10% formalin, dehydrated, and embedded in paraffin blocks for preservation.
RNA Extraction and Real-Time Reverse-Transcription Polymerase Chain Reaction
Total RNA was extracted from mouse kidneys using RNAzol® RT. A small piece of tissue was placed into a 2 mL microcentrifuge tube containing 1000 μL of RNAzol® RT and homogenized using tissue grinding beads. After adding 400 μL of sterile water, the mixture was incubated at room temperature for 3 minutes and then centrifuged at 13,000 g for 15 minutes. The supernatant (1000 μL) was transferred to a new tube and mixed with an equal volume of isopropanol by gentle inversion, followed by a 10-minute incubation at room temperature. The mixture was centrifuged at 13,000 g for 10 minutes at 4 °C. The supernatant was discarded, and the RNA pellet was washed with 500 μL of 75% ethanol, centrifuged at 4,000 g for 5 minutes at 4 °C. This wash step was repeated twice. The remaining ethanol was removed, and the RNA pellet was air-dried. The RNA was resuspended in sterile water, and its concentration was measured using a spectrophotometer. Subsequently, 500 ng of total RNA was reverse-transcribed into complementary DNA (cDNA) using the PrimeScript RT Master Mix (Takara) following the manufacturer's instructions. The resulting cDNA was used as a template for real-time polymerase chain reaction (PCR). All samples were stored at -20°C until further analysis. Messenger RNA levels of genes in this study, including Fndc5, Dnm1l, Mfn1, and Fis1, were determined by real-time reverse-transcription PCR using the iQ™ SYBR® Green Supermix (Bio-Rad Laboratories), following the manufacturer's instructions. Quantitative analysis of glyceraldehyde-3-phosphate dehydrogenase (GAPDH) expression was performed for each sample to serve as an internal control, allowing for the calculation of relative gene expression levels.
Western Blot Analysis
Cell lysates were prepared using RIPA buffer (pH 7.6) with protease and phosphatase inhibitors, followed by centrifugation at 14,000 g for 30 minutes. Protein concentration was determined, and 20 μg of protein was separated on a 12% SDS-PAGE and transferred onto PVDF membranes. Membranes were blocked with 5% milk in TBST for 1 hour, then incubated with primary antibodies (nephrin, 1:1000 [Proteintech, 22912-1-AP]; podocin, 1: 1000 [ABclonal, A17337]; ATP5A1, 1:5,000 [ABclonal, A11217]; ATP5B, 1:10,000 [ABclonal, A11214]; β-actin, 1:10,000 [GeneTex, GTX109639]) at 4 °C overnight. After incubation with HRP-conjugated secondary antibodies, signals were detected using chemiluminescent substrate and visualized with an imaging system. Quantification was done using Image Lab software.
Histology and Immunohistochemistry (IHC) Staining
Mouse kidneys were preserved in 10% neutral-buffered formalin, dehydrated, and embedded in paraffin. Periodic acid-Schiff (PAS) staining was used to evaluate the condition of the glomerular basement membrane, mesangial matrix and kidney tubule. Tissue sections (2 μm thick) were cut from paraffin-embedded blocks and baked at 60 °C for 24 hours. Sections were then deparaffinized with xylene and rehydrated through a graded series of ethanol (100%, 95%, 75%) to 1X PBS. The sections were stained using the ScyTek Periodic Acid Schiff (PAS) Stain Kit. First, sections were incubated with PAS solution for 10 minutes and rinsed four times with sterile water. Next, Schiff solution was applied for 30 minutes, followed by a rinse with running warm water and one rinse with sterile water. Hematoxylin was then applied for 4 minutes to counterstain the nuclei, followed by a 2-minute rinse with running water. Bluing reagent was applied for 10 seconds, and the sections were washed once with sterile water. Finally, sections were dehydrated through a graded series of ethanol (75%, 95%, 100%), air-dried, and mounted with coverslips. For IHC staining, tissue sections (2 μm thick) were cut from paraffin-embedded blocks and baked at 60 °C for 24 hours. Sections were then deparaffinized with xylene and rehydrated through a graded series of ethanol (100%, 95%, 75%) to 1X PBS. Antigen retrieval was performed by placing the sections in citrate buffer (pH 6.0) and heating in a pressure cooker for 20 minutes, then cooling to room temperature. Subsequent staining was carried out using the Leica Novolink Polymer Detection Systems kit according to the manufacturer's instructions. The target proteins (FNDC5 [Proteintech, 23995-1-AP], 4-hydroxynonenal [4-HNE, Bioss, bs-6313R], and Peroxisome proliferator-activated receptor gamma coactivator 1-alpha [PGC-1α, Abclonal, A12348]) were stained using this protocol. Finally, the sections were dehydrated through a graded series of ethanol (75%, 95%, 100%), air-dried, and mounted with coverslips. Quantitative analysis of IHC staining was performed using ImageJ software. For each kidney section, 5-10 nonoverlapping fields were randomly captured at 400× magnification. The H-score was averaged across these fields to provide a single representative value for each animal.
Terminal Deoxynucleotidyl Transferase dUTP Nick End Labeling (TUNEL) Assay
TUNEL positivity in kidneys from WT and Fndc5 KO mice was determined using the In Situ Cell Death Detection Kit, POD (Roche). Kidney tissue sections (2 μm thick) were prepared from paraffin-embedded blocks and baked at 60 °C for 24 hours. Sections were then deparaffinized with xylene and rehydrated through a graded series of ethanol (100%, 95%, 75%). Following rehydration, sections were placed in citrate buffer (pH 6.0) and microwaved at 350 W for 5 minutes. After washing with 1X PBS, TUNEL reaction mixture was added, and sections were incubated at 37 °C for 1 hour in the dark. Post-incubation, sections were washed and counterstained with DAPI for 5 minutes. Finally, sections were washed with 1X PBS and mounted with coverslips. For quantification, a minimum of 5 random fields per kidney were analyzed under 400× magnification.
Electron Microscopy
The kidneys were preserved in 2.5% glutaraldehyde and embedded with the Low Viscosity Embedding Media Spurr kit (Sigma-Aldrich). For ultrastructural examination, kidney tissue sections of 50-70 nm thickness were examined using a transmission electron microscopy (JEM 1400 PLUS; JEOL). To quantify mitochondrial cristae, six non-overlapping fields of view were randomly captured at high magnification for each sample to ensure unbiased sampling. Within these fields, at least 50 mitochondria per mouse were analyzed. Mitochondrial cristae, defined as invaginations of the inner mitochondrial membrane extending into the matrix, were manually counted. The resulting cristae counts were subjected to statistical analysis to compare the mean number of cristae per mitochondrion among experimental groups.
Statistical Analysis
Data from male and female mice were pooled for analysis and presented as the mean ± standard error of the mean (SEM). The number of independent biological replicates (n = 3 to 6 mice per group) for each experiment is specified in the corresponding figure legends. All histological, immunohistochemical, and ultrastructural assessments were conducted by investigators blinded to the experimental groups to ensure objectivity. Before statistical comparison, the Shapiro-Wilk test was used to assess data normality. For normally distributed data, comparisons between two groups were performed using a two-tailed Student's t-test, while the Mann-Whitney U test was applied for non-normally distributed data. For comparisons across multiple groups, a two-way analysis of variance (ANOVA) was conducted, followed by Tukey's post-hoc test to correct for multiple comparisons. For all histological and IHC quantifications, the unit of analysis was the individual animal, with the value for each animal representing the mean derived from 5-10 randomly selected fields. All tests were 2-sided with p < 0.05. Analyses were performed using GraphPad Prism 9 (GraphPad Software, San Diego, CA, USA). A p value < 0.05 was considered statistically significant, with significance levels indicated as *p < 0.05, **p < 0.01, and ***p < 0.001.
Results
Mice with and Without Fndc5 KO Exhibit Distinct DN Features After High Fat Diet and STZ Injection
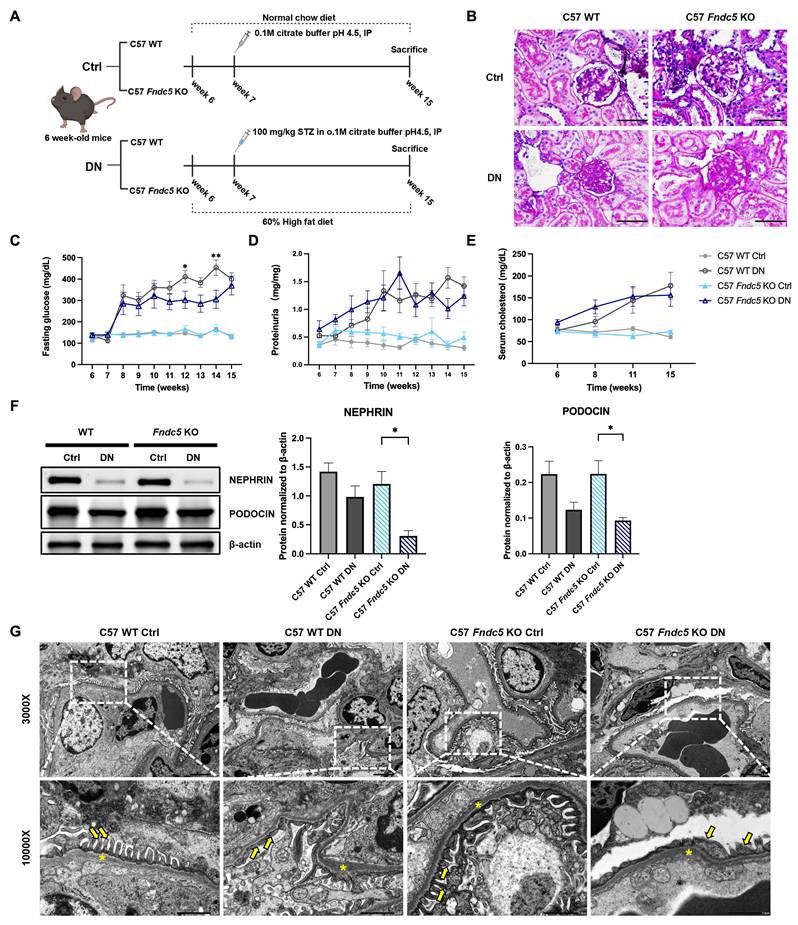
We first established a DN model in C57 WT and Fndc5 KO mice using a high-fat diet combined with STZ injection, as illustrated in Fig 1A. The success rates of diabetes induction, defined by achieving a blood glucose level exceeding 200 mg/dL one week post-STZ injection, were 90% in C57 WT and 76.9% in Fndc5 KO mice. Furthermore, among mice that were successfully induced with diabetes, the survival rates at 15 weeks were 66.7% in C57 WT DN and 70% in Fndc5 KO DN mice (Fig. S1). Most deaths occurred within 2 weeks after the mice received a high-fat diet combined with STZ injection, accompanied by markedly elevated blood glucose levels. We used PAS staining to assess the condition of kidney glomeruli, thereby verifying the successful induction of DN (Fig. 1B). Compared with C57 WT mice, C57 WT DN mice exhibited significant glomerular basement membrane thickening and notable mesangial expansion, with no marked differences observed in the renal tubules. The Fndc5 KO DN group showed similar pathological changes to those observed in C57 WT DN mice. Additionally, we employed Masson staining to assess the fibrotic state of the kidneys, and the findings indicated no significant evidence of fibrosis across these groups (Fig. S2A). We monitored serum glucose, BUN, creatinine levels and uPCR weekly and compared the differences between groups. The results revealed that serum glucose levels in C57 WT DN mice were significantly elevated one week after STZ injection compared with C57 WT mice, and a similar pattern was observed in Fndc5 KO DN mice. Notably, longitudinal analysis demonstrated that the Fndc5 KO DN group maintained a lower glycemic burden compared with the WT DN group throughout the study period, with the difference reaching statistical significance at weeks 12 and 14 (Fig. 1C). Starting from the tenth week, the uPCR significantly increased in C57 WT DN mice compared with C57 WT controls, with Fndc5 KO DN mice showing similar levels to C57 WT DN mice (Fig. 1D). The serum BUN and serum creatinine did not show significant differences between the groups (Fig. S2B and Fig. S2C). Western blot analyses of nephrin and podocin (Fig. 1F) showed reduced nephrin protein levels in both DN groups compared with WT controls, with the Fndc5 KO DN group exhibiting the lowest levels. In contrast, there was no difference in podocin protein levels. The uncropped and unedited full blots were provided in Figure S3. Electron microscopy was employed to compare glomerular morphology among the groups. Compared with C57 WT controls, C57 WT DN mice demonstrated significant glomerular basement membrane thickening and marked podocyte effacement (Fig. 1G). Similarly, Fndc5 KO DN mice exhibited these morphological alterations, consistent with those observed in C57 WT DN mice. These findings confirm successful DN induction in both groups. Additionally, we conducted comparative analyses on metabolic responses in DN mice with and without Fndc5 KO, specifically examining serum cholesterol, triglycerides, and body weight. From the eleventh week onward, serum cholesterol levels in C57 WT DN mice increased significantly compared with C57 WT mice, while Fndc5 KO DN mice exhibited serum cholesterol levels similar to C57 WT DN mice (Fig. 1E). Nevertheless, other indicators, such as body weight and serum triglycerides, did not show significant differences between the groups (Fig. S2D and Fig. S2E).
Impact of FNDC5 deficiency on kidney and metabolic functions in DN mice. (A) Experimental design for DN induction in C57 WT and Fndc5 KO mice with control comparisons. (B) Glomerular basement membrane thickening and mesangial expansion were evaluated by periodic acid-Schiff staining. Scale bars: 100 µm. Time course of fasting glucose levels (C), proteinuria (D), and serum cholesterol (E) in C57 WT and Fndc5 KO mice, with and without DN induction. (F) Representative Western blot images showing nephrin and podocin protein levels in kidney samples from WT and Fndc5 KO mice under control and DN conditions, with corresponding quantification normalized to β-actin. (G) Representative transmission electron microscopy images of kidney glomeruli in C57 WT, C57 WT DN, and Fndc5 KO DN mice, showing ultrastructural alterations in podocyte foot processes and the glomerular basement membrane. Yellow arrows indicate podocyte foot processes, and yellow asterisks indicate the glomerular basement membrane. Scale bars: 2 μm (low magnification) and 1 μm (high magnification). Data are presented as mean ± SEM (n= 4 to 7 for each group). *P < .05; **P < .01; ***P < .001.
Lipid Peroxidation, Decreased PGC-1α Expression, and Increased DNA Damage in Kidney Tissue Were Augmented in Fndc5 KO DN Mice
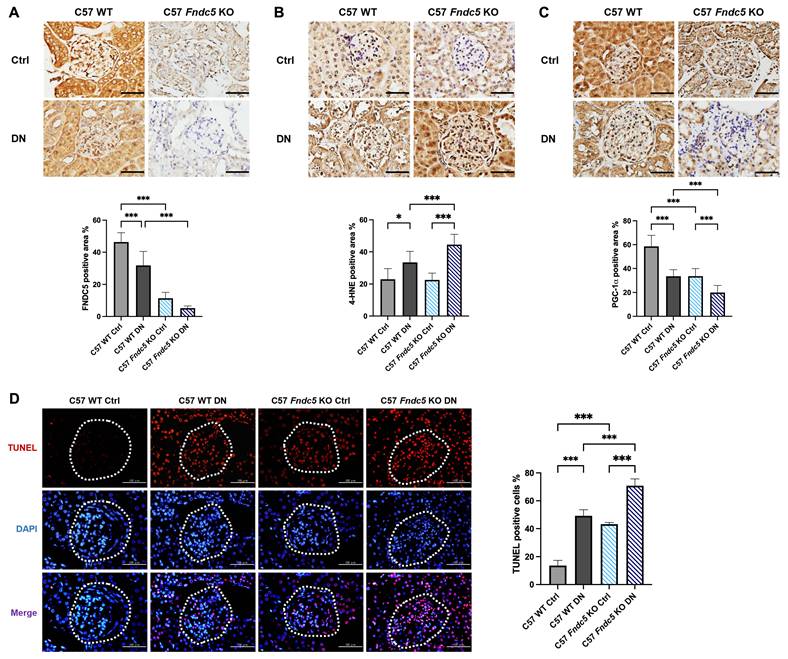
To further investigate the functional impacts of FNDC5 deficiency in DN, we examined markers of lipid peroxidation, PGC-1α expression, and DNA damage in kidney tissues (Fig. 2). First, IHC staining confirmed that FNDC5 expression was significantly reduced in both Fndc5 KO and Fndc5 KO DN mice compared with C57 WT controls, verifying the ablation of the target gene (Fig. 2A). To assess lipid peroxidation indicating the oxidative stress, we analyzed 4-HNE expression in kidney tissue via IHC staining (Fig. 2B). The results indicated a significant increase in lipid peroxidation in C57 WT DN mice compared with C57 WT controls, with an even higher level observed in Fndc5 KO DN mice, suggesting a more significant oxidative burden in the Fndc5 KO group. We also compared PGC-1α expression levels across the groups (Fig. 2C). PGC-1α, a key regulator of mitochondrial biogenesis, oxidative metabolism, and quality control, showed significantly reduced expression in C57 WT DN mice compared with C57 WT controls. Notably, Fndc5 KO DN mice exhibited a further significant decrease in PGC-1α expression compared with the C57 WT DN group, indicating FNDC5 deficiency was associated with mitochondrial dysregulation in the context of DN. To further assess DNA fragmentation, we conducted a TUNEL assay on kidney tissues (Fig. 2D). The assay revealed a marked increase in DNA fragmentation in the kidneys of C57 WT DN mice compared with C57 WT controls. Moreover, the level of DNA fragmentation was significantly higher in Fndc5 KO DN mice than in C57 WT DN mice. These findings demonstrate that FNDC5 deficiency is linked to more severe oxidative stress, mitochondrial dysregulation, and DNA damage in diabetic kidneys.
IHC staining and quantitative analysis of FNDC5 (A), 4-HNE (B), and PGC-1α (C) by groups in kidney tissues. Scale bars: 100 µm. The quantitative analysis below each panel represents the percentage of positive staining areas for the respective markers. (D) TUNEL Immunofluorescence staining and quantitative analysis of apoptosis in kidney glomeruli. Scale bars: 100 µm. Data are presented as mean ± SEM (n = 3 to 4 for each group). *P < .05; **P < .01; ***P < .001.
Severe Mitochondrial Injury and Renal Structural Alterations in Fndc5 KO DN Mice
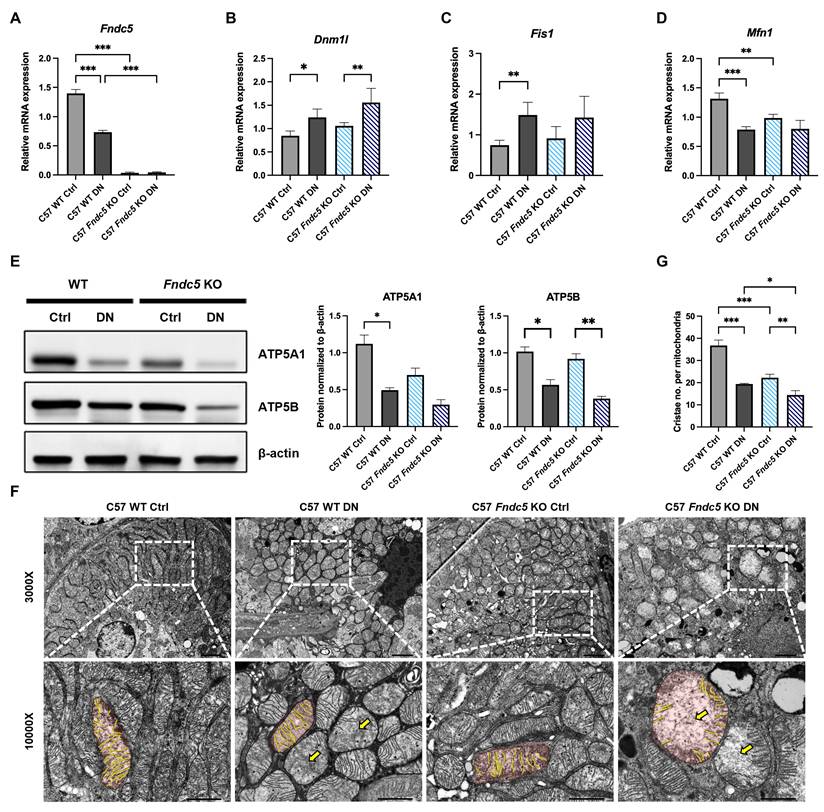
The mitochondrial function in the kidneys of these DN mice was subsequently evaluated. The mRNA expression of Fndc5, Dnm1l, Fis1, and Mfn1 in kidney tissue was quantified and normalized to GAPDH (Fig. 3A-D). As expected, Fndc5 expression was significantly reduced in both Fndc5 KO and Fndc5 KO DN mice compared with WT mice. Dnm1l and Fis1, genes associated with mitochondrial fission, showed significantly higher expression in both WT DN and Fndc5 KO DN groups compared with WT controls, indicating an increase in mitochondrial fission in diabetic conditions. Conversely, Mfn1, a gene involved in mitochondrial fusion, was markedly downregulated in both DN groups, suggesting a shift towards fission over fusion in the mitochondrial dynamics of diabetic kidneys. Western blot analyses of ATP synthase subunits ATP5A1 and ATP5B revealed that both DN groups suffered significant protein loss compared to their respective controls (Fig 3E). While the Fndc5 KO DN group displayed the lowest absolute protein levels, the difference between the two DN groups did not reach statistical significance. This suggests that while FNDC5 deficiency is associated with augmented mitochondrial structural disintegration, the depletion of these specific oxidative phosphorylation subunits is a common hallmark of the diabetic state, regardless of genotype, at this stage of disease progression. The full uncropped and unedited versions of the Western blots were presented in Fig. S4. Electron microscopy (Fig. 3F) provided visual evidence of mitochondrial structural damage in kidney proximal tubules. While WT DN mice displayed disrupted inner mitochondrial membrane cristae, Fndc5 KO DN mice exhibited more pronounced structural abnormalities, with mitochondria appearing swollen, rounded, and with severe loss of cristae. Quantitative morphometric analysis of the EM images revealed that the number of mitochondrial cristae per mitochondrion was significantly reduced in the Fndc5 KO DN group compared with the WT DN group (Fig. 3G). These results support that FNDC5 deficiency amplifies mitochondrial structural disintegration and dynamic dysregulation in diabetic kidneys.
mRNA expression levels of Fndc5 (A) and mitochondrial function markers, including Dnm1l (B), Fis1 (C), and Mfn1 (D), in kidney samples from WT and Fndc5 KO mice, with or without DN induction, normalized to GAPDH. (E) Representative Western blot images showing protein levels of ATP5A1, ATP5B, and β-actin in kidney samples from WT and Fndc5 KO mice under control and DN conditions, with corresponding quantification normalized to β-actin. (F) Representative transmission electron microscopy images of mitochondrial morphology in proximal tubular cells of WT and Fndc5 KO mice, with or without DN induction. Red outlines demarcate representative mitochondria, while yellow lines highlight preserved mitochondrial cristae. Yellow arrows specifically indicate mitochondrial swelling characterized by an extensive loss of cristae, most notably in the Fndc5 KO DN group. Scale bars: 2 μm (low magnification) and 1 μm (high magnification). (G) Quantitative analysis of mitochondrial cristae number per mitochondrion in proximal tubular cells from WT and Fndc5 KO mice, with or without DN induction, based on transmission electron microscopy images. Data are shown as mean ± SEM (n = 4 for each group). *P < .05; **P < .01; ***P < .001.
Systemic Impact of Fndc5 KO on Lipid Peroxidation and Mitochondrial Function in Metabolic Tissues of DN mice
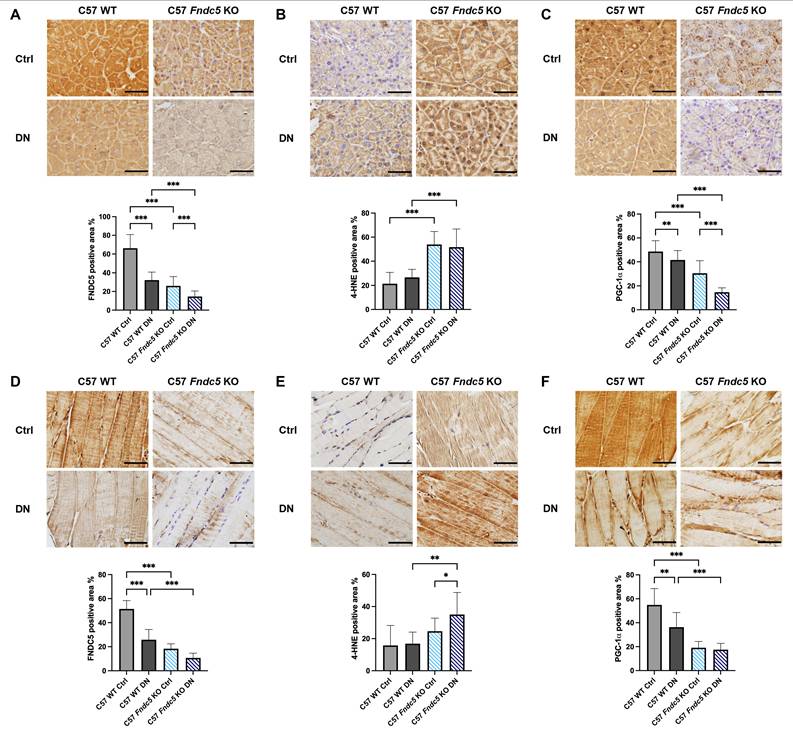
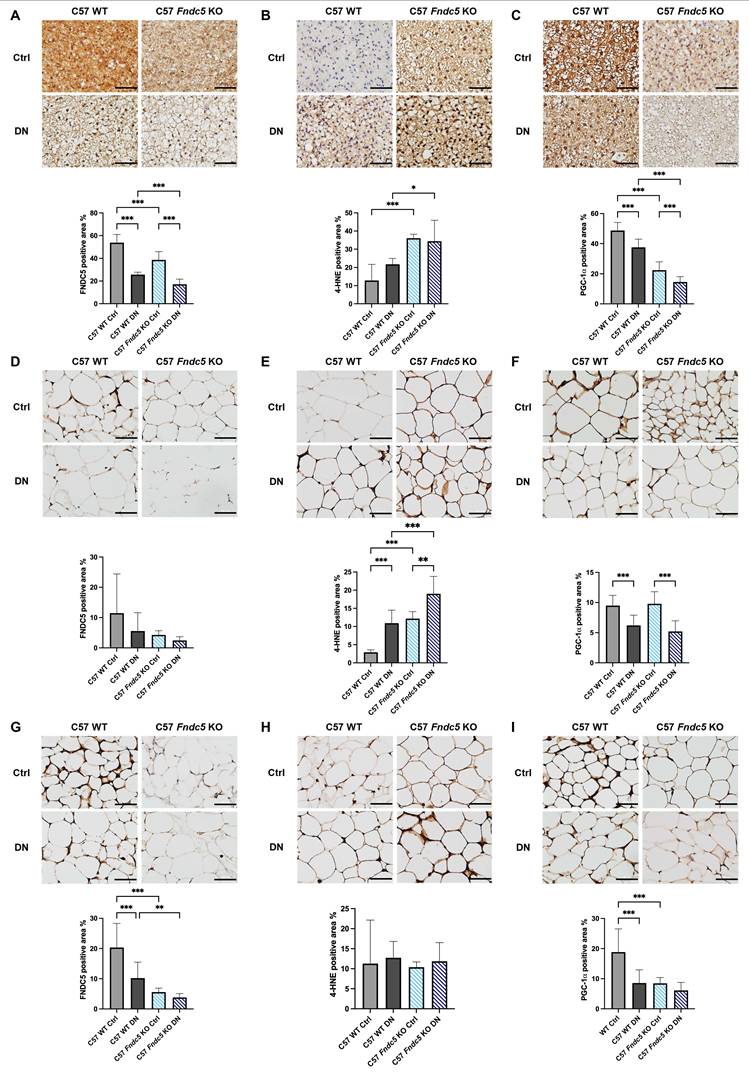
To investigate the systemic effects of Fndc5 KO on metabolic tissues in DN mice, we evaluated lipid peroxidation and PGC-1α expression through IHC staining across multiple tissues, including the pancreas (Fig. 4A-C), muscle (Fig. 4D-F), and three types of adipose tissue: interscapular brown, epididymal white, and inguinal white adipose tissues (Fig. 5). Across all examined metabolic tissues, FNDC5 expression was notably reduced in C57 WT DN mice compared with C57 WT controls, with an even more pronounced decrease in Fndc5 KO mice. In terms of lipid peroxidation and oxidative stress, we observed significantly elevated 4-HNE levels in the pancreas, muscle, and interscapular brown adipose tissue (Fig. 5B) in Fndc5 KO DN mice compared with C57 WT DN groups, indicating heightened oxidative stress due to FNDC5 deficiency in these tissues. Additionally, epididymal white adipose tissue showed markedly elevated lipid peroxidation in C57 WT DN mice compared with C57 WT controls, with Fndc5 KO DN mice exhibiting even higher 4-HNE levels, reflecting an augmentation of oxidative stress (Fig. 5E). However, no significant differences in 4-HNE expression were observed in the inguinal white adipose tissue across all groups (Fig. 5H). Regarding mitochondrial biogenesis, PGC-1α expression was significantly reduced in C57 WT DN mice compared with C57 WT controls in all metabolic tissues examined, with Fndc5 KO DN mice showing an even more pronounced decrease in the pancreas, muscle, and interscapular brown adipose tissue (Fig. 4C, Fig. 4F and Fig. 5C). In contrast, PGC-1α levels in epididymal and inguinal white adipose tissues showed no significant differences between Fndc5 KO DN and C57 WT DN groups (Fig. 5F and Fig. 5I), suggesting a variable impact of FNDC5 deficiency on mitochondrial biogenesis in different adipose tissues. These findings suggest that FNDC5 deficiency aggravates the oxidative stress and mitochondrial dysregulation in specific metabolic tissues under diabetic conditions.
Morphological, IHC, and quantitative analyses of FNDC5 (A, D), 4-HNE (B, E), and PGC1-1α (C, F) in pancreatic and muscle tissues. Panels (A-C) show pancreatic tissue, and panels (D-F) show muscle tissue, with comparisons between WT and Fndc5 KO groups, both with and without DN induction. Scale bars: 100 µm. Data are shown as mean ± SEM (n = 4 for each group). *P < .05; **P < .01; ***P < .001.
Morphological, IHC, and quantitative analyses of FNDC5 (A, D, G), 4-HNE (B, E, H), and PGC-1α (C, F, I) in different adipose tissues. Panels (A-C) show interscapular brown adipose tissue, (D-F) show epididymal white adipose tissue, and (G-I) show inguinal white adipose tissue. Each analysis compares WT and Fndc5 KO groups, both with and without DN induction. Scale bars: 100 µm. Data are shown as mean ± SEM (n = 4 for each group). *P < .05; **P < .01; ***P < .001.
Discussion
In this study, we successfully established a DN model in C57 WT and Fndc5 KO mice using a high-fat diet combined with STZ injection, as confirmed by elevated blood glucose levels and DN features, including proteinuria, glomerular basement membrane thickening, mesangial expansion and podocyte effacement. Interestingly, while Fndc5 KO DN mice exhibited more severe histological damage, including podocyte effacement and mesangial expansion, their proteinuria remained comparable to the WT DN group at the 15-week mark. This 'structural-functional dissociation' suggests that at this specific time point, the kidney may still possess sufficient functional reserve to compensate for the accelerated morphological remodeling, suggesting that FNDC5 deficiency may primarily accelerate early structural injury, and a longer observation period might be required to witness the eventual divergence in overt clinical parameters such as ESKD. Furthermore, the relatively lower glycemic burden observed in Fndc5 KO DN mice compared to WT DN mice may have further contributed to this delayed functional decline. It is noteworthy that the Fndc5 KO mice had a lower induction rate of diabetes compared to the WT controls. This discrepancy may be attributed to the specific protocol of a single-dose STZ injection combined with high fat diet, or perhaps an inherent resistance in Fndc5 KO mice against STZ-induced cytotoxicity.
Nevertheless, the Fndc5 KO DN mice exhibited significantly more severe renal structural injury and mitochondrial disintegration despite having a lower cumulative glycemic burden, suggesting that FNDC5 is associated with a renoprotective effect. The impact of FNDC5 deficiency on lipid peroxidation was evident in kidney tissues, where significantly increased 4-HNE expression indicated elevated oxidative stress in FNDC5 deficient DN mice compared with WT DN mice. This was accompanied by a significant reduction in PGC-1α expression, suggesting impaired mitochondrial biogenesis and oxidative metabolism in the absence of FNDC5. Electron microscopy revealed mitochondrial abnormalities such as swollen mitochondria with inner membrane cristae disruption, especially pronounced in Fndc5 KO DN mice. Furthermore, the elevated DNA damage in Fndc5 KO diabetic kidneys, as shown by the TUNEL assay, highlights FNDC5's potential role in modulating cell survival under diabetic stress. Systemic analyses across metabolic tissues, including pancreas, muscle, and various adipose tissues, showed that FNDC5 deficiency is associated with aggravated oxidative stress and mitochondrial dysregulation, as indicated by significantly elevated 4-HNE and reduced PGC-1α levels. Together, these findings underscore the essential role of FNDC5 in preserving mitochondrial integrity and mitigating oxidative damage across systemic tissues under diabetic conditions, positioning FNDC5 as a potential therapeutic target to address metabolic and renal complications in diabetes.
Mitochondrial dysfunction emerges early in hyperglycemia and serves as a pivotal event in the progression of DN. In this study, the absence of FNDC5 was associated with aggravated diabetic kidney damage, as evidenced by significant mitochondrial injury and increased oxidative stress in Fndc5 KO DN mice. This injury was further characterized by reduced PGC-1α expression, a key regulator of mitochondrial biogenesis and function, along with increased mRNA levels of Dnm1l and Fis1, markers of mitochondrial fission, and decreased mRNA levels of Mfn1, a marker of mitochondrial fusion. Additionally, the downregulation of ATP5B and ATP5A1 reflected a reduction in essential oxidative phosphorylation components, further reinforcing the molecular and structural mitochondrial impairment in this context [19]. The imbalance in mitochondrial dynamics, characterized by increased fission and reduced fusion, is consistent with previous studies linking mitochondrial dysfunction to the pathogenesis of DN [8, 20]. The dual role of mitochondrial fission in promoting the removal of damaged mitochondria via mitophagy and facilitating the proliferation of healthy mitochondria is crucial for cellular homeostasis. However, the increased expression of Dnm1l and Fis1 in the absence of FNDC5 suggests enhanced mitochondrial fission, which may initially act as an adaptive response but, when dysregulated, contributes to persistent mitochondrial structural damage and dynamic imbalance [20]. These findings highlight the critical role of FNDC5 in preserving mitochondrial integrity and mitigating oxidative stress, aligning with broader insights into mitochondrial dynamics in DN.
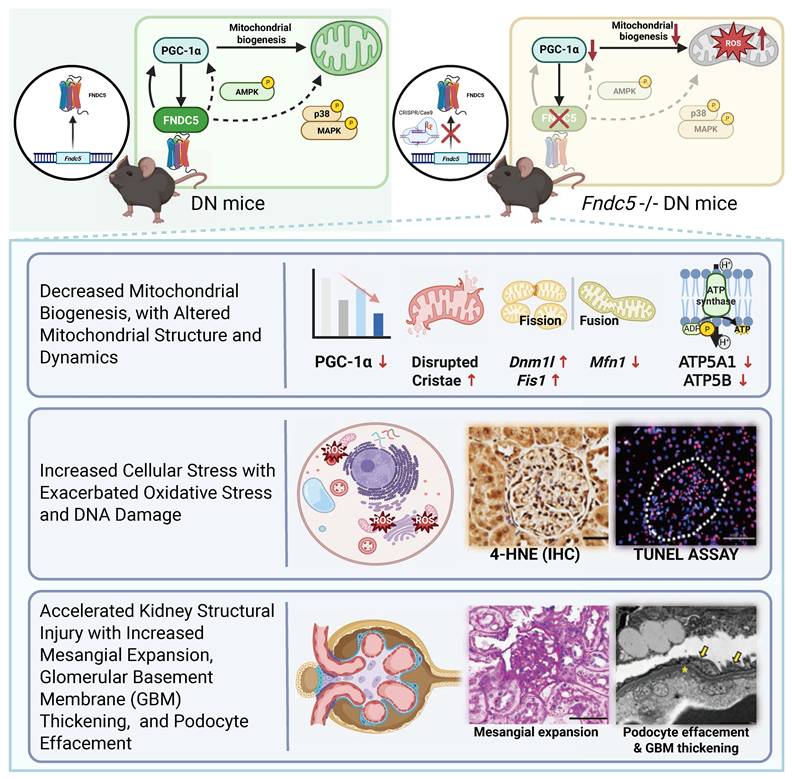
Our study found that increased lipid peroxidation and reduced PGC-1α expression were observed in metabolic tissues beyond the kidneys, including the pancreas, muscle, and adipose tissues, in Fndc5 KO DN mice. We argue that FNDC5 is essential for the stabilization of its own upstream regulator, PGC-1α. This paradigm explains why the loss of FNDC5 results in a significantly more severe PGC-1α deficit than diabetes alone. While the precise upstream signaling pathways in renal cells remain to be fully elucidated, previous research in skeletal muscle has demonstrated that exercise stimulates AMPK phosphorylation, which in turn enhances PGC-1α expression [21]. Interestingly, exogenous irisin treatment has also been shown to stimulate AMPK phosphorylation, leading to increased glucose uptake and suppressed glycogenolysis [22]. Furthermore, irisin has been observed to directly upregulate Ppargc1a gene expression in vitro [23]. Taken together, these findings suggest that FNDC5 may sustain PGC-1α expression either directly or through an AMPK-mediated feedback loop. The mitochondrial structural injury and dynamic disturbances observed in our model are closely linked to this PGC-1α deficit, given its master regulatory role in mitochondrial biogenesis. Moreover, considering the established link between FNDC5 and the p38 MAPK axis in other metabolic contexts, it is plausible that impaired p38 signaling also contributes to the observed mitochondrial disintegration [24]. By framing our results within this 'vicious cycle' of mitochondrial failure, we provide a more robust logical foundation for the severe structural damage visualized by electron microscopy and the heightened DNA damage seen in the TUNEL assays (Fig. 6).
Integrated schematic model linking FNDC5 to mitochondrial integrity in diabetic nephropathy (DN). FNDC5 may sustain the expression of PGC-1α, which serves as its own upstream regulator, either directly or through an AMPK-mediated positive feedback loop. PGC-1α is a master regulator of mitochondrial biogenesis; additionally, FNDC5 may modulate mitochondrial function via the p38 MAPK axis. In FNDC5-deficient DN mice, the loss of FNDC5 and the subsequent decrease in PGC-1α levels impair mitochondrial homeostasis. This condition is characterized by structural alterations such as disrupted cristae, increased mitochondrial fission signaling (Dnm1l and Fis1), and reduced fusion signaling (Mfn1). Furthermore, expression of ATP synthase subunits ATP5A1 and ATP5B is reduced. These changes within the 'vicious cycle' of mitochondrial failure lead to fragmentation of mitochondrial networks, increased oxidative damage as shown by 4-HNE IHC, and DNA damage detected by TUNEL assay. Collectively, these cellular stressors accelerate the progression of DN, resulting in kidney structural injury characterized by mesangial expansion, glomerular basement membrane thickening, and podocyte effacement.
Current therapeutic strategies for DN primarily focus on lifestyle modification, renin-angiotensin system blockade therapy, and the management of glycemia and blood pressure [25]. Targeting mitochondrial homeostasis offers a novel approach that could complement existing treatments [8]. The use of glucose-lowering drugs such as glucagon-like peptide-1 receptor agonists and sodium-glucose cotransporter 2 inhibitors, which influence mitochondrial dynamics, further supports the potential of targeting mitochondrial pathways in kidney diseases [26]. The role of mitochondrial oxidative metabolism in chronic kidney disease progression and the protective effects of antioxidants like avasopasem manganese in clinical trials also underscore the therapeutic potential of targeting mitochondrial pathways [27]. Given the critical role of mitochondrial function in renal health, further studies are warranted to explore the underlying mechanisms of FNDC5 in mitochondrial regulation and its therapeutic potential in diabetes management. This could lead to the development of novel therapeutic strategies to enhance FNDC5 expression or function, thereby mitigating the complications of DN and improving overall metabolic health in diabetic patients.
Several limitations warrant consideration. First, the pooled analysis of male and female mice is a limitation of this study to elucidate potential sexual difference in FNDC5-mediated renoprotection. Second, although we confirmed the profound loss of FNDC5 expression across multiple metabolic tissues including the kidney, skeletal muscle, and adipose tissue, the lack of quantitative measurements for circulating irisin levels remains a limitation in clarifying the systemic bioactivity of this axis. Third, while our findings provide extensive evidence of mitochondrial structural disintegration and the dysregulation of fission/fusion dynamics, the extent of actual bioenergetic impairment, such as alterations in ATP production or respiratory capacity measured by Seahorse bioenergetic profiling, remains to be confirmed in future studies. Finally, the relatively small sample size in certain specialized assays may have limited the statistical power to reach significance in some parameters, despite the independent biological replicates providing consistent trends. Consequently, these observations should be interpreted with caution, and future studies with larger, sex-stratified cohorts are warranted to confirm these findings.
In conclusion, the study underscores the critical role of FNDC5 in maintaining mitochondrial integrity and protecting against oxidative stress and DNA damage in diabetic conditions, highlighting the potential of targeting FNDC5 pathways for developing novel therapeutic interventions for diabetes and DN complications.
Author Contributions
CWH, TMJ, YST and JSC contributed to the study conception and design. CWH drafted the manuscript. HHC, JMS, YST, and JSC developed the methodology and contributed to the manuscript's writing, reviewing, and revising. TMJ and CJL acquired, analyzed, interpreted the data, and performed the statistical analysis. YST and JSC provided technical and material support. All authors read and approved the final manuscript. All authors read and approved the final manuscript.
Supplementary Material
Supplementary Method 1. Generation of systemic C57BL/6JNarl-Fndc5em1Jsc using CRISPR/Cas9 gene-editing technology. Supplementary Method 2. Composition of normal chow diet (Altromin 1310). Supplementary Method 3. Composition of High-Fat Diet (D12492). Figure S1. Diabetic induction and survival rates of C57 WT and C57 Fndc5 KO mice. Figure S2. Impact of Fndc5 KO on kidney and metabolic function in DN mice. Figure S3. The full uncropped and unedited versions of the Western blots for nephrin and podocin. Figure S4. The full uncropped and unedited versions of the Western blots for ATP synthase subunits (ATP5A1, ATP5B).

Acknowledgements
Graphical abstract and figure 6 were created with BioRender software (https://www.biorender.com/).
Funding
This work was supported by funding from the National Science and Technology Council (NSTC112-2314-B075B-014) and Kaohsiung Veterans General Hospital (KSVGH115-061).
Data Availability Statement
Data generated and analyzed during this study are available from the corresponding author upon reasonable request.
Competing Interests
The authors have declared that no competing interest exists.
References
1. Zheng Y, Ley SH, Hu FB. Global aetiology and epidemiology of type 2 diabetes mellitus and its complications. Nat Rev Endocrinol. 2018;14:88-98
2. Johansen KL, Gilbertson DT, Li S, Li S, Liu J, Roetker NS. et al. US Renal Data System 2024 Annual Data Report: Epidemiology of Kidney Disease in the United States. Am J Kidney Dis. 2025;85:A8-A11
3. Audzeyenka I, Bierżyńska A, Lay AC. Podocyte Bioenergetics in the Development of Diabetic Nephropathy: The Role of Mitochondria. Endocrinology. 2022 163
4. Fan X, Yang M, Lang Y, Lu S, Kong Z, Gao Y. et al. Mitochondrial metabolic reprogramming in diabetic kidney disease. Cell Death Dis. 2024;15:442
5. Ruegsegger GN, Creo AL, Cortes TM, Dasari S, Nair KS. Altered mitochondrial function in insulin-deficient and insulin-resistant states. J Clin Invest. 2018;128:3671-81
6. Constantin-Teodosiu D, Constantin D, Pelsers MM, Verdijk LB, van Loon L, Greenhaff PL. Mitochondrial DNA copy number associates with insulin sensitivity and aerobic capacity, and differs between sedentary, overweight middle-aged males with and without type 2 diabetes. Int J Obes (Lond). 2020;44:929-36
7. Sangwung P, Petersen KF, Shulman GI, Knowles JW. Mitochondrial Dysfunction, Insulin Resistance, and Potential Genetic Implications. Endocrinology. 2020 161
8. Cleveland KH, Schnellmann RG. Pharmacological Targeting of Mitochondria in Diabetic Kidney Disease. Pharmacol Rev. 2023;75:250-62
9. Boström P, Wu J, Jedrychowski MP, Korde A, Ye L, Lo JC. et al. A PGC1-α-dependent myokine that drives brown-fat-like development of white fat and thermogenesis. Nature. 2012;481:463-8
10. Zhang X, Hu C, Wu HM, Ma ZG, Tang QZ. Fibronectin type III domain-containing 5 in cardiovascular and metabolic diseases: a promising biomarker and therapeutic target. Acta Pharmacol Sin. 2021;42:1390-400
11. Perakakis N, Triantafyllou GA, Fernández-Real JM, Huh JY, Park KH, Seufert J, Mantzoros CS. Physiology and role of irisin in glucose homeostasis. Nat Rev Endocrinol. 2017;13:324-37
12. Park KH, Zaichenko L, Brinkoetter M, Thakkar B, Sahin-Efe A, Joung KE. et al. Circulating irisin in relation to insulin resistance and the metabolic syndrome. J Clin Endocrinol Metab. 2013;98:4899-907
13. Xiong Y, Wu Z, Zhang B, Wang C, Mao F, Liu X. et al. Fndc5 loss-of-function attenuates exercise-induced browning of white adipose tissue in mice. FASEB J. 2019;33:5876-86
14. Xiong XQ, Geng Z, Zhou B, Zhang F, Han Y, Zhou YB. et al. FNDC5 attenuates adipose tissue inflammation and insulin resistance via AMPK-mediated macrophage polarization in obesity. Metabolism. 2018;83:31-41
15. Liu JJ, Liu S, Wong MD, Tan CS, Tavintharan S, Sum CF, Lim SC. Relationship between circulating irisin, renal function and body composition in type 2 diabetes. J Diabetes Complications. 2014;28:208-13
16. Zhang C, Ding Z, Lv G, Li J, Zhou P, Zhang J. Lower irisin level in patients with type 2 diabetes mellitus: A case-control study and meta-analysis. J Diabetes. 2016;8:56-62
17. Hu W, Wang R, Li J, Zhang J, Wang W. Association of irisin concentrations with the presence of diabetic nephropathy and retinopathy. Ann Clin Biochem. 2016;53:67-74
18. Meyer N, Kröger M, Thümmler J, Tietze L, Palme R, Touma C. Impact of three commonly used blood sampling techniques on the welfare of laboratory mice: Taking the animal's perspective. PLoS One. 2020;15:e0238895
19. Kleele T, Rey T, Winter J, Zaganelli S, Mahecic D, Perreten Lambert H. et al. Distinct fission signatures predict mitochondrial degradation or biogenesis. Nature. 2021;593:435-9
20. Ma F, Li H, Huo H, Han Q, Liao J, Zhang H. et al. N-acetyl-L-cysteine alleviates FUNDC1-mediated mitophagy by regulating mitochondrial dynamics in type 1 diabetic nephropathy canine. Life Sci. 2023;313:121278
21. Formigari GP, Dátilo MN, Vareda B, Bonfante ILP, Cavaglieri CR, Lopes de Faria JM, Lopes de Faria JB. Renal protection induced by physical exercise may be mediated by the irisin/AMPK axis in diabetic nephropathy. Sci Rep. 2022;12:9062
22. Huh JY, Mougios V, Kabasakalis A, Fatouros I, Siopi A, Douroudos II. et al. Exercise-induced irisin secretion is independent of age or fitness level and increased irisin may directly modulate muscle metabolism through AMPK activation. J Clin Endocrinol Metab. 2014;99:E2154-61
23. Vaughan RA, Gannon NP, Barberena MA, Garcia-Smith R, Bisoffi M, Mermier CM. et al. Characterization of the metabolic effects of irisin on skeletal muscle in vitro. Diabetes Obes Metab. 2014;16:711-8
24. Zhang Y, Li R, Meng Y, Li S, Donelan W, Zhao Y. et al. Irisin stimulates browning of white adipocytes through mitogen-activated protein kinase p38 MAP kinase and ERK MAP kinase signaling. Diabetes. 2014;63:514-25
25. American Diabetes Association Professional Practice Committee for Diabetes. 11. Chronic Kidney Disease and Risk Management: Standards of Care in Diabetes-2026. Diabetes Care. 2026;49:S246-S60
26. Afsar B, Hornum M, Afsar RE, Ertuglu LA, Ortiz A, Covic A. et al. Mitochondrion-driven nephroprotective mechanisms of novel glucose lowering medications. Mitochondrion. 2021;58:72-82
27. Mapuskar KA, Pulliam CF, Tomanek-Chalkley A, Rastogi P, Wen H, Dayal S. et al. The antioxidant and anti-inflammatory activities of avasopasem manganese in age-associated, cisplatin-induced renal injury. Redox Biol. 2024;70:103022
Author contact
Corresponding authors: Yau-Sheng Tsai and Jin-Shuen Chen, Yau-Sheng Tsai, Ph.D., Institute of Clinical Medicine, College of Medicine, National Cheng Kung University, Tainan, Taiwan, 35 Siaodong Rd., Tainan 70457, Taiwan, Email: yaustsaincku.edu.tw. Jin-Shuen Chen, M.D., Ph.D., Department of Administration, Kaohsiung Veterans General Hospital, Kaohsiung, Taiwan, No.386, Dazhong 1st Rd., Zuoying Dist., Kaohsiung City 813414, Taiwan, Email: dgschengov.tw.