Impact Factor ISSN: 1449-1907




Int J Med Sci 2026; 23(9):2828-2834. doi:10.7150/ijms.135299 This issue Cite
Research Paper
Potential impact of NUCB2 genetic variants with the clinicopathological characteristics of prostate cancer
Yung-Shu Lee1,2#, Tien-Huang Lin3,4#, Chia-Yen Lin5,6, Shun-Fa Yang7,8, Chiao-Wen Lin1,9  , Chih-Hsin Tang10,11,12
1. Institute of Oral Sciences, Chung Shan Medical University, Taichung, Taiwan.
2. Department of Urology, Taipei City Hospital Heping Branch, Taipei City, Taiwan.
3. School of Post-Baccalaureate Chinese Medicine, Tzu Chi University, Hualien, Taiwan.
4. Department of Urology, Buddhist Tzu Chi General Hospital Taichung Branch, Taichung, Taiwan.
5. Division of Urology, Department of Surgery, Taichung Veterans General Hospital, Taichung, Taiwan.
6. School of Medicine, Chung Shan Medical University, Taichung, Taiwan.
7. Institute of Medicine, Chung Shan Medical University, Taichung, Taiwan.
8. Department of Medical Research, Chung Shan Medical University Hospital, Taichung, Taiwan.
9. Department of Dentistry, Chung Shan Medical University Hospital, Taichung, Taiwan.
10. Department of Pharmacology, School of Medicine, China Medical University, Taichung, Taiwan.
11. Department of Medical Laboratory Science and Biotechnology, Asia University, Taichung, Taiwan.
12. Chinese Medicine Research Center, China Medical University, Taichung, Taiwan.
#These authors contributed equally to this work.
Received 2026-3-29; Accepted 2026-7-16; Published 2026-7-22
Abstract
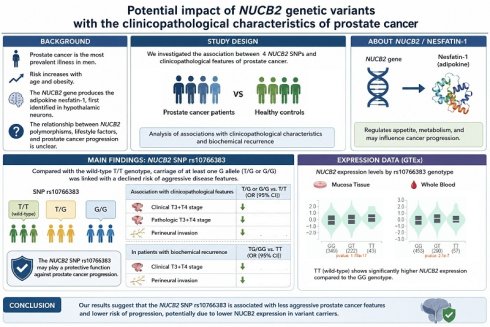
The most prevalent illness in men is prostate cancer, which risk increases with age and obesity. The precursor NUCB2 gene produces the adipokine nesfatin-1, which was first found in hypothalamic neurons. It is currently unclear how NUCB2 polymorphisms, cancer-promoting lifestyle factors, and prostate cancer are related. We investigated the relationship between clinicopathological features and 4 NUCB2 gene polymorphisms in prostate cancer when compared to healthy individuals. Compared with the wild-type T/T genotype, carriage of at least one G allele (T/G or G/G genotypes) at the NUCB2 SNP rs10766383 was linked with a declined risk of clinical T3+T4 stage, pathologic T3+T4 stage, and perineural invasion. In addition, the TG/GG genotypes at rs10766383 were also associated to a lower risk of clinical T3+T4 stage and perineural invasion in patients with biochemical recurrence. Importantly, GTEx data indicated that the wild-type TT homozygous genotype was linked with markedly higher NUCB2 levels compared to the GG allele of variant rs10766383 variant in mucosa and whole blood tissues. Thus, the NUCB2 SNP rs10766383 may play a protective function against prostate cancer progression.
Keywords: nesfatin-1, NUCB2, prostate cancer, genetic polymorphisms
Introduction
Prostate cancer is the most typical disease in males, and its risk elevates with age and obesity [1-3]. By 2050, there will likely be 300,000 new prostate cancer patients in the United States. More than half of prostate cancer patients ultimately develop bone metastases, notably in advanced stages, even though many first show up with organ-confined disease [2, 4-6]. In addition, bone, lymph nodes, and distant organs are common sites of metastasis, which results in a poor prognosis and decreased survival. Many individuals with metastatic cancer develop treatment-resistant disease, despite the five-year associate survival rate for combined diagnosed cases of prostate cancer is 98%. Prostate cancer metastases are a critical cause of mortality and can markedly reduce patients' quality of life [7-9]. The development of early diagnostic and prevention strategies would be aided by a thorough understanding of the mechanisms behind distant metastasis and malignant progression in prostate cancer [10, 11].
There is mounting evidence that obesity and cancer are related [12, 13]. The malignancies where this relationship is most apparent are pancreatic, colorectal and prostate cancers [12, 14, 15]. Additionally, obesity can alter the cancer's microenvironment, accelerating its growth [16]. Adipokines, bioactive compounds secreted by adipose tissue, regulate numerous pathological processes [17]. Among other characteristics of cancer, adipokines have an impact on apoptosis, angiogenesis, differentiation, invasion, proliferation and metastasis [18-20]. Originating from its precursor NUCB2, nesfatin-1 is an 82-amino acid polypeptide that was initially identified in hypothalamus neurons [21]. Other peripheral tissues that express nesfatin-1 include adipose tissue, the ovaries, the duodenum, and the pancreas [22]. Nesfatin-1 has been proposed as an anorexigenic peptide having antihyperglycemic, antioxidant and anti-inflammatory characteristics [23, 24]. Increased expression of NUCB2 has been seen in colon, endometrial, prostate, thyroid and breast cancers, according to recent research [25]. These results show that nesfatin-1 levels are strongly associated with a poor prognosis, as shown by the development of metastases and a lower life expectancy free from recurrence.
A single nucleotide variant that appears at a particular site in the genome is known as a single nucleotide polymorphism (SNP) [26]. SNP distribution frequency analysis between patient cohorts is commonly used to predict the risk and prognosis of diseases like cancer [27, 28]. There is no information on the connections between prostate cancer, NUCB2 gene polymorphisms, and carcinogenic behavioral factors. Thus, this investigation examined the functions of NUCB2 gene polymorphisms and carcinogenic lifestyle variables on the risk of progressing prostate cancer in a Taiwanese population.
Materials and Methods
Study participants
This study examined blood samples from 697 prostate cancer patients who underwent robotic-assisted laparoscopic radical prostatectomy at Taichung Veterans General Hospital (TVGH; Taichung, Taiwan) between 2012 and 2018. All subjects gave written informed consent prior to venous blood collection, and the investigation procedure was approved by the TVGH Institutional Review Board. Medical data collected at the time of diagnosis included prostate-specific antigen (PSA) levels, pathologic Gleason grades, clinical and pathologic T (tumor) and N (node) staging, cancer invasion sites (seminal vesicle, perineural, and lymphovascular regions) [29], D'Amico classification, and the biochemical recurrence (BCR) status [30].
Selection and genotyping of SNPs
Based on other publications [31, 32], the NUCB2 SNPs rs1330, rs214101, rs757081, and rs10766383 were chosen. Every SNP exhibited a minor allele frequency higher than 5%. 3 mL peripheral blood samples were used to extract genomic DNA using QIAamp DNA Blood Kits (Qiagen, CA, USA). Allelic discrimination was applied to the SNPs using previously established evaluation methods [33]. The procedures we previously described [34, 35] were followed for RT-qPCR tests and RNA isolation.
Analysis of clinical dataset
The GTEx portal (gtexportal.org/home/) is a comprehensive public resource for examining tissue-specific gene level and modulation. It provides open-access gene expression data, histology pictures, and quantitative trait loci (QTLs) [36].
Statistical analysis
The Mann-Whitney U test and Fisher's exact test were used to evaluate the differences between the prostate cancer and control groups; p-values less than 0.05 were deemed statistically significant. Odds ratios (ORs) and their 95% confidence intervals (CIs) for the relationships between genotype frequencies and prostate cancer risk were computed using logistic regression. The Statistical Analytic System (SAS) software, version 9.1, was used to evaluate the gathered data.
Results
The demographic and clinical features of 697 male Taiwanese patients with prostate cancer and 806 cancer-free healthy controls are distributed in Table 1. The prostate cancer group had a significantly larger proportion of patients over 65 (57.8%, n = 403) compared to the control group (11.7%, n = 94) (p < 0.001). Patients were more likely to exhibit pathologic Gleason scores of 1+2 (60.0%, n = 418), clinical T1 or T2 stages (86.2%, n = 601), pathologic T2 stage (52.9%, n = 369), and pathologic N0 stage (91.4%, n = 637). Patients presented with no seminal vesicle invasion (78.8%, n = 549) and no lymphovascular invasion (84.1%, n = 586). Furthermore, patients were classified as high-risk according to the D'Amico risk classification (66.2%, n = 352) and as having a low risk of BCR (68.6%, n = 478).
The distributions of demographical characteristics in 806 controls and 697 prostate cancers.
| Variable | Controls (N = 806) | Patients (N = 697) | p value |
|---|---|---|---|
| Age | |||
| ≤ 65 | 712 (88.3 %) | 294 (42.2 %) | P < 0.001* |
| > 65 | 94 (11.7 %) | 403 (57.8 %) | |
| Pathologic Gleason grade group | |||
| 1+2 | 418 (60.0 %) | ||
| 3+4+5 | 279 (40.0 %) | ||
| Clinical T stage | |||
| 1+2 | 601 (86.2 %) | ||
| 3+4 | 96 (13.8 %) | ||
| Pathologic T stage | |||
| 2 | 369 (52.9 %) | ||
| 3+4 | 328 (47.1 %) | ||
| Pathologic N stage | |||
| N0 | 637 (91.4 %) | ||
| N1 | 60 (8.6 %) | ||
| Seminal vesicle invasion | |||
| No | 549 (78.8 %) | ||
| Yes | 148 (21.2 %) | ||
| Perineural invasion | |||
| No | 185 (26.5%) | ||
| Yes | 512 (73.5 %) | ||
| Lymphovascular invasion | |||
| No | 586 (84.1 %) | ||
| Yes | 111 (15.9 %) | ||
| D'Amico classification | |||
| Low risk/ Intermediate risk | 345 (33.8 %) | ||
| High risk | 352 (66.2 %) | ||
| Biochemical recurrence | |||
| No | 478 (68.6 %) | ||
| Yes | 219 (31.4 %) |
* p value < 0.05 as statistically significant.
Table 2 exhibits the genotyping data for the NUCB2 SNPs in health controls and patients with prostate cancer. The predominant genotypes were homozygous C/C for rs1330 and rs757081, homozygous G/G for rs214101, and homozygous T/T for rs10766383. None of the genotypes for the four NUCB2 SNPs across the comparison groups showed a strong connection with prostate cancer after controlling for age (Table 2).
The adjusted odds ratio (AOR) and 95% confidence interval (CI) of prostate cancer associated with NUCB2/nesfatin-1 genotypic frequencies.
| Variable | Controls (N = 806) (%) | Patients (N = 697) (%) | AOR (95% C.I.) | p value |
|---|---|---|---|---|
| rs1330 | ||||
| CC | 308 (38.2%) | 251 (36.0%) | 1.000 (reference) | |
| CT | 381 (47.3%) | 341 (48.9%) | 1.003 (0.778~1.292) | P = 0.984 |
| TT | 117 (14.5%) | 105 (15.1%) | 0.992 (0.694~1.420) | P = 0.966 |
| CT + TT | 498 (61.8%) | 446 (64.0%) | 1.002 (0.887~1.128) | P = 0.998 |
| rs214101 | ||||
| GG | 559 (69.4%) | 460 (66.0%) | 1.000 (reference) | |
| GA | 211 (26.2%) | 219 (31.4%) | 1.177 (0.908~1.525) | P = 0.219 |
| AA | 36 (4.4%) | 18 (2.6%) | 0.886 (0.448~1.124) | P = 0.138 |
| GA + AA | 247 (30.6%) | 237 (34.0%) | 1.035 (0.914~1.173) | P = 0.586 |
| rs757081 | ||||
| CC | 318 (39.5%) | 261 (37.4%) | 1.000 (reference) | |
| CG | 379 (47.0%) | 338 (48.5%) | 1.032 (0.802~1.327) | P = 0.808 |
| GG | 109 (13.5%) | 98 (14.1%) | 0.961 (0.666~1.387) | P = 0.831 |
| CG + GG | 488 (60.5%) | 436 (62.6%) | 1.008 (0.894~1.136) | P = 0.899 |
| rs10766383 | ||||
| TT | 210 (26.1%) | 187 (26.8%) | 1.000 (reference) | |
| TG | 402 (49.9%) | 354 (50.8%) | 1.100 (0.831~1.457) | P = 0.505 |
| GG | 194 (24.0%) | 156 (22.4%) | 1.008 (0.723~1.404) | P = 0.964 |
| TG + GG | 596 (73.9%) | 510 (73.2%) | 1.034 (0.906~1.181) | P = 0.617 |
The adjusted odds ratios (AORs) with their 95% confidence intervals (CIs) were estimated by multiple logistic regression models after controlling for age.
The distributions of clinical features and NUCB2 genotypes within patients with prostate cancer were then compared. SNPs rs1330, rs214101 and rs757081 did not significantly affect clinicopathologic characteristics in patients with prostate cancer (Table 3&4). However, patients carrying at least one polymorphic G allele at rs10766383 (T/G + G/G genotypes) showed a lower risk of progression to clinical T3 or T4 stages (OR = 0.623; 95% CI: 0.394-0.983; p < 0.05), pathologic T3 or T4 stage (OR = 0.683; 95% CI: 0.488-0.956; p < 0.05), and perineural invasion (OR = 0.553; 95% CI: 0.365-0.836; p < 0.05) compared with the T/T genotype (Table 4). Importantly, the TG or GG genotypes at rs10766383 were associated with a reduced risk of clinical T3 + T4 stages (OR = 0.446; 95% CI: 0.234-0.849; p < 0.05) and perineural invasion (OR = 0.129; 95% CI: 0.017~0.990; p < 0.05) (Table 5) in patients with BCR.
Odds ratios (ORs) and 95% confidence intervals (CIs) of the clinical status and NUCB2/nesfatin-1 rs1330 and rs214101 genotypic frequencies in 697 patients with prostate cancer.
| Variable | rs1330 | rs214101 | ||||||
|---|---|---|---|---|---|---|---|---|
| CC (N = 251) | CT+TT (N = 446) | OR (95% CI) | p value | GG (N = 460) | GA+AA (N = 237) | OR (95% CI) | p value | |
| Pathologic Gleason grade group | ||||||||
| 1+2 | 153 (61.0%) | 265 (59.4%) | 1.000 | 0.691 | 281 (61.1%) | 137 (57.8%) | 1.000 | 0.402 |
| 3+4+5 | 98 (39.0%) | 181 (40.6%) | 1.066 (0.777~1.463) | 179 (38.9%) | 100 (42.2%) | 1.146 (0.833~1.576) | ||
| Clinical T stage | ||||||||
| 1+2 | 224 (89.2%) | 377 (84.5%) | 1.000 | 0.083 | 394 (85.7%) | 207 (87.3%) | 1.000 | 0.124 |
| 3+4 | 27 (10.8%) | 69 (15.5%) | 1.518 (0.945~2.441) | 66 (14.3%) | 30 (12.7%) | 0.865 (0.544~1.375) | ||
| Pathologic T stage | ||||||||
| 2 | 141 (56.2%) | 228 (51.1%) | 1.000 | 0.199 | 248 (53.9%) | 121 (51.1%) | 1.000 | 0.474 |
| 3+4 | 110 (43.8%) | 218 (48.9%) | 1.226 (0.898~1.672) | 212 (46.1%) | 116 (48.9%) | 1.121 (0.819~1.535) | ||
| Pathologic N stage | ||||||||
| N0 | 231 (92.0%) | 406 (91.0%) | 1.000 | 0.651 | 423 (92.0%) | 214 (90.3%) | 1.000 | 0.459 |
| N1 | 20 (8.0%) | 40 (9.0%) | 1.138 (0.650~1.993) | 37 (8.0%) | 23 (9.7%) | 1.229 (0.712~2.121) | ||
| Seminal vesicle invasion | ||||||||
| No | 203 (80.9%) | 346 (77.6%) | 1.000 | 0.307 | 365 (79.3%) | 184 (77.6%) | 1.000 | 0.601 |
| Yes | 48 (19.1%) | 100 (22.4%) | 1.222 (0.831~1.797) | 95 (20.7%) | 53 (22.4%) | 1.107 (0.757~1.618) | ||
| Perineural invasion | ||||||||
| No | 70 (27.9%) | 115 (25.8%) | 1.000 | 0.546 | 125 (27.2%) | 60 (25.3%) | 1.000 | 0.599 |
| Yes | 181 (72.1%) | 331 (74.2%) | 1.113 (0.786~1.576) | 335 (72.8%) | 177 (74.7%) | 1.101 (0.770~1.574) | ||
| Lymphovascular invasion | ||||||||
| No | 216 (86.1%) | 370 (83.0%) | 1.000 | 0.284 | 391 (85.0%) | 195 (82.3%) | 1.000 | 0.352 |
| Yes | 35 (13.9%) | 76 (17.0%) | 1.268 (0.821~1.957) | 69 (15.0%) | 42 (17.7%) | 1.221 (0.802~1.858) | ||
| D'Amico classification | ||||||||
| Low risk/ Intermediate risk | 133 (53.0%) | 212 (47.5%) | 1.000 | 0.167 | 229 (49.8%) | 116 (48.9%) | 1.000 | 0.834 |
| High risk | 118 (47.0%) | 234 (52.5%) | 1.244 (0.913~1.696) | 231 (50.2%) | 121 (51.1%) | 1.034 (0.756~1.415) | ||
| Biochemical recurrence | ||||||||
| No | 182 (72.5%) | 296 (66.4%) | 1.000 | 0.094 | 311 (67.6%) | 167 (70.5%) | 1.000 | 0.442 |
| Yes | 69 (27.5%) | 150 (33.6%) | 1.337 (0.952~1.877) | 149 (32.4%) | 70 (29.5%) | 0.875 (0.622~1.230) | ||
ORs with their 95% CIs were estimated by logistic regression models.
Odds ratios (ORs) and 95% confidence intervals (CIs) of the clinical status and NUCB2/nesfatin-1 rs757081 and rs10766383 genotypic frequencies in 697 patients with prostate cancer.
| Variable | rs757081 | rs10766383 | ||||||
|---|---|---|---|---|---|---|---|---|
| CC (N = 261) | CG+GG (N = 436) | OR (95% CI) | p value | TT (N = 187) | TG+GG (N = 510) | OR (95% CI) | p value | |
| Pathologic Gleason grade group | ||||||||
| 1+2 | 156 (59.8%) | 262 (60.1%) | 1.000 | 0.933 | 110 (58.8%) | 308 (60.4%) | 1.000 | 0.708 |
| 3+4+5 | 105 (40.2%) | 174 (39.9%) | 0.987 (0.722~1.349) | 77 (41.2%) | 202 (39.6%) | 0.937 (0.666~1.318) | ||
| Clinical T stage | ||||||||
| 1+2 | 229 (87.7%) | 372 (85.3%) | 1.000 | 0.370 | 153 (81.8%) | 448 (87.8%) | 1.000 | 0.041* |
| 3+4 | 32 (12.3%) | 64 (14.7%) | 1.231 (0.781~1.941) | 34 (18.2%) | 62 (12.2%) | 0.623 (0.394~0.983) | ||
| Pathologic T stage | ||||||||
| 2 | 146 (55.9%) | 223 (51.1%) | 1.000 | 0.220 | 86 (46.0%) | 283 (55.5%) | 1.000 | 0.026* |
| 3+4 | 115 (44.1%) | 213 (48.9%) | 1.213 (0.891~1.650) | 101 (54.0%) | 227 (44.5%) | 0.683 (0.488~0.956) | ||
| Pathologic N stage | ||||||||
| N0 | 238 (91.2%) | 399 (91.5%) | 1.000 | 0.882 | 170 (90.9%) | 467 (91.6%) | 1.000 | 0.783 |
| N1 | 23 (8.8%) | 37 (8.5%) | 0.960 (0.557~1.654) | 17 (9.1%) | 43 (8.4%) | 0.921 (0.511~1.658) | ||
| Seminal vesicle invasion | ||||||||
| No | 212 (81.2%) | 337 (77.3%) | 1.000 | 0.219 | 141 (75.4%) | 408 (80.0%) | 1.000 | 0.188 |
| Yes | 49 (18.8%) | 99 (22.7%) | 1.271 (0.867~1.864) | 46 (24.6%) | 102 (20.0%) | 0.766 (0.515~1.140) | ||
| Perineural invasion | ||||||||
| No | 70 (26.8%) | 115 (26.4%) | 1.000 | 0.898 | 35 (18.7%) | 150 (29.4%) | 1.000 | 0.005* |
| Yes | 191 (73.2%) | 321 (73.6%) | 1.023 (0.723~1.447) | 152 (81.3%) | 360 (70.6%) | 0.553 (0.365~0.836) | ||
| Lymphovascular invasion | ||||||||
| No | 228 (87.4%) | 358 (82.1%) | 1.000 | 0.067 | 149 (79.7%) | 437 (85.7%) | 1.000 | 0.055 |
| Yes | 33 (12.6%) | 78 (17.9%) | 1.505 (0.970~2.336) | 38 (20.3%) | 73 (14.3%) | 0.655 (0.424~1.011) | ||
| D'Amico classification | ||||||||
| Low risk/Intermediate risk | 137 (52.5%) | 208 (47.7%) | 1.000 | 0.221 | 88 (47.1%) | 257 (50.4%) | 1.000 | 0.435 |
| High risk | 124 (47.5%) | 228 (52.3%) | 1.211 (0.891~1.646) | 99 (52.9%) | 253 (49.6%) | 0.875 (0.626~1.224) | ||
| Biochemical recurrence | ||||||||
| No | 187 (71.6%) | 291 (66.7%) | 1.000 | 0.177 | 123 (65.8%) | 355 (69.6%) | 1.000 | 0.483 |
| Yes | 74 (28.4%) | 145 (33.3%) | 1.259 (0.901~1.760) | 64 (34.2%) | 155 (30.4%) | 0.839 (0.588~1.198) | ||
ORs with their 95% CIs were estimated by logistic regression models. * p < 0.05 as statistically significant.
Odds ratios (ORs) and 95% confidence intervals (CIs) of the clinical status and NUCB2/nesfatin-1 rs10766383 genotypic frequencies in 697 patients with prostate cancer with biochemical recurrence.
| Variable | No biochemical recurrence (N=478) | Biochemical recurrence (N = 219) | ||||||
|---|---|---|---|---|---|---|---|---|
| TT (N = 123) | TG+GG (N = 355) | OR (95% CI) | p value | TT (N = 64) | TG+GG (N = 155) | OR (95% CI) | p value | |
| Pathologic Gleason grade group | ||||||||
| 1+2 | 87 (70.7%) | 262 (73.8%) | 1.000 | 0.508 | 23 (35.9%) | 46 (29.7%) | 1.000 | 0.364 |
| 3+4+5 | 36 (29.3%) | 93 (26.2%) | 0.858 (0.544~1.352) | 41 (64.1%) | 109 (70.3%) | 1.329 (0.718~2.461) | ||
| Clinical T stage | ||||||||
| 1+2 | 112 (91.1%) | 324 (91.3%) | 1.000 | 0.943 | 41 (64.1%) | 124 (80.0%) | 1.000 | 0.013* |
| 3+4 | 11 (8.9%) | 31 (8.7%) | 0.974 (0.474~2.003) | 23 (35.9%) | 31 (20.0%) | 0.446 (0.234~0.849) | ||
| Pathologic T stage | ||||||||
| 2 | 75 (61.0%) | 242 (68.2%) | 1.000 | 0.146 | 11 (17.2%) | 41 (26.5%) | 1.000 | 0.143 |
| 3+4 | 48 (39.0%) | 113 (31.8%) | 0.730 (0.477~1.117) | 53 (82.8%) | 114 (73.5%) | 0.577 (0.275~1.211) | ||
| Pathologic N stage | ||||||||
| N0 | 122 (99.2%) | 344 (96.9%) | 1.000 | 0.163 | 48 (75.0%) | 123 (79.4%) | 1.000 | 0.479 |
| N1 | 1 (0.8%) | 11 (3.1%) | 3.901 (0.498~30.532) | 16 (25.0%) | 32 (20.6%) | 0.780 (0.393~1.551) | ||
| Seminal vesicle invasion | ||||||||
| No | 110 (89.4%) | 323 (91.0%) | 1.000 | 0.611 | 31 (48.4%) | 85 (54.8%) | 1.000 | 0.388 |
| Yes | 13 (10.6%) | 32 (9.0%) | 0.838 (0.425~1.655) | 33 (51.6%) | 70 (45.2%) | 0.774 (0.432~1.386) | ||
| Perineural invasion | ||||||||
| No | 34 (27.6%) | 133 (37.5%) | 1.000 | 0.063 | 1 (1.6%) | 17 (11.0%) | 1.000 | 0.021* |
| Yes | 89 (72.4%) | 222 (62.5%) | 0.638 (0.407~1.000) | 63 (98.4%) | 138 (89.0%) | 0.129 (0.017~0.990) | ||
| Lymphovascular invasion | ||||||||
| No | 111 (90.2%) | 333 (93.8%) | 1.000 | 0.186 | 38 (59.4%) | 104 (67.1%) | 1.000 | 0.276 |
| Yes | 12 (9.8%) | 22 (6.2%) | 0.611 (0.293~1.275) | 26 (40.6%) | 51 (32.9%) | 0.717 (0.393~1.307) | ||
| D'Amico classification | ||||||||
| Low risk/Intermediate risk | 71 (57.7%) | 200 (56.3%) | 1.000 | 0.789 | 17 (26.6%) | 57 (36.8%) | 1.000 | 0.146 |
| High risk | 52 (42.3%) | 155 (43.7%) | 1.058 (0.699~1.602) | 47 (73.4%) | 98 (63.2%) | 0.622 (0.327~1.184) | ||
ORs with their 95% CIs were estimated by logistic regression models. * p < 0.05 as statistically significant.
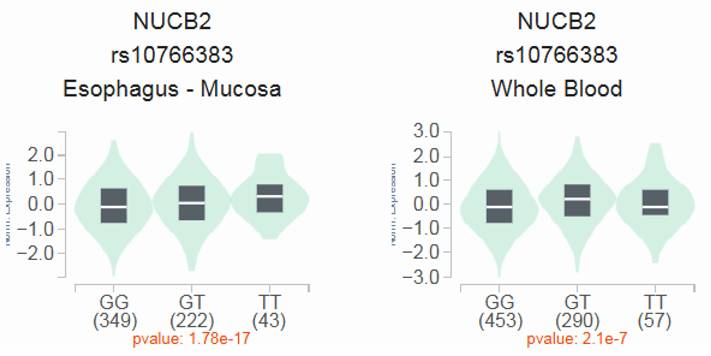
The GTEx data showed that in mucosa and whole blood tissues, patients with the wild-type TT homozygous genotype had significantly higher levels of NUCB2 than those with the GG allele of variant rs10766383 (p < 0.05; Figure 1).
The NUCB2 shows a substantial eQTL association with rs10766383 genotypes in mucosa and whole blood samples from the GTEx database.
Discussion
The usefulness of biomarkers based on genetic abnormalities associated with malignancies in assessing risk, supporting prompt diagnosis, and forecasting treatment outcomes has been documented by different cancer studies [37, 38]. Genetic polymorphisms, or individual differences in genomic sequences, are present in about 1% of the population. SNPs are the most common type of changes seen in repetitive sequences [39]. The relevance of SNPs and other genetic alterations in defining and predicting pharmacotherapeutic actions in prostate cancer has lately been pointed out by a growing body of investigation [40]. The significance of SNPs in tumor biology has also been highlighted by the systematic identification of functional variations associated with cancer risk, which has shown how SNPs in functional regions impact gene level and tumor susceptibility [39]. NUCB2 gene polymorphisms have been linked to oral cancer [33]. However, the relation between NUCB2 polymorphisms and prostate cancer still unknown. Therefore, we examined polymorphisms in the NUCB2 gene and observed their differential distribution within prostate cancer patients. Our data indicated that the NUCB2 SNP rs10766383 is linked with a declined risk of clinical T3+T4 stage, pathologic T3+T4 stage, and perineural invasion.
The development of prostate cancer is markedly associated by adipose tissue [41]. Tumor cell proliferation, invasion, and metastasis are thought to be impacted by prostate cancer's direct or indirect interactions with adipocytes. Interestingly, the most common metastatic location in prostate cancer is bone [42, 43]. Bone marrow adipocytes have been implicated in the formation and exacerbation of these bone metastases in a number of cases [44]. For the past 20 years, numerous researchers have been examining the function of adipose tissue in the development of carcinogenesis and inflammation [45]. Nesfatin-1 is essential for cell proliferation and the stimulation of cancer cell apoptosis, according to recent findings [25]. Thyroid, breast, and colon cancer tissues had higher levels of nesfatin-1 than nearby non-cancerous tissues [46-48]. Furthermore, in renal cell carcinoma, elevated nesfatin-1 expression was closely associated with advanced tumor stage and metastasis [49]. In this work, we compared the genotypic and allelic distributions of NUCB2 gene polymorphisms between patients with prostate cancer and health controls. The four NUCB2 SNPs and total susceptibility to prostate cancer did not differ significantly. However, when we stratified prostate cancer patients according to clinical parameters, carriers of at least one G allele (T/G + G/G genotypes) at the NUCB2 SNP rs10766383 were protected against developing clinical T3+T4 stage, pathologic T3+T4 stage, and perineural invasion. Importantly, GTEx data indicated that the wild-type TT homozygous genotype was linked with markedly higher NUCB2 expression levels compared to the GG allele of variant rs10766383 variant in mucosa and whole blood tissues. Thus, NUCB2 SNP rs10766383 may act as a negative factor of prostate cancer progression.
After radical prostatectomy or radiation therapy, BCR is a common clinical occurrence in PCA patients. An increasing PSA level, which suggests potential tumor recurrence or metastasis prior to the onset of clinical symptoms, is a common characteristic of BCR. In order to assess therapy results, forecast disease development, and direct future therapeutic approaches in PCA care, BCR monitoring is crucial. However, a rise in PSA levels following definitive treatment, such as surgery or radiation therapy, without any clinical or radiographic signs of illness is referred to as a prostate cancer BCR. It frequently shows recurrent or residual tumor activity and may precede the development of metastases, directing choices about salvage therapy or additional monitoring [9, 50, 51]. In the current study, we also demonstrated that the TG or GG genotypes at rs10766383 were associated with a reduced risk of clinical T3 + T4 stages and perineural invasion compared with the TT genotype in patients with BCR. Therefore, the NUCB2 SNP rs10766383 also plays a protective role in prostate cancer with BCR.
Finally, we should acknowledge the limitations of the current study. Although we found that the NUCB2 SNP may play a protective role against prostate cancer progression, our study has several limitations. First, we lacked sufficient prostate cancer and normal control tissue samples for immunohistochemical staining. Therefore, further studies are needed to examine nesfatin-1 expression in prostate cancer patients and normal individuals to validate and support our SNP findings.
In summary, our investigation is the first to identify an association between NUCB2 gene variants and prostate cancer. Compared with the wild-type T/T genotype, carriage of at least one G allele (T/G or G/G genotypes) at the NUCB2 SNP rs10766383 was linked with a declined risk of clinical T3+T4 stage, pathologic T3+T4 stage, and perineural invasion. In addition, the TG/GG genotypes at rs10766383 were also linked to a lower risk of clinical T3+T4 stage and perineural invasion in patients with BCR. Our results suggest that NUCB2 SNPs may play a critical role in prostate cancer progression and perineural invasion.
Acknowledgements
This work was supported by a grant from the China Medical University (CMU115-ASIA-01).
Competing Interests
The authors have declared that no competing interest exists.
References
1. Force USPST, Grossman DC, Curry SJ, Owens DK, Bibbins-Domingo K, Caughey AB. et al. Screening for Prostate Cancer: US Preventive Services Task Force Recommendation Statement. JAMA. 2018;319:1901-13
2. Uehara H, Kobayashi T, Matsumoto M, Watanabe S, Yoneda A, Bando Y. Adipose tissue:Critical contributor to the development of prostate cancer. J Med Invest. 2018;65:9-17
3. Lin TH, Chang SL, Khanh PM, Trang NTN, Liu SC, Tsai HC. et al. Apelin Promotes Prostate Cancer Metastasis by Downregulating TIMP2 via Increases in miR-106a-5p Expression. Cells. 2022 11
4. Furesi G, Rauner M, Hofbauer LC. Emerging Players in Prostate Cancer-Bone Niche Communication. Trends Cancer. 2021;7:112-21
5. Tai HC, Wang SW, Swain S, Lin LW, Tsai HC, Liu SC. et al. Melatonin suppresses the metastatic potential of osteoblastic prostate cancers by inhibiting integrin alpha(2) beta(1) expression. J Pineal Res. 2022;72:e12793
6. Lin LW, Lin TH, Swain S, Fang JK, Guo JH, Yang SF. et al. Melatonin Inhibits ET-1 Production to Break Crosstalk Between Prostate Cancer and Bone Cells: Implication for Osteoblastic Bone Metastasis Treatment. J Pineal Res. 2024;76:e70000
7. DiNatale A, Fatatis A. The Bone Microenvironment in Prostate Cancer Metastasis. Adv Exp Med Biol. 2019;1210:171-84
8. Chang AC, Chen PC, Lin YF, Su CM, Liu JF, Lin TH. et al. Osteoblast-secreted WISP-1 promotes adherence of prostate cancer cells to bone via the VCAM-1/integrin alpha4beta1 system. Cancer Lett. 2018;426:47-56
9. Asadi-Samani M, Rafieian-Kopaei M, Lorigooini Z, Shirzad H. A screening of growth inhibitory activity of Iranian medicinal plants on prostate cancer cell lines. BioMedicine. 2018;8:8
10. Lin JY, Lin TH, Jiang YJ, Lin LW, Lai KY, Fong YC. et al. Ugonin J Inhibits EMT and Migration in Prostate Cancer by Suppressing ADAM9 Expression. Oncology research. 2026;34:19
11. Lin JY, Lin TH, Huang YL, Lai CY, Ho TL, Tsai CH. et al. Caffeic Acid Derivative MPMCA Inhibits Prostate Cancer EMT and Metastasis by Regulating Transcription Factors Snail and Slug. Cells. 2026 15
12. Iacobini C, Pugliese G, Blasetti Fantauzzi C, Federici M, Menini S. Metabolically healthy versus metabolically unhealthy obesity. Metabolism. 2019;92:51-60
13. Weng W-C, Lin T-H, He X-Y, Lin C-Y, Wu H-C, Huang Y-L. et al. Potential impact of omentin-1 genetic variants on perineural invasion in prostate cancer. Journal of Cancer. 2025;16:3767-74
14. Avgerinos KI, Spyrou N, Mantzoros CS, Dalamaga M. Obesity and cancer risk: Emerging biological mechanisms and perspectives. Metabolism. 2019;92:121-35
15. Lin TH, Liu SC, Huang YL, Lai CY, He XY, Tsai CH. et al. Apelin facilitates integrin αvβ3 production and enhances metastasis in prostate cancer by activating STAT3 and inhibiting miR-8070. International journal of biological sciences. 2025;21:4117-28
16. Quail DF, Dannenberg AJ. The obese adipose tissue microenvironment in cancer development and progression. Nat Rev Endocrinol. 2019;15:139-54
17. MᵃᶜDonald IJ, Liu SC, Huang CC, Kuo SJ, Tsai CH, Tang CH. Associations between Adipokines in Arthritic Disease and Implications for Obesity. International journal of molecular sciences. 2019 20
18. Grigoraș A, Amalinei C. The Role of Perirenal Adipose Tissue in Carcinogenesis-From Molecular Mechanism to Therapeutic Perspectives. Cancers. 2025 17
19. Wang YH, Wu YY, Tsai CH, Fong YC, Ko CY, Chen HT. et al. Apelin promotes RANKL-mediated osteoclastogenesis by activating MAPK and NF-κB pathways. Mol Med Rep. 2026 33
20. Su CW, Yang WE, Hsieh YH, Tang CH, Lin CW, Yang SF. CEACAM7 enhances oral cancer metastasis by upregulating CD317 expression. Life Sci. 2025;381:123998
21. Oh IS, Shimizu H, Satoh T, Okada S, Adachi S, Inoue K. et al. Identification of nesfatin-1 as a satiety molecule in the hypothalamus. Nature. 2006;443:709-12
22. Ramanjaneya M, Chen J, Brown JE, Tripathi G, Hallschmid M, Patel S. et al. Identification of nesfatin-1 in human and murine adipose tissue: a novel depot-specific adipokine with increased levels in obesity. Endocrinology. 2010;151:3169-80
23. García-Galiano D, Pineda R, Ilhan T, Castellano JM, Ruiz-Pino F, Sánchez-Garrido MA. et al. Cellular distribution, regulated expression, and functional role of the anorexigenic peptide, NUCB2/nesfatin-1, in the testis. Endocrinology. 2012;153:1959-71
24. Su Y, Zhang J, Tang Y, Bi F, Liu JN. The novel function of nesfatin-1: anti-hyperglycemia. Biochemical and biophysical research communications. 2010;391:1039-42
25. Skorupska A, Lenda R, Ożyhar A, Bystranowska D. The Multifaceted Nature of Nucleobindin-2 in Carcinogenesis. International journal of molecular sciences. 2021 22
26. Chanock S. Candidate genes and single nucleotide polymorphisms (SNPs) in the study of human disease. Dis Markers. 2001;17:89-98
27. Lu HJ, Chuang CY, Su CW, Chen MK, Yang WE, Yeh CM. et al. Role of TNFSF15 variants in oral cancer development and clinicopathologic characteristics. J Cell Mol Med. 2022;26:5452-62
28. Chen KJ, Hsieh MH, Lin YY, Chen MY, Lien MY, Yang SF. et al. Visfatin Polymorphisms, Lifestyle Risk Factors and Risk of Oral Squamous Cell Carcinoma in a Cohort of Taiwanese Males. International journal of medical sciences. 2022;19:762-8
29. Epstein JI, Egevad L, Amin MB, Delahunt B, Srigley JR, Humphrey PA. et al. The 2014 International Society of Urological Pathology (ISUP) Consensus Conference on Gleason Grading of Prostatic Carcinoma: Definition of Grading Patterns and Proposal for a New Grading System. The American journal of surgical pathology. 2016;40:244-52
30. D'Amico AV, Whittington R, Malkowicz SB, Schultz D, Blank K, Broderick GA. et al. Biochemical outcome after radical prostatectomy, external beam radiation therapy, or interstitial radiation therapy for clinically localized prostate cancer. Jama. 1998;280:969-74
31. Zegers D, Beckers S, Mertens IL, Van Gaal LF, Van Hul W. Association between polymorphisms of the Nesfatin gene, NUCB2, and obesity in men. Molecular genetics and metabolism. 2011;103:282-6
32. Li XS, Yan CY, Fan YJ, Yang JL, Zhao SX. NUCB2 polymorphisms are associated with an increased risk for type 2 diabetes in the Chinese population. Ann Transl Med. 2020;8:290
33. Yu C-C, Lu H-J, Lien M-Y, Lin C-W, Yu J-H, Yang S-F. et al. Association of <i>NUCB2</i> genetic variants with the clinicopathological features of oral cancer. International journal of medical sciences. 2026;23:1257-63
34. Lee HP, Chen PC, Wang SW, Fong YC, Tsai CH, Tsai FJ. et al. Plumbagin suppresses endothelial progenitor cell-related angiogenesis in vitro and in vivo. Journal of Functional Foods. 2019;52:537-44
35. Lee HP, Wang SW, Wu YC, Lin LW, Tsai FJ, Yang JS. et al. Soya-cerebroside inhibits VEGF-facilitated angiogenesis in endothelial progenitor cells. Food Agr Immunol. 2020;31:193-204
36. Carithers LJ, Moore HM. The Genotype-Tissue Expression (GTEx) Project. Biopreserv Biobank. 2015;13:307-8
37. Vogelstein B, Papadopoulos N, Velculescu VE, Zhou S, Diaz LA Jr, Kinzler KW. Cancer genome landscapes. Science. 2013;339:1546-58
38. MacDonald IJ, Lin CY, Kuo SJ, Su CM, Tang CH. An update on current and future treatment options for chondrosarcoma. Expert review of anticancer therapy. 2019;19:773-86
39. Allemailem KS, Almatroudi A, Alrumaihi F, Makki Almansour N, Aldakheel FM, Rather RA. et al. Single nucleotide polymorphisms (SNPs) in prostate cancer: its implications in diagnostics and therapeutics. American journal of translational research. 2021;13:3868-89
40. Hu SL, Liu SC, Lin CY, Fong YC, Wang SS, Chen LC. et al. Genetic associations of visfatin polymorphisms with clinicopathologic characteristics of prostate cancer in Taiwanese males. International journal of medical sciences. 2024;21:2494-501
41. Ku HC, Cheng CF. Role of adipocyte browning in prostate and breast tumor microenvironment. Tzu Chi Med J. 2022;34:359-66
42. Gandaglia G, Abdollah F, Schiffmann J, Trudeau V, Shariat SF, Kim SP. et al. Distribution of metastatic sites in patients with prostate cancer: A population-based analysis. Prostate. 2014;74:210-6
43. Chang AC, Lin LW, Chen YC, Chen PC, Liu SC, Tai HC. et al. The ADAM9/WISP-1 axis cooperates with osteoblasts to stimulate primary prostate tumor growth and metastasis. International journal of biological sciences. 2023;19:760-71
44. Otley MOC, Sinal CJ. Adipocyte-Cancer Cell Interactions in the Bone Microenvironment. Front Endocrinol (Lausanne). 2022;13:903925
45. Song YC, Lee SE, Jin Y, Park HW, Chun KH, Lee HW. Classifying the Linkage between Adipose Tissue Inflammation and Tumor Growth through Cancer-Associated Adipocytes. Molecules and cells. 2020;43:763-73
46. Zhang H, Qi C, Li L, Luo F, Xu Y. Clinical significance of NUCB2 mRNA expression in prostate cancer. Journal of experimental & clinical cancer research: CR. 2013;32:56
47. Suzuki S, Takagi K, Miki Y, Onodera Y, Akahira J, Ebata A. et al. Nucleobindin 2 in human breast carcinoma as a potent prognostic factor. Cancer science. 2012;103:136-43
48. Xu H, Li W, Qi K, Zhou J, Gu M, Wang Z. A novel function of NUCB2 in promoting the development and invasion of renal cell carcinoma. Oncol Lett. 2018;15:2425-30
49. Qi C, Ma H, Zhang HT, Gao JD, Xu Y. Nucleobindin 2 expression is an independent prognostic factor for clear cell renal cell carcinoma. Histopathology. 2015;66:650-7
50. Kraus RD, Barsky A, Ji L, Garcia Santos PM, Cheng N, Groshen S. et al. The Perineural Invasion Paradox: Is Perineural Invasion an Independent Prognostic Indicator of Biochemical Recurrence Risk in Patients With pT2N0R0 Prostate Cancer? A Multi-Institutional Study. Advances in radiation oncology. 2019;4:96-102
51. Ball MW, Partin AW, Epstein JI. Extent of extraprostatic extension independently influences biochemical recurrence-free survival: evidence for further pT3 subclassification. Urology. 2015;85:161-4
Author contact
Corresponding authors: Chih-Hsin Tang, PhD; E-mail: chtangcmu.edu.tw. Chiao-Wen Lin, PhD; cwlinedu.tw.