Impact Factor ISSN: 1449-1907
- Issue 9; 2026
- Issue 8; 2026
- Issue 7; 2026
- Issue 6; 2026
- Issue 5; 2026
- Volume 23; 2026
- Past Issues
- Editorial Board
- Cover Images
- Index & Coverage
- Cover Suggestion
- Special Issues
Introduction
Materials and Methods
Results
Discussion
Conclusion
Supplementary Material
Acknowledgements
References

 Global reach, higher impact
Int J Med Sci 2026; 23(1):161-176. doi:10.7150/ijms.121484 This issue Cite
Research Paper
Integrative analysis identifies PIGK as an oncogenic glycosylphosphatidylinositol transamidase subunit with prognostic, immunological, and therapeutic relevance in head and neck cancer
Yi-Fang Yang1, Jia-Bin Liao2, Pei-Lun Yu1, Chih-Yu Chou1, Yu-Hsuan Lin3,4,5,6 ![]()
1. Department of Medical Education and Research, Kaohsiung Veterans General Hospital, Kaohsiung 813, Taiwan.
2. Department of Pathology and Laboratory Medicine, Kaohsiung Veterans General Hospital, Kaohsiung 813, Taiwan.
3. Department of Otolaryngology, Head and Neck Surgery, Kaohsiung Veterans General Hospital, Kaohsiung 813, Taiwan.
4. School of Medicine, National Yang Ming Chiao Tung University, Taipei 112, Taiwan.
5. School of Medicine, Chung Shan Medical University, Taichung 402, Taiwan.
6. School of Medicine, College of Medicine, National Sun Yat-sen University, Kaohsiung 804, Taiwan.
Received 2025-7-11; Accepted 2025-11-5; Published 2026-1-1
Abstract

Background: Glycosylphosphatidylinositol transamidase (GPI-T) catalyzes the attachment of glycosylphosphatidylinositol (GPI) anchors to membrane proteins implicated in oncogenic signaling. However, the specific contribution of individual GPI-T subunits to head and neck cancer (HNC) remains unclear.
Methods: We first compare the expression profiles of GPI-T subunits in HNC and then integrate multi-omics analyses to assess phosphatidylinositol glycan class K (PIGK) expression, genomic alterations, function and pathway enrichment, molecular interactions, and immune associations. Clinical relevance is validated by immunohistochemistry on tissue microarray, and in vitro assays were conducted to assess PIGK-mediated phenotypes, regulation of Family with sequence similarity 20-member C (FAM20C), taxane response, and cancer-associated fibroblast (CAF) formation.
Results: Among the five subunits, PIGK was uniquely and consistently upregulated at both mRNA and protein levels in tumors. High PIGK expression correlates with aggressive clinicopathological features and poor survival across independent cohorts. Genomic analysis shows that PIGK overexpression is associated with copy number gains and inversely correlated with mutations in FAT1, CDKN2A, NOTCH1, and CASP8. Functionally, PIGK knockdown significantly suppressed cell migration, invasion, proliferation, and colony formation, reduced FAM20C expression, decreased sensitivity to paclitaxel and docetaxel, and attenuated fibroblast activation. Enrichment analysis of co-expressed genes showed involvement in cancer-related biological processes, while protein-level interactors of PIGK were enriched in GPI-anchor biosynthesis and membrane-associated pathways. Clinically, patients with PIGKhigh/FAM20Chigh profile exhibited the worst survival outcomes.
Conclusion: PIGK functions as a potential oncogenic driver in HNC with prognostic and therapeutic relevance. Its association with FAM20C, taxane response, and modulation of fibroblast activation provides insights into PIGK-mediated oncogenesis and may inform patient stratification strategies.
Keywords: PIGK, head and neck cancer, FAM20C, tumor microenvironment, taxane sensitivity
Introduction
Head and neck cancer (HNC) poses a global health burden, with over 900,000 new cases and 450,000 deaths annually [1]. Although treatment outcomes have improved for human papillomavirus (HPV)-related HNC, especially for those arising in the oropharynx, the prognosis for HPV-unrelated cases, which comprise most HNC cases, remains poor [2, 3]. This is partly due to the absence of targetable oncogenic drivers, which are characterized by frequent mutations in tumor suppressor genes such as TP53, CDKN2A, FAT1, and AJUBA [4]. Additionally, growing evidence indicates that the aggressiveness and treatment resistance of HNC are shaped by tumor-intrinsic alterations and immune and stromal components of the intricate and heterogeneous tumor microenvironment (TME) [2, 3]. Therefore, the identification of biomarkers that reflect both malignant cell behavior and microenvironmental interactions, especially those with prognostic value, is urgently needed. Given this need, we turned to the glycosylphosphatidylinositol transamidase (GPI-T) complex, a key enzyme involved in glycosylphosphatidylinositol (GPI)-anchor biosynthesis [5-9]. Dysregulation of GPI-anchored proteins (GPI-APs) has been implicated in several cancers [10], raising the possibility that their maturation machinery may contribute to HNC progression.
The GPI-T complex is a membrane-bound enzyme located in the endoplasmic reticulum (ER) that catalyzes the attachment of GPI anchors to proteins. It comprises five subunits: phosphatidylinositol glycan class U (PIGU), glycosylphosphatidylinositol anchor attachment protein 1 (GPAA1), phosphatidylinositol glycan class K (PIGK or GPI8), phosphatidylinositol glycan class S (PIGS), and phosphatidylinositol glycan class T (PIGT) [5, 9]. These subunits coordinate the final step of GPI-anchor biosynthesis by recognizing and cleaving the C-terminal signal sequence of substrate proteins and attaching the GPI anchor to a new terminus via a transamidation reaction [8, 9]. GPI-APs are localized in the outer leaflet of the plasma membrane and are often enriched in lipid rafts, where they contribute to membrane trafficking, cell polarity, and signal transduction [6, 7]. Several GPI-APs have been implicated in cancer progression [10], suggesting that dysregulation of their maturation machinery, such as GPI-T subunits, may contribute to tumorigenesis [10-14].
Emerging evidence has supported the oncogenic potential of certain GPI-T subunits. For instance, PIGU is overexpressed in bladder cancer and promotes uroepithelial cell malignancy via the urokinase receptor/signal transducer and activator of transcription 3 axis [11], whereas GPAA1 amplification enhances GPI-APs expression and activates lipid raft-mediated epidermal growth factor receptor/Erb-B2 receptor tyrosine kinase 2 signaling in gastric cancer [14]. In HNC, a transcriptomic study focusing on three GPI-T subunits (PIGU, PIGT, and GPAA1) has found elevated GPAA1 expression and genomic copy number gain in tumor tissues [12]. Another functional study has demonstrated that exposure to cigarette smoke extract upregulated GPAA1 and activated epidermal growth factor receptor signaling, thereby promoting HNC cell proliferation and invasion [13]. However, no study has comprehensively evaluated the expression and functional relevance of all GPI-T subunits in HNC. In this study, we applied a multi-omics approach to systematically investigate the prognostic value, molecular functions, and microenvironmental associations of GPI-T subunits in HNC, with a particular focus on PIGK as a potential oncogenic driver.
Materials and Methods
Data from The Cancer Genome Atlas (TCGA) and Gene Expression Omnibus
RNA sequencing (RNA-seq) data and clinical information of 523 HNC and 44 healthy samples were obtained from cBioPortal (https://www.cbioportal.org/) [15] and the UCSC Xena platform (https://xena.ucsc.edu/) up to February 2025, as previously described [16]. Gene expression levels were quantified using RNA-Seq by Expectation-Maximization. Clinical variables from the cBioPortal included age at diagnosis, HPV status, histologic grade, disease status, time-to-event intervals, and survival outcomes. Additional data, such as anatomical subsite, American Joint Committee on Cancer (AJCC) T and N classifications, stage, and substance use history, were obtained from UCSC Xena. Patients with distant metastases at diagnosis (n = 5) or incomplete clinical data (n = 28) were excluded, yielding a final cohort of 490 patients. Differential gene expression between tumor and normal tissues was evaluated using the GSE23036 dataset (63 HNC and five normal tissues) from the Gene Expression Omnibus (https://www.ncbi.nlm.nih.gov/geo). GSE41613 (97 oral cancer cases) was used as an independent cohort for survival validation.
Clinical specimens and tissue microarrays for HNC
Formalin-fixed, paraffin-embedded tumors and matched adjacent non-cancerous tissues (>1 cm from the tumor margin) were collected from 100 patients with histologically confirmed HNC treated at Kaohsiung Veterans General Hospital, Taiwan, between 2010 and 2016. All patients had nonmetastatic disease at diagnosis and underwent surgical resection. The tumor sites included the oral cavity, oropharynx, hypopharynx, and larynx. Clinical variables recorded included age, sex, AJCC T/N classification, stage, substance use, treatment strategy, and disease status. Ethical approval, including a waiver of informed consent, was granted by the Ethics Committee of Kaohsiung Veterans General Hospital (approval no. KSVGH23‑CT8‑10).
Immunohistochemistry (IHC)
IHC staining was performed according to the manufacturer's instructions, as previously described [17]. A primary antibody targeting PIGK (1:200; GTX105967; GeneTex) was used for detection. Quantification of PIGK expression was conducted using the HistoQuest analysis software (TissueGnostics, version 7.1), which incorporates a deep-learning-based nuclear segmentation algorithm. Based on the percentage of PIGK-positive tumor cells, protein expression was categorized into high (>10% positive cells) and low (≤10% positive cells) expression groups.
Genomic alteration analysis
Genetic alterations and copy number variations in PIGK were analyzed using the cBioPortal database based on TCGA PanCancer Atlas and HNC datasets. Copy number alterations (CNA) were stratified according to the GISTIC2-defined categories to evaluate their effects on PIGK mRNA expression. The correlation between PIGK expression and Log2-transformed copy number was assessed in TCGA/HNC cohort. The "Plots" module was used to examine the association between PIGK levels and tumor mutation burden (TMB). TIMER 2.0 (http://timer.cistrome.org/) [18] was used to compare PIGK expression between the wild-type and mutant groups of the ten most frequently mutated genes in TCGA/HNC. Statistical differences were assessed using the Wilcoxon rank-sum test, with a P-value < 0.05 considered significant.
Function and pathway analyses of the co-expressed genes
The LinkedOmics database (http://linkedomics.org/admin.php) [19] identified PIGK-co-expressed transcripts in the TCGA/HNC cohort (n = 517), with filtering criteria of P-value < 0.01, false discovery rate (FDR) < 0.01, and absolute correlation coefficient > 0.3. Gene Ontology (GO) enrichment analyses were performed using the DAVID platform (https://davidbioinformatics.nih.gov/summary.jsp) [20]. Significant terms were defined by a Benjamini-Hochberg FDR < 0.01 and ranked accordingly. Ingenuity Pathway Analysis (IPA QIAGEN 2000‑2024) was used to explore disease associations, functional implications, and canonical pathways. IPA terms were considered biologically relevant if P-value < 0.01 and |Z-score| > 2, and were ranked based on the predicted activation Z-scores.
Protein-protein interaction (PPI) network construction and enrichment analysis
The BioGRID (https://thebiogrid.org/) [21] database was used to identify protein interactions with PIGK. We then selected interactors that showed a significant expression correlation with PIGK in the TCGA/HNC cohort using the TIMER2.0 database, with tumor purity adjusted. The Metascape (https://metascape.org/gp/index.html) platform [22] was used to further refine the list by selecting proteins with STRING physical interaction scores > 0.132. The resulting PPI network was visualized using Cytoscape (https://cytoscape.org/). GO and pathway enrichment analyses were performed via Metascape using cumulative hypergeometric testing with Benjamini-Hochberg correction. Terms with P-value < 0.01, FDR < 0.01, enrichment factor > 1.5, and gene count ≥ 3 were considered significant. Molecular Complex Detection (MCODE) analysis was used to identify the densely connected sub-networks [22]. Each cluster was annotated based on the top three enriched terms ranked by the P-value, and the cluster containing PIGK was selected for further analysis.
Identification and analysis of the potential interactors with PIGK
To explore potential functional partners of PIGK, we cross-referenced genes from the MCODE-derived cluster containing PIGK and PIGK-associated molecules from the Pathway Commons database (https://www.pathwaycommons.org/) [23]. The expression profiles of the overlapping candidates were visualized using TIMER2.0, and correlation and survival analyses were performed using GEPIA2 (http://gepia2.cancer-pku.cn/) [24].
Tumor immune microenvironment analysis
The TIMER2.0 platform [18] was used to evaluate the associations between PIGK expression and the abundance of immune and stromal cell populations in bulk tumors from the TCGA/HNC cohort using the CIBERSORT and EPIC deconvolution algorithms. Correlation analyses were conducted using Spearman's method. Patients were stratified into PIGK-high and PIGK-low groups based on the median values. Kaplan-Meier survival analysis was performed to assess the prognostic relevance of the selected immune and stromal cell types within each subgroup. Cancer-associated fibroblast (CAF) scores were calculated as the average expression of decorin (DCN), podoplanin (PDPN), and fibroblast activation protein alpha (FAP), as previously described [25]. For single-cell analysis, the TISCH2 database (http://tisch.comp-genomics.org/) [26] was used to explore PIGK expression across the annotated cell types in the GSE103322 dataset. The same resource was employed for gene set enrichment analysis and cell-cell interaction profiling. A P-value < 0.05 was considered statistically significant for all analyses.
Cell lines and cell viability assay
The human HNC cell line TW1.5 was maintained in Dulbecco's modified Eagle medium/Ham's F-12 nutrient mixture medium, SAS in Dulbecco's modified Eagle medium, and supplemented with 10% fetal bovine serum (FBS). MRC-5 (fibroblast) cells were maintained in α-minimum essential medium (α-MEM; HyClone™, Cat. #SH30008.02, USA) supplemented with 0.1 mM non-essential amino acids, 1 mM sodium pyruvate, and 10% FBS. For cell viability assay, cells (5,000 cells) were plated in a 96-well plate with complete medium overnight at 37°C in 5% CO2. Following incubation, eight replicates of each concentration of various chemotherapeutic drugs were added to the wells, which were then incubated for 72 h. Next, MTT assay (#101-298-93-1, Cyrus Bioscience) was performed for 4 h, cell proliferation was assessed, and signals were measured using an ELISA reader (Thermo Fisher Scientific; Multiskan FC). Cisplatin (HY-17394), paclitaxel (HY-B0015), and docetaxel (HY-B0011) were purchased from MCE.
Lentivirus infection
Lentiviral supernatants containing either the vector control (pLKO.1-shLuc967) or shPIGK shRNAs (TRCN0000050118 and TRCN0000050120) were obtained from the National RNAi Core Facility (Taipei, Taiwan). TW1.5 cells were infected with the viral supernatants in the presence of 8 μg/ml polybrene. After 72 h of infection, cells were selected with 2 μg/ml puromycin to establish stable knockdown cell lines.
Reverse transcription‑quantitative polymerase chain reaction (RT-qPCR)
According to the manufacturer, TRIzol® (Thermo Fisher Scientific, Inc.; #15596018) was used to extract total RNA from HNC cells. Following the manufacturer's instructions, cDNA was generated using the PrimeScriptTM RT Reagent kit (#RR037A; Takara Biotechnology Co., Ltd.). To assess PIGK expression, qPCR was conducted using a SYBR Green PCR Master Mix (PCR Biosystems Ltd. qPCRBIO SyGreen Mix Lo‑ROX). The following primer sequences were used: PIGK, forward: 5′-ACTCCTCGGTCAAAACGTCTT-3′; PIGK, reverse: 5′-CCGCGAGTTCTATGTTGGTAAT-3′; FAM20C, forward: 5′-CCTTCCAGAATTACGGGCAAG-3′; FAM20C, reverse: 5′-TGCCTCTCGTAGTCAGAGAAAT-3′; ACTA2, forward: 5′-CCAACTGGGACGACATGGAA-3′; ACTA2, reverse: 5′-ATTTTCTCCCGGTTGGCCTT-3′; VIM, reverse: 5′-GCTAACCAACGACAAAGCCC-3′; VIM, reverse: 5′-GATTGCAGGGTGTTTTCGGC-3′; ACTB, forward: 5′ AGAAAATCTGGCACCACACC-3′ and ACTB, reverse: 5′ AGAGGCGTACAGGGATAGCA-3′.
Cell invasion and migration assay
The migratory and invasive abilities of TW1.5/shluc, TW1.5/shPIGK-1, and TW1.5/shPIGK-2 cells were determined using Boyden chambers, as previously described [17]. First, the cells were resuspended in serum-free medium (3 × 10⁵ cells/ml), and 50 μl of suspension was loaded into the upper chamber. After 24 h, the cells were stained with crystal violet and measured under a light microscope.
Colony formation assay
A density of 1 × 10⁴ cells/well stable lines was seeded into a six-well plate. The cells were fixed and stained with crystal violet after seven days. The NIH Image J software was used to count the colonies.
Statistical analysis
Statistical comparisons were performed using parametric and nonparametric tests. Student's t-test and chi-square test were used for continuous and categorical variables, respectively, whereas the Wilcoxon rank-sum test and Kruskal-Wallis test were used for nonparametric analysis. Correlations between variables were evaluated using Spearman's rank correlation coefficient. The prognostic significance of the clinical and molecular features was assessed using univariate Cox regression analysis with hazard ratios (HRs) and 95% confidence intervals (CI) reported. Survival distributions were estimated using the Kaplan-Meier method, and group differences were compared using the log-rank test. A two-sided P-value of less than 0.05 was considered statistically significant.
Results
PIGK is the GPI-T subunit consistently upregulated in HNC across independent transcriptomic datasets
As previous studies have demonstrated that members of the GPI-T play essential roles in the occurrence and development of malignancies, we compared the transcript levels of five GPI-T subunits (GPAA1, PIGK, PIGS, PIGT, and PIGU) between tumor and normal tissues using two independent datasets, GSE23036 and TCGA/HNC. Among these, only PIGK was consistently upregulated in tumor tissues across both datasets (Fig. 1A, Supplementary Fig. S1A and B), suggesting its potential oncogenic relevance. In TCGA transcriptome data visualized using TIMER 2.0, PIGK was found to be aberrantly expressed across multiple cancer types. In HNC, PIGK levels were significantly higher in tumor tissues (n = 520) than in normal tissues (n = 44) (P < 1 × 10⁻³) (Fig. 1B), supported by the TNMplot gene-chip data (Supplementary Fig. S1C and D). The Human Protein Atlas database also indicates that PIGK is moderately expressed in normal tongue and salivary gland tissues, which are representative anatomical sites in the head and neck region, suggesting that PIGK may not be entirely tumor-specific (Supplementary Fig. S1E).
Transcriptomic expression and survival analyses of PIGK in head and neck cancer. (A) Venn diagram illustrating differentially expressed GPI-T subunits between tumor and normal tissues in the TCGA/HNC and GSE23036 cohorts. (B) PIGK levels in tumors and normal tissues across various cancer subtypes in TCGA dataset (TIMER 2.0). (C) Kaplan-Meier analysis of overall survival (OS) based on PIGK levels in the TCGA/HNC cohort. (D) OS analysis of PIGK levels in the GSE41613 validation cohort. (E-F) Subgroup OS analyses in HPV-negative (E) and oral cavity (F) subgroups in the TCGA/HNC cohort.
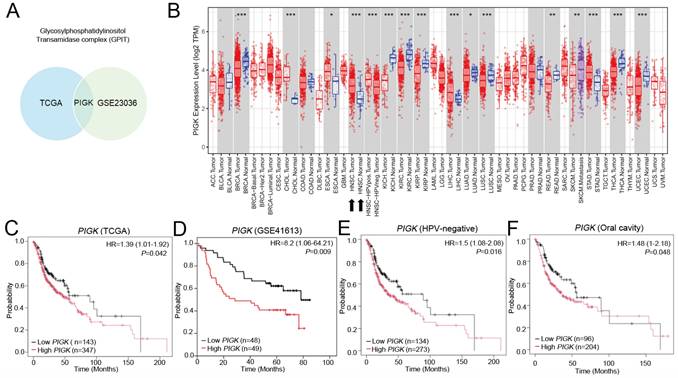
Further correlation analyses demonstrated that PIGK levels were associated with a positive N classification (P = 4.23 × 10⁻²), poor histological differentiation (P = 6.38 × 10⁻⁴), HPV-positive status (P < 1 × 10⁻⁵), and non-oral cavity subsites (P =1.31 × 10⁻⁴) (n = 490; Table 1). Kaplan-Meier survival curves showed that low PIGK, with a cut-off value of 3.32, was associated with better overall survival (OS) (HR = 1.39, 95% CI: 1.01-1.92, P = 4.2 × 10⁻²) (Fig. 1C), a result supported by the GSE41613 dataset (HR = 8.2, 95% CI: 1.06-64.21, P = 9 × 10⁻³) (Fig. 1D). Subgroup analyses showed its prognostic significance in both HPV-unrelated patients (n= 407; HR = 1.5, 95% CI: 1.08-2.08, P = 1.6 × 10⁻²) (Fig. 1E) and those with oral cavity cancers (n = 300; HR = 1.48, 95% CI: 1-2.18, P = 4.8 × 10⁻²) (Fig. 1F). Additional analyses of disease-specific survival (DSS) and progression-free survival are illustrated in Supplementary Fig. S2A and B.
The correlation of PIGK level with clinicopathological characteristics in TCGA/ head and neck cancer.
| PIGK | ||||
|---|---|---|---|---|
| Variable | Mean ± SD | n = 490 | P-value | |
| Age | 0.10503 | |||
| ≥ 60 | 4.19±1.56 | 273 | ||
| < 60 | 4.42±1.65 | 216 | ||
| Sex | 0.00574* | |||
| Male | 4.41±1.67 | 360 | ||
| Female | 3.96±1.35 | 130 | ||
| Anatomic | 0.00013* | |||
| Oral | 4.07±1.49 | 300 | ||
| Non-oral | 4.63±1.71 | 190 | ||
| HPV stats | < 0.00001* | |||
| Negative | 4.05±1.46 | 407 | ||
| Positive | 5.71±1.74 | 69 | ||
| Alcohol consumption | 0.02222* | |||
| Ever/active | 4.41±1.64 | 324 | ||
| No | 4.06±1.50 | 166 | ||
| Smoking status | 0.28085 | |||
| Ever/active | 4.23±1.61 | 305 | ||
| No | 4.39±1.60 | 185 | ||
| Differentiation | 0.000638* | |||
| Well/moderate | 4.10±1.51 | 353 | ||
| Poor | 4.67±1.74 | 118 | ||
| AJCC T | 0.01238* | |||
| 1+2 | 4.52±1.64 | 189 | ||
| 3+4 | 4.14±1.57 | 301 | ||
| AJCC N | 0.0423* | |||
| N0 | 4.13±1.47 | 222 | ||
| N+ | 4.43±1.71 | 264 | ||
| Stage | 0.3668 | |||
| I-III | 4.21±1.45 | 202 | ||
| IV | 4.34±1.71 | 288 | ||
TCGA: The Cancer Genome Atlas Program; SD: standard deviation; HPV: human papillomavirus; AJCC: American Joint Committee of Cancer
Protein-level validation confirms the clinical relevance of PIGK expression in HNC
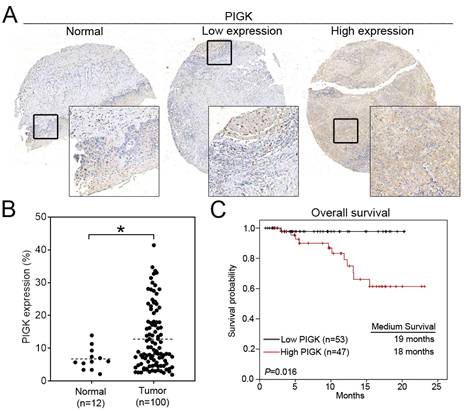
To validate the transcriptome-based findings, we performed IHC staining of PIGK in a tissue microarray consisting of tumor (n = 100) and normal (n = 12) tissues. Consistent with the transcriptomic data, PIGK protein expression was significantly higher in tumor tissues (P = 2.4 × 10⁻², Fig. 2A and B). Clinical association analysis showed that high PIGK expression (n = 47) was more likely to have a higher AJCC T stage (P = 1.1 × 10⁻²), nodal metastasis (P = 1.7 × 10⁻²), advanced overall stage (P = 4.8 × 10⁻²), and a higher risk of recurrence (P = 4.7 × 10⁻²) (Table 2). Although not statistically significant, the high PIGK group also showed trends toward greater tumor thickness (mean: 5.56 mm, P = 8.2 × 10⁻²) (Table 2). Kaplan-Meier analysis demonstrated that patients with high PIGK expression had significantly worse OS (P = 1.6 × 10⁻²) (Fig. 2C). Univariate Cox analysis further demonstrated that high PIGK expression (P = 4.3 × 10⁻²), advanced T (P = 1× 10⁻²), and positive N classification (P = 2.9 × 10⁻²) were significantly associated with poor OS (Table 3). Collectively, these results support the clinical relevance of PIGK in HNC and suggest that its overexpression is correlated with more aggressive disease features and poorer survival outcomes.
Immunohistochemical (IHC) analysis of PIGK in HNC tissues. (A) Representative IHC staining of PIGK in paired tumor and adjacent normal tissues. (B) Quantitative comparison of PIGK protein expression levels in tumor (n = 100) and normal tissues (n = 12). (C) Overall survival analysis by PIGK protein expression in the TMA cohort. Statistical significance: *P < 0.05.
The association of PIGK expression with clinicopathological variables in 100 head and neck cancer patients.
| PIGK | ||||||
|---|---|---|---|---|---|---|
| Total | Low | High | ||||
| Variables | n = 100 | n = 53 | n = 47 | P-value | ||
| Gender | 1 | |||||
| Female | 6 | 3 | 3 | |||
| Male | 94 | 50 | 44 | |||
| Age, years | 0.681 | |||||
| < 60 | 64 | 35 | 29 | |||
| ≥ 60 | 36 | 18 | 18 | |||
| HPV | 0.29 | |||||
| Positive | 17 | 8 | 9 | |||
| Negative | 83 | 45 | 38 | |||
| Anatomic location | 0.422 | |||||
| Oral cavity | 18 | 8 | 10 | |||
| Non-oral cavity | 82 | 45 | 37 | |||
| Alcohol use | 0.812 | |||||
| No | 22 | 11 | 11 | |||
| Yes | 78 | 42 | 36 | |||
| Betel nut use | 0.832 | |||||
| No | 31 | 17 | 14 | |||
| Yes | 69 | 36 | 33 | |||
| Smoking status | 0.806 | |||||
| No | 20 | 10 | 10 | |||
| Yes | 80 | 43 | 37 | |||
| Differentiation | 0.136 | |||||
| 1 | 14 | 10 | 4 | |||
| 2 | 80 | 42 | 38 | |||
| 3 | 6 | 1 | 5 | |||
| Tumor thickness | 0.082 | |||||
| > 5.56 | 59 | 27 | 32 | |||
| ≤ 5.56 | 41 | 26 | 15 | |||
| PNI | 0.418 | |||||
| Present | 16 | 7 | 9 | |||
| Absent | 84 | 46 | 38 | |||
| T classification | 0.011* | |||||
| 1 | 31 | 24 | 7 | |||
| 2 | 27 | 11 | 16 | |||
| 3 | 9 | 3 | 6 | |||
| 4 | 33 | 15 | 18 | |||
| N classification | 0.017* | |||||
| N0 | 77 | 46 | 31 | |||
| N+ | 23 | 7 | 16 | |||
| Stage | 0.048* | |||||
| I/II | 49 | 31 | 18 | |||
| III/IV | 51 | 22 | 29 | |||
| Recurrence | 0.047* | |||||
| No | 85 | 45 | 36 | |||
| Yes | 15 | 4 | 11 | |||
HPV: human papillomavirus; PNI: perineural invasion
Univariate analysis of overall survival in 100 HNC patients.
| Univariate | ||||
|---|---|---|---|---|
| Variables | No. | HR | 95% CI | P-value |
| Gender | 0.841 | |||
| Male | 94 | 0.841 | 0.105,6.296 | |
| Female | 6 | 1 | ||
| Age | 0.322 | |||
| > 60 | 36 | 1.775 | 0.570,5.524 | |
| ≤ 60 | 64 | 1 | ||
| T classification | ||||
| 3/4 | 42 | 7.372 | 1.614,33671 | 0.010* |
| 1/2 | 58 | 1 | ||
| N classification | 0.029* | |||
| N+ | 23 | 3.591 | 1.126,11.351 | |
| N0 | 77 | 1 | ||
| Stage | 0.095 | |||
| III/IV | 51 | 54.087 | 0.501,5834.7 | |
| I/II | 49 | 1 | ||
| PIGK | 0.043* | |||
| High | 47 | 8.270 | 1.065,64.216 | |
| Low | 53 | 1 |
Analysis of genetic alterations of PIGK in HNC
Using the cBioPortal database, we analyzed PIGK genetic alterations across various cancer subtypes in the TCGA PanCancer Atlas Studies dataset. The alteration frequency was 2% in 2922 samples, and the most common variation type was amplification (n = 32) (Supplementary Fig. S3A and B). In the TCGA/HNC cohort, the alteration rate was 1%, primarily consisting of missense mutations (V17M, A209S, P237L, Q273H, and D333G) (Fig. 3A and B). To explore potential mechanisms underlying PIGK overexpression, we analyzed GISTIC2-defined CNA in 509 patients with HNC and found a significant positive correlation between PIGK expression and log₂ copy number values (r = 0.39, P = 8.34 × 10⁻²⁰) (Fig. 3C), suggesting that copy number gain may partially account for PIGK upregulation.
Genomic alterations of PIGK in HNC. cBioPortal shows the frequencies (A) and types (B) of PIGK genetic alterations in the TCGA/HNC cohort. (C) PIGK mRNA expression (RSEM) stratified by GISTIC2-defined copy number alteration (CNA) categories (left panel) and correlation with Log2 copy number values (right panel) (n = 509). (D) Correlation between PIGK level (RSEM) and tumor mutation burden (TMB) in TCGA/HNC (n = 507).
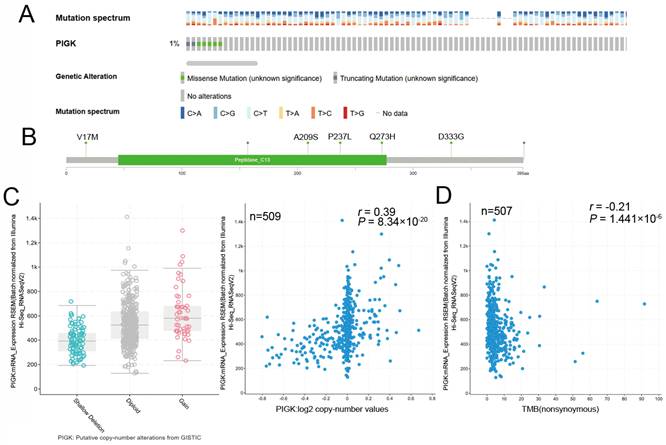
Additionally, PIGK mRNA levels were inversely correlated with TMB (r = -0.21, P = 1.44 × 10⁻⁶) (Fig. 3D), suggesting that PIGK may be associated with a low-mutation phenotype. To further investigate this association, we assessed PIGK levels across the mutation status of the ten most frequently altered cancer genes in TCGA/HNC cohort, including TP53 (69.3%), FAT1 (21.6%), CDKN2A (20.4%), PIK3CA (17.5%), NOTCH1 (17.1%), LRP1B (16.5%), PCLO (15.3%), KMT2D (15%), NSD1(11.7%), and CASP8 (10.7%). These mutations are predominantly found in HPV-negative HNC. TIMER2.0 analysis showed that PIGK levels were significantly higher in the wild-type groups of FAT1 (Wilcoxon rank-sum test, P = 3.1 × 10⁻²), CDKN2A (P = 3.7 × 10⁻³), NOTCH1 (P = 1.4 × 10⁻²), and CASP8 (P = 1.9 × 10⁻⁴) (Supplementary Fig. S4A-D). These findings suggest that the lower PIGK levels in HPV-negative HNC may be partially explained by the higher mutation burden and frequent alterations in tumor suppressor genes in this subgroup.
Functional and pathway analyses of PIGK co-expressed genes implicate its oncogenic potential in HNC
We evaluated the effects of PIGK knockdown on the migration, invasion, colony formation, and proliferation abilities of HNC cells. To validate PIGK expression, six HNC cell lines with different PIGK expression levels were screened, and SAS (low PIGK) and TW1.5 (high PIGK) were selected (Fig. 4A). Knockdown of PIGK expression in TW1.5 cells significantly reduced their cell viability, migration, invasion, and colony formation abilities compared with shluc control cells (Fig. 4B-E). Next, to explore the functional relevance of PIGK in HNC, we identified 1963 transcripts co-expressed with PIGK using the LinkedOmics database, based on the criteria of |correlation coefficient| > 0.3, P < 0.01, and FDR < 0.01 (Supplementary Table 1). GO enrichment analysis was performed using the DAVID database. The top-ranked biological processes included “cytoplasmic translation (GO:0002181, FDR = 2.4×10⁻²⁹),” and “DNA repair (GO:0006281, FDR = 3.9 × 10⁻⁷)” (Fig. 4F). For molecular function, enriched terms included “structural constituent of ribosome (GO:0003735, FDR = 4.2 × 10⁻²⁴)”, and “protein binding (GO:0005515, FDR = 1.3 × 10⁻²³)” (Fig. 4G).”
Functional and pathway enrichment analyses of PIGK co-expressed genes. (A) RT-qPCR measured the endogenous PIGK levels in six HNC cell lines. (B) RT-qPCR analysis of PIGK expression in TW1.5 after lentiviral-mediated RNA interference. The effect of PIGK knockdown on migration, invasion (C), colony formation assay (D), and cell viability (E) was evaluated in TW1.5 cells infected with shluc or shPIGK. Data were presented as the mean ± SD; **P < 0.01; *P < 0.05. (F) Gene Ontology (GO) Biological Process (BP) terms enriched among PIGK co-expressed transcripts (n = 517, LinkedOmics). Top-ranked terms with FDR < 0.01 are shown. (G) GO Molecular Function (MF) enrichment showing representative terms. (H) Ingenuity Pathway Analysis (IPA) disease/function annotation of PIGK co-expressed genes, which are ranked by P-value. (I) IPA canonical pathway analysis identifying enriched cancer-related signaling pathways, ordered by activation Z-score.
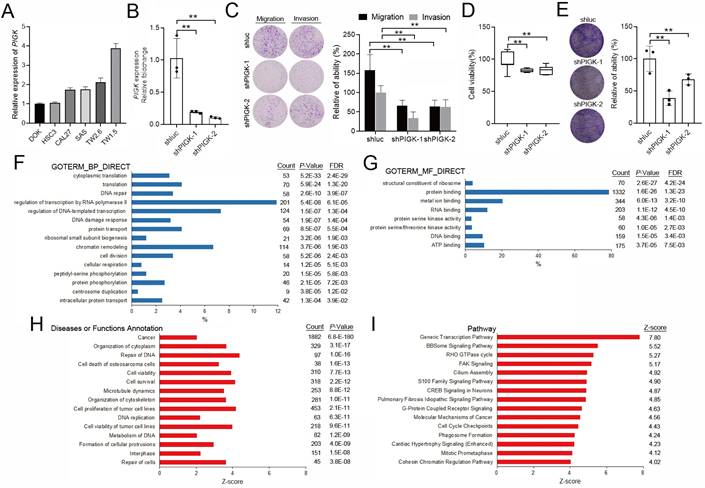
IPA further revealed that 1,882 of these genes (95.9%) were annotated under the disease/function category “cancer,” which showed a high significance (Z-score = 2.05, P = 6.8 × 10-¹⁸⁰) (Fig. 4H, Supplementary Table 2). Pathway analysis further identified several cancer-related signaling pathways with activation predictions, among which the “Generic Transcription Pathway (Z-score = 7.80)” and “BBSome Signaling Pathway (Z-score = 5.52) ranked highest. The “Molecular Mechanism of Cancer (Z-score = 4.56)” was also among the enriched terms (Fig. 4I), supporting the notion that PIGK may contribute to tumor progression in HNC by involving multiple cancer-associated signaling and regulatory pathways.
PIGK-associated PPI network highlights GPI-anchor biosynthesis in HNC
Building on our co-expression analysis implicating PIGK in HNC pathogenesis, we explored its protein-level interactions. A total of 76 experimentally validated PIGK-interacting proteins were retrieved from the BioGRID database (Supplementary Table 3). Of these, 56 were significantly correlated with PIGK in TCGA/HNC cohort after adjusting for tumor purity (Supplementary Table 4). To refine the network, we used Metascape to select physical interactors with a STRING interaction score > 0.132, yielding 40 proteins for the PPI network construction (Fig. 5A, Supplementary Table 5). Enrichment analysis of the PPI network (FDR < 0.01) revealed significant enrichment in “protein localization to organelle (GO:0033365),” “response to endoplasmic reticulum stress (GO: 0034976),” and “glycoprotein biosynthetic process (GO: 0009101)” (Fig. 5B), which are partly consistent with transcriptome-level findings.
Construction and enrichment analysis of PIGK-associated protein-protein interaction (PPI) network in HNC. (A) PPI network of 40 physical interactors of PIGK identified via Metascape with STRING interaction score > 0.132. (B) Enriched terms from the PPI network (FDR < 0.01). (C) Molecular Complex Detection (MCODE) clustering of the PPI network, identifying three sub-networks (left panel). The top three enriched terms for each cluster. Red denotes the cluster containing PIGK (right panel). (D) Correlation between a six-gene signature derived from the PIGK-containing cluster and PIGK expression. (E) Kaplan-Meier overall survival analysis stratified by the signature score.
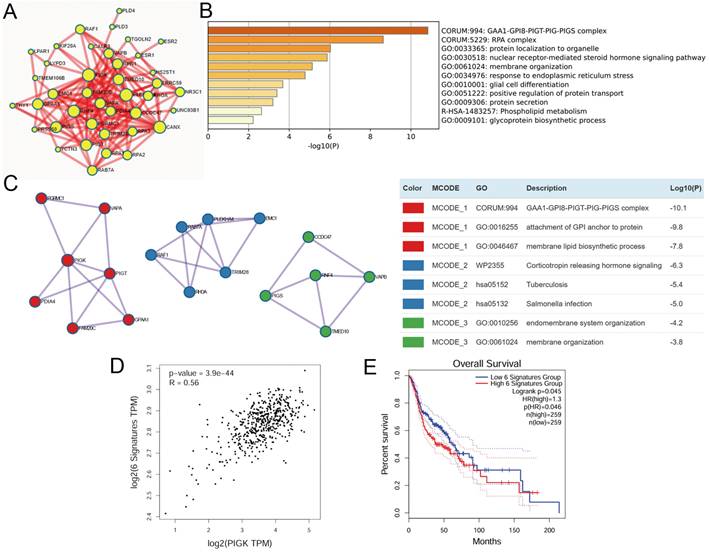
Subsequent MCODE clustering identified three sub-networks (Fig. 5C), with PIGK localized in a cluster enriched in terms such as “GAA1-GPI8-PIGT-PIG-PIGS complex (CORUM:994),” “attachment of GPI anchor to protein (GO:0016255),” and “membrane lipid biosynthetic process (GO:0046467)” (Fig. 5C). To assess the clinical relevance of this cluster, we constructed a six-gene signature based on its members (VAPA, PIGT, GPAA1, PGRMC1, FAM20C, and PDIA4), which showed a significant positive correlation with PIGK (r = 0.56, P = 3.9 × 10-44) (Fig. 5D) and was modestly associated with worse OS (P = 4.5 × 10⁻²) (Fig. 5E). Additionally, PIGK levels positively correlated with other GPI-T subunits (PIGU, PIGT, GPAA1, and PIGS) (Supplementary Figure S5A-D). Given that GPI-anchored proteins are typically localized in lipid rafts that organize oncogenic signaling [8-10], we further examined the association between PIGK levels and a lipid-rapid-related signature (STOM, PHB1, FLOT1, FLOT2, CAV1, CAV2, and CAV3), which revealed a significant positive correlation (r = 0.46, P = 5.7 × 10⁻²⁸) (Supplementary Fig. S5E). Collectively, these findings suggest that PIGK promotes HNC progression through its involvement in GPI-anchor biosynthesis and membrane-associated signaling pathways that modulate the localization or activity of signaling proteins.
FAM20C is a potential interactor of PIGK associated with prognosis in HNC
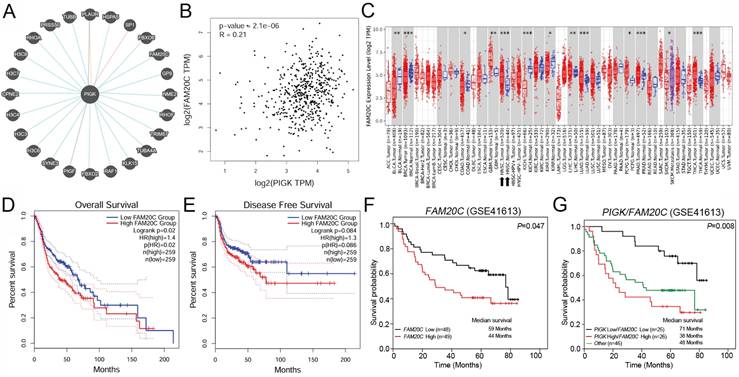
To identify functionally relevant PIGK interactors, we intersected six molecules (VAPA, PIGT, GPAA1, PGRMC1, FAM20C, and PDIA4) in the same MCODE cluster with PIGK-linked molecules in the Pathway Commons database (Fig. 6A), an integrative resource of curated pathways and interaction data [21]. FAM20C emerged as the only overlapping gene, indicating its potential biological relevance. In the TCGA/HNC cohort, PIGK was positively correlated with FAM20C (r = 0.21, P = 2.1 × 10⁻⁶) (Fig. 6B). Additionally, FAM20C was significantly upregulated in tumor tissues compared with normal tissues (P < 1 × 10⁻³) and correlated with nodal metastasis (P = 4.53 × 10⁻³) and advanced overall stage (P = 5.04 × 10⁻³) (Fig. 6C, Table 4). Survival analysis revealed that patients with high FAM20C (FAM20Chigh) levels had significantly worse OS (log-rank P = 2 × 10⁻², HR = 1.4), although disease-free survival showed only a marginal trend (P = 8.4 × 10⁻²) (Fig. 6D and E). These findings were validated in the GSE41613 cohort, where low FAM20C levels (FAM20Clow) were associated with markedly better OS (P = 4.7 × 10⁻²) (Fig. 6F). Further combined expression analysis revealed that patients with PIGKlow/FAM20Clow (n =25) had the most favorable OS, whereas PIGKhigh/FAM20Chigh correlated with the poorest prognosis (P = 8 × 10⁻³) (Fig. 6G). Next, we further evaluated whether PIGK mediated FAM20C expression in HNC cells. Knockdown of PIGK significantly reduced FAM20C levels in TW1.5 cells (Supplementary Fig. S6). These results suggest that FAM20C might act in concert with PIGK and jointly contribute to HNC progression.
The correlation of FAM20C levels with clinicopathological features in TCGA/ head and neck cancer.
| FAM20C | ||||
|---|---|---|---|---|
| Variable | Mean ± SD | n = 490 | P-value | |
| Age | 0.14756 | |||
| ≥ 60 | 12.09±10.51 | 273 | ||
| < 60 | 10.90±6.65 | 216 | ||
| Sex | 0.82959 | |||
| Male | 11.61±9.13 | 360 | ||
| Female | 11.42±8.71 | 130 | ||
| Anatomic | 0.02293 | |||
| Oral | 12.30±9.92 | 300 | ||
| Non-Oral | 10.40±7.23 | 190 | ||
| HPV stats | 0.26879 | |||
| Negative | 11.65±9.05 | 407 | ||
| Positive | 5.71±1.74 | 69 | ||
| Alcohol consumption | 0.80042 | |||
| Ever/active | 11.64±8.85 | 324 | ||
| No | 11.42±9.34 | 166 | ||
| Smoking status | 0.93868 | |||
| ever/active | 11.54±7.51 | 305 | ||
| No | 11.60±11.07 | 185 | ||
| Differentiation | 0.19304 | |||
| Well/moderate | 11.20±8.23 | 353 | ||
| Poor | 12.56±10.87 | 118 | ||
| AJCC T | 0.59241 | |||
| 1+2 | 11.29±8.92 | 189 | ||
| 3+4 | 11.73±9.08 | 301 | ||
| AJCC N | 0.00453* | |||
| N0 | 10.33±7.62 | 222 | ||
| N+ | 12.66±9.97 | 264 | ||
| Stage | 0.00504* | |||
| I-III | 10.20±7.01 | 202 | ||
| IV | 12.52±10.09 | 288 | ||
TCGA: The Cancer Genome Atlas Program; SD: standard deviation; HPV: human papillomavirus; AJCC: American Joint Committee of Cancer
FAM20C is a potential PIGK interactor associated with poor prognosis in HNC. (A) PIGK-associated genes from Pathway Commons database. (B) Correlation between PIGK and FAM20C levels in the TCGA/HNC cohort. (C) FAM20C levels in multiple cancers from TCGA cohort. Kaplan-Meier survival analysis showing overall survival (OS) (D) and disease-free survival (DFS) (E) stratified by FAM20C levels in TCGA/HNC cohort. (F) OS analysis by FAM20C levels in the GSE41613 dataset. (G) Combined OS analysis based on PIGK and FAM20C expression levels in the GSE41613 dataset.
PIGK expression is associated with stromal remodeling and adverse immune contexture in the HNC TME
To investigate the relationship between PIGK expression and TME in HNC, we analyzed bulk RNA-seq data from the TCGA/HNC cohort. Using the CIBERSORT and EPIC algorithms, we found that PIGK expression was inversely correlated with the infiltration of CD8⁺ T-, natural killer activated-, T follicular helper-, and memory B cells and positively correlated with CAFs and endothelial cells (Fig. 7A). Stratified survival analysis showed that in PIGK-high tumors, low CD8+ and T follicular helper cell infiltration and high CAF abundance were associated with worse survival, suggesting that the prognostic significance of these cell types may be influenced by PIGK expression (Fig. 7B).
PIGK expression is associated with stromal enrichment and altered immune infiltration in HNC. (A) The TIMER2.0 database revealed a correlation of PIGK expression with immune and stromal cell infiltration estimated using CIBERSORT and EPIC algorithms in TCGA/HNC cohort (n = 522). (B) Survival analysis stratified by CD8⁺ T cell, NK activated cell, T follicular helper cell, memory B cells, cancer-associated fibroblast (CAF), and endothelial cell infiltration and PIGK levels in bulk tumors. (C) Single-cell RNA-seq analysis from the GSE103322 dataset showing PIGK levels correlation with tumor stage in malignant cells (left) and across cell types (right), based on TISCH2. (D-F) CAF scores based on decorin (DCN), podoplanin (PDPN), and fibroblast activation protein alpha (FAP) expression, showing differential expression between normal (n = 519) and tumor tissues (n = 44) (D), correlation with PIGK (E), and prognostic significance (F). (G) Gene set enrichment analysis showing numerous upregulated oncogenic signatures in fibroblast populations (TISCH2). (H) Cell-cell interaction analysis showing frequent interaction counts between malignant and fibroblast clusters (TISCH2). Statistical significance: *q < 0.05, **q < 0.01, ***q <0.001. (I) MRC-5 cells (fibroblasts) were co-cultured with TW1.5/shluc and TW1.5/shPIGK cells for 72 h, followed by RT-qPCR analysis. Data were presented as the mean ± SD; **P < 0.01; *P < 0.05.
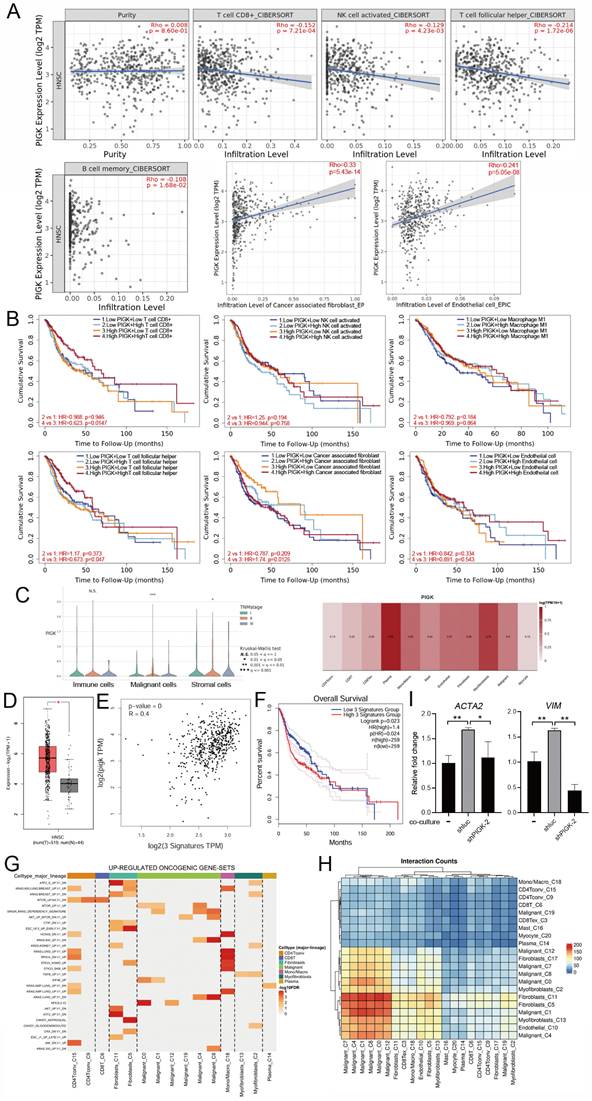
Single-cell RNA-seq data from the GSE103322 dataset showed that PIGK expression in malignant cells increased with the tumor stage (Fig. 7C). Among the stromal and immune cell populations with prognostic significance, fibroblasts exhibited the highest PIGK expression (Fig. 7C). Given that CAFs are prominent in the tumor stroma of HNC and are known to exert immunosuppressive effects [27-29], we hypothesized that PIGK may be involved in CAF-mediated tumor-promoting processes. To test this, we analyzed CAF scores based on DCN, PDPN, and FAP expression, as previously described by Calon et al. [25]. The three-gene signature was significantly higher in bulk tumors, positively correlated with PIGK (r = 0.4) and associated with poor prognosis (P = 2.3 × 10⁻²) (Fig. 7D-F). Functional enrichment analysis using TISCH2 revealed that the upregulated oncogenic gene sets were predominantly enriched in fibroblast (C5 and C11) and mono/macrophage (C18) populations (Fig. 7G). Moreover, cell-cell interaction analysis showed that malignant clusters (C0, C1, C4, C7, C8, and C12) had abundant interaction counts with fibroblast clusters (C5 and C11) and myofibroblast (C13) (Fig. 7H). We further examined the effect of PIGK on fibroblast activation. The RT-qPCR results showed CAF markers were downregulated in fibroblasts co-cultured with PIGK-knockdown cells compared with those co-cultured with control cells (Fig. 7I). These data support the hypothesis that PIGK-expressing tumor cells might interact with fibroblasts to shape an immunosuppressive TME and contribute to adverse survival outcomes in HNC.
PIGK level correlates with the response to taxane-based chemotherapy in HNC
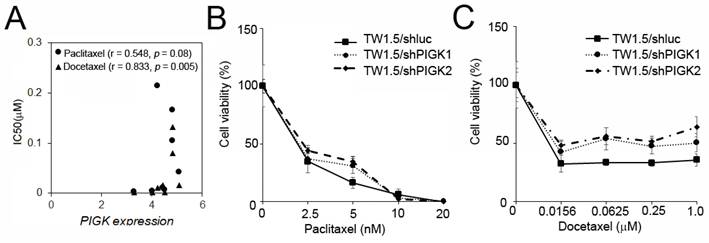
To assess the potential link between PIGK expression and chemotherapeutic resistance, we analyzed the HNC cell line data from the Cancer Cell Line Encyclopedia (CCLE) and Genomics of Drug Sensitivity in Cancer (GDSC) databases. PIGK mRNA expression across eight HNC cell lines was compared with the IC50 values of six commonly used drugs: cisplatin, 5-fluorouracil (5-FU), docetaxel, paclitaxel, methotrexate, and doxorubicin. A significant positive correlation was observed between PIGK levels and docetaxel IC50 (r = 0.833, P = 5 × 10⁻³), while a positive but nonsignificant trend was also noted for paclitaxel (r = 0.548, P = 8× 10⁻²) (Table 5, Fig. 8A). To further examine the effect of PIGK on HNC cells' response to docetaxel and paclitaxel, we knocked down PIGK in TW1.5 cells. As shown in Fig. 8B-C, TW1.5/shPIGK cells displayed resistance to paclitaxel and docetaxel, suggesting increased sensitivity in a high PIGK background. These results support the potential role of PIGK in mediating taxane-based chemotherapy responses in HNC.
The association of PIGK level and the IC50 of chemotherapeutic agents
| PIGK level | ||
|---|---|---|
| Drug | Correlation | P-value |
| Cisplatin | -0.143 | 0.394 |
| 5-fluorouracil | 0.095 | 0.411 |
| Paclitaxel | 0.548 | 0.080 |
| Docetaxel | 0.833 | 0.005* |
| Methotrexate | -0.310 | 0.228 |
| Doxorubicin | -0.143 | 0.368 |
PIGK levels associated with chemotherapy drug response in HNC cell lines. (A) PIGK levels and the IC50 values for paclitaxel and docetaxel in eight HNC cell lines. The data from Cancer Cell Line Encyclopedia (CCLE) and Genomics of Drug Sensitivity in Cancer (GDSC) databases. MTT assay showed the cell viability of TW1.5/shPIGK and TW1.5/shluc cells after treatment with paclitaxel (B) and docetaxel (C).
Discussion
PIGK, located on chromosome 1p34.1, encodes a 47 kDa protein that serves as the catalytic subunit of the GPI-T complex [30-32]. As a member of the C13 cysteine protease family, PIGK contains a luminal caspase-like domain and a single transmembrane region [30-32].
Recent cryogenic electron microscopy studies revealed a catalytic triad (His164-Cys206-Asn58) within PIGK, supporting a legumain-like transamidation mechanism for GPI attachment [33, 34]. A systematic knockout screen in HEK293 cells has further demonstrated that the loss of PIGK alone abolished the surface expression of GPI-APs, underscoring its indispensable role in GPI biosynthesis [35]. Given the importance of GPI-AP biosynthesis for cellular functions, PIGK dysregulation has been implicated in human diseases. Inherited biallelic loss-of-function mutations in PIGK cause GPI-deficiency syndromes characterized by neurodevelopmental phenotypes [36]. In cancer, PIGK shows tissue-specific expression changes that are upregulated in ovarian, uterine, and breast cancers but downregulated in bladder, liver, and colorectal cancers [37]. Functional assays have further demonstrated that PIGK overexpression enhanced the proliferation and invasion of breast cancer cell lines, suggesting an oncogenic role [37]. In colon cancer, a common 3′UTR single-nucleotide polymorphism (rs1048575, C/G or G/G alleles) is associated with reduced PIGK protein expression levels, suggesting post-transcriptional regulatory effects [38]. In the current study, we showed that PIGK functions as an oncogene in HNC and that its overexpression is likely driven by copy number gains.
While high PIGK expression is associated with poor prognosis and increased CAF infiltration, it is inversely correlated with TMB. This observation suggests that PIGK-mediated tumor progression occurs through non-mutational mechanisms. In support of this hypothesis, we found that tumors harboring wild-type forms of tumor suppressor genes that are frequently mutated in HNC, including FAT1, CDKN2A, CASP8, and NOTCH1, exhibited higher PIGK expression levels. A previous study has shown that NOTCH1 amplification in CAFs suppresses the DNA damage response and promotes stromal cell expansion and tumor progression in cutaneous squamous cell carcinoma [39]. Another report has found that FAT1 upregulation in lung cancer enhanced transforming growth factor-β and epithelial-mesenchymal transition signaling, increased CAF abundance, reduced CD8⁺ T cell infiltration, and was linked to low TMB [40]. These findings suggest that PIGK may contribute to oncogenesis through the transcriptional activation of oncogenic programs or remodeling of the tumor stroma rather than through the accumulation of genetic mutations, which is consistent with its association with an immunosuppressive phenotype.
One potential mechanism linking high PIGK expression to poor outcomes involves FAM20C, which was identified as a candidate co-target of PIGK in a two-gene combination analysis. FAM20C is a Golgi-residing kinase that phosphorylates secretory proteins at the Ser-x-Glu/phospho-Ser motif and accounts for most of the extracellular phosphoproteome [41]. As a type II transmembrane protein, FAM20C is activated by proteolytic cleavage by site-1 protease, a process that connects its regulation to lipid homeostasis and osteoblast differentiation [42]. Functionally, FAM20C is a non-canonical kinase that modifies over 100 substrates involved in ER homeostasis, metabolism, and coagulation [43, 44]. Consistent with these broad roles, loss-of-function mutations in FAM20C cause several human diseases, including amelogenesis imperfecta, Raine syndrome, and cardiovascular and endocrine disorders [44]. Emerging evidence implicates FAM20C in cancer progression. In breast cancer, FAM20C promotes bone metastasis by phosphorylating bone morphogenetic protein 4 and enhancing osteoclastogenesis [45]. In glioma, FAM20C drives tumor cell migration and invasion in vitro, and the FAM20C antibody significantly reduces tumor size in vivo [46]. In our study, transcriptomic analysis identified FAM20C as an adverse prognostic factor for HNC. Moreover, MCODE-based clustering revealed that PIGK and FAM20C belong to the same protein-protein interaction module enriched in cancer-related pathways. This co-clustering, together with their synergistic prognostic significance, suggests that PIGK and FAM20C may function in related pathways. Mechanistically, prior proteomic and co-immunoprecipitation studies have identified PIGK as part of the FAM20C interactome under ER stress, with both proteins localized in the ER lumen [47]. FAM20C phosphorylates protein disulfide isomerase at Ser357, modulating its chaperone function to alleviate ER stress [47]. However, it remains to be determined whether FAM20C-driven mechanisms under ER stress influence GPI-anchoring processes and PIGK function, particularly in the context of tumor biology.
In the present study, in vitro analyses demonstrated that PIGK knockdown reduced chemosensitivity to both paclitaxel and docetaxel, suggesting that high PIGK expression may be associated with enhanced responsiveness to taxane-based chemotherapy. Although paclitaxel is less commonly used for HNC, it remains a recognized option in the salvage/recurrent setting. Paclitaxel combined with cetuximab has demonstrated activity in patients who are unfit for or refractory to platinum-based treatment [48-50]. Docetaxel, on the other hand, is widely used in various treatment settings. For example, in locally advanced unresectable diseases, the addition of docetaxel to cisplatin/5-FU (TPF induction regimen) prolongs patient survival [51, 52]. Similarly, docetaxel has been adopted in concurrent chemoradiotherapy settings [53] and in the recurrent setting when combined with methotrexate and cetuximab [54] or as a substitute for 5-FU in the EXTREME regimen (platinum-fluorouracil-cetuximab) [55]. Taken together, these results suggest that PIGK expression may serve not only as a prognostic biomarker but also as a predictive marker for taxane responsiveness. Identifying PIGK-high patients may help optimize treatment decisions by favoring taxane-based regimens, potentially improving the therapeutic outcomes in this subgroup. Further mechanistic studies and clinical validation are warranted to establish the role of PIGK in personalized chemotherapy for HNC.
Conclusion
Taken together, we found that PIGK mRNA and protein levels were significantly elevated in tumor tissues and were consistently associated with adverse clinical features across independent HNC cohorts. Genomic analysis linked PIGK upregulation with copy number gain, whereas tumors harboring common tumor suppressor mutations (frequent in HPV-negative HNC) showed lower PIGK levels, potentially explaining the differences in PIGK levels by HPV status. Protein interaction analyses further connected PIGK to GPI-anchor biosynthesis and membrane-associated signaling, with FAM20C emerging as a potential co-regulated partner. Functional assays confirmed that PIGK knockdown inhibited malignant phenotypes, decreased FAM20C expression, reduced taxane sensitivity, and weakened fibroblast activation, supporting PIGK as a potential oncogenic driver and predictive biomarker with prognostic and therapeutic relevance in HNC.
Supplementary Material
Supplementary figures and tables.
Acknowledgements
This study was supported by Kaohsiung Veterans General Hospital (KSVGH-114-053) to YHL; National Science and Technology Council (NSTC-113-2314-B-075B-001 and 114-2314-B-075B-011) to YHL, and (NSTC 113-2314-B-075B-002 and 114-2314-B-075B-014-MY3) to YFY.
Authorship contributions
YHL designed the study. YHL and JBL provided materials. YFY, JBL, CYC, and PLY performed experiments. YFY and YHL analyzed and interpreted the data. YFY and YHL confirm the authenticity of all the raw data. YHL drafted the manuscript. All the authors reviewed and approved the manuscript.
Ethics approval
The Kaohsiung Veterans General Hospital ethics committee gave its approval for the study (Approval number: KSVGH23-CT8-10).
Competing Interests
The authors have declared that no competing interest exists.
References
1. Bray F, Laversanne M, Sung H, Ferlay J, Siegel RL, Soerjomataram I, Jemal A. Global cancer statistics 2022: GLOBOCAN estimates of incidence and mortality worldwide for 36 cancers in 185 countries. CA Cancer J Clin. 2024;74:229-263
2. Ruffin AT, Li H, Vujanovic L, Zandberg DP, Ferris RL, Bruno TC. Improving head and neck cancer therapies by immunomodulation of the tumour microenvironment. Nat Rev Cancer. 2023;23:173-188
3. Miyauchi S, Kim SS, Pang J, Gold KA, Gutkind JS, Califano JA, Mell LK, Cohen EEW, Sharabi AB. Immune Modulation of Head and Neck Squamous Cell Carcinoma and the Tumor Microenvironment by Conventional Therapeutics. Clin Cancer Res. 2019;25:4211-4223
4. Cancer Genome Atlas N. Comprehensive genomic characterization of head and neck squamous cell carcinomas. Nature. 2015;517:576-582
5. Hong Y, Ohishi K, Kang JY, Tanaka S, Inoue N, Nishimura J, Maeda Y, Kinoshita T. Human PIG-U and yeast Cdc91p are the fifth subunit of GPI transamidase that attaches GPI-anchors to proteins. Mol Biol Cell. 2003;14:1780-1789
6. Kinoshita T, Fujita M. Biosynthesis of GPI-anchored proteins: special emphasis on GPI lipid remodeling. J Lipid Res. 2016;57:6-24
7. Kinoshita T. Biosynthesis and biology of mammalian GPI-anchored proteins. Open Biol. 2020;10:190290
8. Xu Y, Li T, Zhou Z, Hong J, Chao Y, Zhu Z, Zhang Y, Qu Q, Li D. Structures of liganded glycosylphosphatidylinositol transamidase illuminate GPI-AP biogenesis. Nat Commun. 2023;14:5520
9. Li D. Structure and Function of the Glycosylphosphatidylinositol Transamidase, a Transmembrane Complex Catalyzing GPI Anchoring of Proteins. Subcell Biochem. 2024;104:425-458
10. Gamage DG, Hendrickson TL. GPI transamidase and GPI anchored proteins: oncogenes and biomarkers for cancer. Crit Rev Biochem Mol Biol. 2013;48:446-464
11. Guo Z, Linn JF, Wu G, Anzick SL, Eisenberger CF, Halachmi S, Cohen Y, Fomenkov A, Hoque MO, Okami K. et al. CDC91L1 (PIG-U) is a newly discovered oncogene in human bladder cancer. Nat Med. 2004;10:374-381
12. Jiang WW, Zahurak M, Zhou ZT, Park HL, Guo ZM, Wu GJ, Sidransky D, Trink B, Califano JA. Alterations of GPI transamidase subunits in head and neck squamous carcinoma. Mol Cancer. 2007;6:74
13. Yiping Huang JKN, Barry Trink, Edward A. Ratovitski: Tobacco Smoke Activates Protein Association and Tyrosine Phosphorylation of the GPI-Transamidase Complex Subunits in Human Cancers. Journal of Epithelial Biology & Pharmacology. 2009;2:14-22
14. Zhang XX, Ni B, Li Q, Hu LP, Jiang SH, Li RK, Tian GA, Zhu LL, Li J, Zhang XL. et al. GPAA1 promotes gastric cancer progression via upregulation of GPI-anchored protein and enhancement of ERBB signalling pathway. J Exp Clin Cancer Res. 2019;38:214
15. Gao J, Aksoy BA, Dogrusoz U, Dresdner G, Gross B, Sumer SO, Sun Y, Jacobsen A, Sinha R, Larsson E. et al. Integrative analysis of complex cancer genomics and clinical profiles using the cBioPortal. Sci Signal. 2013;6:pl1
16. Lin YH, Yang YF, Liao JB, Chang TS, Janesha UGS, Shiue YL. Analysis of Aldehyde Dehydrogenase 2 as a Prognostic Marker Associated with Immune Cell infiltration and Chemotherapy Efficacy in Head and Neck Squamous Cell Carcinoma. J Cancer. 2023;14:1689-1706
17. Lin YH, Lee YC, Liao JB, Yu PL, Chou CY, Yang YF. Alda-1 restores ALDH2-mediated alcohol metabolism to inhibit the NF-kappaB/VEGFC axis in head and neck cancer. Int J Mol Med. 2025 55
18. Li T, Fu J, Zeng Z, Cohen D, Li J, Chen Q, Li B, Liu XS. TIMER2.0 for analysis of tumor-infiltrating immune cells. Nucleic Acids Res. 2020;48:W509-W514
19. Vasaikar SV, Straub P, Wang J, Zhang B. LinkedOmics: analyzing multi-omics data within and across 32 cancer types. Nucleic Acids Res. 2018;46:D956-D963
20. Dennis G Jr, Sherman BT, Hosack DA, Yang J, Gao W, Lane HC, Lempicki RA. DAVID: Database for Annotation, Visualization, and Integrated Discovery. Genome Biol. 2003;4:P3
21. Oughtred R, Rust J, Chang C, Breitkreutz BJ, Stark C, Willems A, Boucher L, Leung G, Kolas N, Zhang F. et al. The BioGRID database: A comprehensive biomedical resource of curated protein, genetic, and chemical interactions. Protein Sci. 2021;30:187-200
22. Zhou Y, Zhou B, Pache L, Chang M, Khodabakhshi AH, Tanaseichuk O, Benner C, Chanda SK. Metascape provides a biologist-oriented resource for the analysis of systems-level datasets. Nat Commun. 2019;10:1523
23. Rodchenkov I, Babur O, Luna A, Aksoy BA, Wong JV, Fong D, Franz M, Siper MC, Cheung M, Wrana M. et al. Pathway Commons 2019 Update: integration, analysis and exploration of pathway data. Nucleic Acids Res. 2020;48:D489-D497
24. Tang Z, Kang B, Li C, Chen T, Zhang Z. GEPIA2: an enhanced web server for large-scale expression profiling and interactive analysis. Nucleic Acids Res. 2019;47:W556-W560
25. Calon A, Lonardo E, Berenguer-Llergo A, Espinet E, Hernando-Momblona X, Iglesias M, Sevillano M, Palomo-Ponce S, Tauriello DV, Byrom D. et al. Stromal gene expression defines poor-prognosis subtypes in colorectal cancer. Nat Genet. 2015;47:320-329
26. Han Y, Wang Y, Dong X, Sun D, Liu Z, Yue J, Wang H, Li T, Wang C. TISCH2: expanded datasets and new tools for single-cell transcriptome analyses of the tumor microenvironment. Nucleic Acids Res. 2023;51:D1425-D1431
27. Bienkowska KJ, Hanley CJ, Thomas GJ. Cancer-Associated Fibroblasts in Oral Cancer: A Current Perspective on Function and Potential for Therapeutic Targeting. Front Oral Health. 2021;2:686337
28. Galbo PM Jr, Zang X, Zheng D. Molecular Features of Cancer-associated Fibroblast Subtypes and their Implication on Cancer Pathogenesis, Prognosis, and Immunotherapy Resistance. Clin Cancer Res. 2021;27:2636-2647
29. Chen Y, McAndrews KM, Kalluri R. Clinical and therapeutic relevance of cancer-associated fibroblasts. Nat Rev Clin Oncol. 2021;18:792-804
30. Meyer U, Benghezal M, Imhof I, Conzelmann A. Active site determination of Gpi8p, a caspase-related enzyme required for glycosylphosphatidylinositol anchor addition to proteins. Biochemistry. 2000;39:3461-3471
31. Ohishi K, Inoue N, Maeda Y, Takeda J, Riezman H, Kinoshita T. Gaa1p and gpi8p are components of a glycosylphosphatidylinositol (GPI) transamidase that mediates attachment of GPI to proteins. Mol Biol Cell. 2000;11:1523-1533
32. Zacks MA, Garg N. Recent developments in the molecular, biochemical and functional characterization of GPI8 and the GPI-anchoring mechanism [review]. Mol Membr Biol. 2006;23:209-225
33. Zhang H, Su J, Li B, Gao Y, Liu M, He L, Xu H, Dong Y, Zhang XC, Zhao Y. Structure of human glycosylphosphatidylinositol transamidase. Nat Struct Mol Biol. 2022;29:203-209
34. Xu Y, Jia G, Li T, Zhou Z, Luo Y, Chao Y, Bao J, Su Z, Qu Q, Li D. Molecular insights into biogenesis of glycosylphosphatidylinositol anchor proteins. Nat Commun. 2022;13:2617
35. Liu SS, Liu YS, Guo XY, Murakami Y, Yang G, Gao XD, Kinoshita T, Fujita M. A knockout cell library of GPI biosynthetic genes for functional studies of GPI-anchored proteins. Commun Biol. 2021;4:777
36. Nguyen TTM, Murakami Y, Mobilio S, Niceta M, Zampino G, Philippe C, Moutton S, Zaki MS, James KN, Musaev D. et al. Bi-allelic Variants in the GPI Transamidase Subunit PIGK Cause a Neurodevelopmental Syndrome with Hypotonia, Cerebellar Atrophy, and Epilepsy. Am J Hum Genet. 2020;106:484-495
37. Nagpal JK, Dasgupta S, Jadallah S, Chae YK, Ratovitski EA, Toubaji A, Netto GJ, Eagle T, Nissan A, Sidransky D. et al. Profiling the expression pattern of GPI transamidase complex subunits in human cancer. Mod Pathol. 2008;21:979-991
38. Dasgupta S, Pal P, Mukhopadhyay ND, Fu Y, Ratovitski EA, Moon CS, Hoque MO, Fisher PB, Trink B. A single nucleotide polymorphism in the human PIGK gene associates with low PIGK expression in colorectal cancer patients. Int J Oncol. 2012;41:1405-1410
39. Katarkar A, Bottoni G, Clocchiatti A, Goruppi S, Bordignon P, Lazzaroni F, Gregnanin I, Ostano P, Neel V, Dotto GP. NOTCH1 gene amplification promotes expansion of Cancer Associated Fibroblast populations in human skin. Nat Commun. 2020;11:5126
40. Chen C, Li Y, Liu H, Liao M, Yang J, Liu J. FAT1 upregulation is correlated with an immunosuppressive tumor microenvironment and predicts unfavorable outcome of immune checkpoint therapy in non-small cell lung cancer. Heliyon. 2024;10:e28356
41. Zhang R, Ren Y, Ju Y, Zhang Y, Zhang Y, Wang Y. FAM20C: A key protein kinase in multiple diseases. Genes Dis. 2023;12:101179
42. Chen X, Zhang J, Liu P, Wei Y, Wang X, Xiao J, Wang CC, Wang L. Proteolytic processing of secretory pathway kinase Fam20C by site-1 protease promotes biomineralization. Proc Natl Acad Sci U S A. 2021 118
43. Tagliabracci VS, Wiley SE, Guo X, Kinch LN, Durrant E, Wen J, Xiao J, Cui J, Nguyen KB, Engel JL. et al. A Single Kinase Generates the Majority of the Secreted Phosphoproteome. Cell. 2015;161:1619-1632
44. Worby CA, Mayfield JE, Pollak AJ, Dixon JE, Banerjee S. The ABCs of the atypical Fam20 secretory pathway kinases. J Biol Chem. 2021;296:100267
45. Zuo H, Yang D, Wan Y. Fam20C Regulates Bone Resorption and Breast Cancer Bone Metastasis through Osteopontin and BMP4. Cancer Res. 2021;81:5242-5254
46. Gong B, Liang Y, Zhang Q, Li H, Xiao J, Wang L, Chen H, Yang W, Wang X, Wang Y. et al. Epigenetic and transcriptional activation of the secretory kinase FAM20C as an oncogene in glioma. J Genet Genomics. 2023;50:422-433
47. Yu J, Li T, Liu Y, Wang X, Zhang J, Wang X, Shi G, Lou J, Wang L, Wang CC. et al. Phosphorylation switches protein disulfide isomerase activity to maintain proteostasis and attenuate ER stress. EMBO J. 2020;39:e103841
48. Hitt R, Irigoyen A, Cortes-Funes H, Grau JJ, Garcia-Saenz JA, Cruz-Hernandez JJ, Spanish H, Neck Cancer Cooperative G. Phase II study of the combination of cetuximab and weekly paclitaxel in the first-line treatment of patients with recurrent and/or metastatic squamous cell carcinoma of head and neck. Ann Oncol. 2012;23:1016-1022
49. Koyama T, Kiyota N, Boku S, Imamura Y, Shibata N, Satake H, Tanaka K, Hayashi H, Onoe T, Asada Y. et al. A phase II trial of paclitaxel plus biweekly cetuximab for patients with recurrent or metastatic head and neck cancer previously treated with both platinum-based chemotherapy and anti-PD-1 antibody. ESMO Open. 2024;9:103476
50. Aguin S, Carral A, Iglesias L, Pena C, Molina A, Costa M, Covela M, Gomez JG, Arroyo RG, Huidobro G. et al. Real-world Data of Paclitaxel and Cetuximab in Recurrent/Metastatic Squamous Cell Carcinoma of the Head and Neck. Cancer Diagn Progn. 2023;3:264-271
51. Vermorken JB, Remenar E, van Herpen C, Gorlia T, Mesia R, Degardin M, Stewart JS, Jelic S, Betka J, Preiss JH. et al. Cisplatin, fluorouracil, and docetaxel in unresectable head and neck cancer. N Engl J Med. 2007;357:1695-1704
52. Posner MR, Hershock DM, Blajman CR, Mickiewicz E, Winquist E, Gorbounova V, Tjulandin S, Shin DM, Cullen K, Ervin TJ. et al. Cisplatin and fluorouracil alone or with docetaxel in head and neck cancer. N Engl J Med. 2007;357:1705-1715
53. Patil VM, Noronha V, Menon N, Singh A, Ghosh-Laskar S, Budrukkar A, Bhattacharjee A, Swain M, Mathrudev V, Nawale K. et al. Results of Phase III Randomized Trial for Use of Docetaxel as a Radiosensitizer in Patients With Head and Neck Cancer, Unsuitable for Cisplatin-Based Chemoradiation. J Clin Oncol. 2023;41:2350-2361
54. Cohen EEW, Soulieres D, Le Tourneau C, Dinis J, Licitra L, Ahn MJ, Soria A, Machiels JP, Mach N, Mehra R. et al. Pembrolizumab versus methotrexate, docetaxel, or cetuximab for recurrent or metastatic head-and-neck squamous cell carcinoma (KEYNOTE-040): a randomised, open-label, phase 3 study. Lancet. 2019;393:156-167
55. Guigay J, Auperin A, Fayette J, Saada-Bouzid E, Lafond C, Taberna M, Geoffrois L, Martin L, Capitain O, Cupissol D. et al. Cetuximab, docetaxel, and cisplatin versus platinum, fluorouracil, and cetuximab as first-line treatment in patients with recurrent or metastatic head and neck squamous-cell carcinoma (GORTEC 2014-01 TPExtreme): a multicentre, open-label, randomised, phase 2 trial. Lancet Oncol. 2021;22:463-475
Author contact
![]() Corresponding author: Yu-Hsuan Lin, MD, PhD, Department of Otolaryngology, Head and Neck Surgery, Kaohsiung Veterans General Hospital, No 386, Ta-Chung 1st Road, Kaohsiung 813, Taiwan, R.O.C. Phone: 886-7-558-1250, Fax: 886-7-342-2121, Email: yhlin0619gov.tw or lucaslinyhcom.
Corresponding author: Yu-Hsuan Lin, MD, PhD, Department of Otolaryngology, Head and Neck Surgery, Kaohsiung Veterans General Hospital, No 386, Ta-Chung 1st Road, Kaohsiung 813, Taiwan, R.O.C. Phone: 886-7-558-1250, Fax: 886-7-342-2121, Email: yhlin0619gov.tw or lucaslinyhcom.