Impact Factor ISSN: 1449-1907

 Global reach, higher impact
Int J Med Sci 2022; 19(4):609-617. doi:10.7150/ijms.70614 This issue Cite
Research Paper
Expression of Membrane Bound O-Acyltransferase Domain Containing 7 after Myocardial Infarction and its Role in Lipid Metabolism in vitro
Xiangdong Li1, Zhiyuan Wang2, Heyu Meng1, Fanbo Meng1 ![]() , Ping Yang1
, Ping Yang1 ![]()
1. Cardiovascular Department of China-Japan Union Hospital of Jilin University.
2. Ultrasound Department of China-Japan Union Hospital of Jilin University.
Received 2021-12-30; Accepted 2022-3-5; Published 2022-3-14
Abstract

Background: Previous microarray analysis on peripheral blood leukocytes from three patients with acute myocardial infarction (AMI) showed that elevated expression of membrane bound o-acyltransferase domain containing 7(MBOAT7) relative to control. To further verify these findings, we investigated more patients and explored the possible mechanisms in vitro.
Objective: To study alterations in MBOAT7 expression in leukocytes after AMI, and to explore the relationship between MBOAT7 and lipid metabolism pathways in hepatocytes in vitro.
Methods: Ninety patients with AMI and 90 controls were recruited from the Han population in Northeast China. RT-fluorescent PCR was used to measure MBOAT7 mRNA levels. MBOAT7 interference and overexpression vectors were constructed and transfected into L-02 hepatocytes and expression was examined by RT-qPCR and western blotting. The expression of SCAP, LDLR, HMGCR, ACAT1, ABCA1, SREBP1, ACC, FAS, SCD, and PPARγ in the lipid metabolism pathway were investigated by RT-qPCR. Triglyceride and cholesterol levels were measured by ELISA.
Results: It was found that MBOAT7 mRNA levels were elevated in the leukocytes of patients with AMI. Hepatocytes were successfully transfected, shown by attenuated MBOAT7 mRNA levels in the silenced group (0.41±0.04 vs 1.01±0.07 for control, P=0.0019 <0.01) and raised levels in the overexpressing cells (23.29±0.39 vs 1.00±0.06 for control, P <0.0001). These results were confirmed by western blotting. Expression of the lipid metabolism-related genes was altered in response to MBOAT7 expression. Triglyceride levels increased after MBOAT7 silencing (118.40 ± 2.26 vs 70.54 ± 0.25 for control, P<0.0001), as did those of cholesterol (628.30 ± 8.89 vs 544.70 ± 11.04, P = 0.0041) but were not altered on MBOAT7 overexpression.
Conclusion: MBOAT7 did not affect the metabolism of triglycerides in hepatocytes through fatty acid synthesis and decomposition pathways. The MBOAT7 level in the peripheral blood can be used as a marker for acute myocardial infarction but cannot be used as a single therapeutic target to regulate lipid metabolism.
Keywords: Myocardial Infarction, MBOAT7, Marker, Lipid Metabolism
Introduction
According to WHO statistics, cardiovascular disease accounted for 17.9 million deaths in 2016, approximately 32% of all deaths. In 2015 alone, more than 15.9 million people worldwide suffered acute myocardial infarction (AMI) [1]. There are many risk factors for AMI, including age, smoking, hypertension, diabetes mellitus, dyslipidemia, and inflammation. Genetic susceptibility also plays a major role. Studying the expression of specific genes in patients with AMI can identify high-risk groups, improve the risk warning of the disease, and provide new diagnostic and treatment plans.
MBOAT7 encodes a membrane-associated lysophosphatidylinositol acyltransferase, that is specific for arachidonic-CoA as an acyl donor [2-4]. The protein reacylates phospholipids in the Land Cycle phospholipid remodeling pathway [2-4]. Related metabolic pathways include those related to metabolism and glycerophospholipid biosynthesis. GWAS studies have linked variants of patatin-like phospholipase domain-containing protein 3 (PNPLA3), transmembrane 6 superfamily 2 (TM6SF2), and MBOAT7 with all histological stages of Non-alcoholic fatty liver disease (NAFLD) [5, 6]. The rs738409 G-allele in PNPLA3 and the rs58542926 T-allele in TM6SF2, however, offered protection against coronary artery disease. The MBOAT7 rs641738 (T) allele can reduce MBOAT7 expression in the liver, increasing both susceptibility to and the severity of NAFLD [5, 7-10]. Damage caused by NAFLD not only affects the liver and related systems but may also lead to increased risk of type 2 diabetes and cardiovascular and chronic kidney disease [11]. Indeed, cardiovascular disease has been found to be the principal cause of death in NAFLD patients, followed by liver-related diseases [12-14]. We hypothesized that MBOAT7 may be a key link between NAFLD and coronary heart disease, and investigated both changes in MBOAT7 expression in peripheral blood leukocytes after AMI and the possible molecular mechanisms in hepatocytes.
Methods
Admission and exclusion criteria
Ninety inpatients with a clear diagnosis of AMI were enrolled at the Department of Cardiology, China-Japan Union Hospital of Jilin University from January 2016 to April 2016. All patients were from the Han population in northern China. The diagnostic criteria were based on the globally accepted definition of AMI announced in 2012 [15], meeting the criterion of confirmation by coronary angiography of at least 70% stenosis in the main coronary arteries (left main, descending artery, circumflex, and right coronary arteries) and at least one of their branches. The control group consisted of 90 patients with non-coronary atherosclerotic heart disease where the stenosis in the main coronary arteries and branches was less than 50%. All patients were tested for fasting blood glucose and lipids in the morning after admission. Each patient signed an informed consent form, and the study was approved by the Ethics Committee of China-Japan Union Hospital. The basic clinical information of the patients is shown in Table 2.
Sample collection and processing
Four milliliters of fasting venous blood were drawn from study participants two days after admission, added to an EDTA anticoagulation tube, and stored at 4 °C. Follow-up experiments were performed within two hours of sample collection. A total RNA extraction kit (RNAsimple Total RNA Kit, Tiangen Biochemical Technology Co., Ltd., Beijing) was used to extract RNA from the leukocytes, according to the instructions, and the quality and concentrations of the RNA were determined using 1.5% agarose electrophoresis and spectrophotometry (Nanodrop 2000), respectively. cDNA was synthesized from 1 µg of RNA using the Revertra Ace qPCR RT kit (TOYOBO, Shanghai), and stored at -20 °C for the next step of RT fluorescence quantification PCR.
qPCR detection of gene expression level
cDNA samples were diluted 10 times and amplified using the SYBR fluorescence quantitative kit (SYBR Premix Ex Taq TM, TaKaRa, Dalian). The 20 µl reaction system included 10 µl SYBR Premix Ex Taq TM, 0.5 µl primers (upstream and downstream, 10 µmol/L), 8 µl nuclease-free double-distilled water, and 1 µl cDNA template. An Mx3005P real-time fluorescent quantitative PCR system (StrataGene) was used for amplification. The reaction conditions were 95 °C for 10 minutes, 95 °C for 15 seconds, 60 °C for 20 seconds, 72 °C for 20 seconds, 95 °C for 1 minute, 55 °C for 30 seconds, and 95 °C for 30 seconds, for 40 cycles. GAPDH was used as the internal reference, and three replicates of each sample were used. The cycle threshold (Ct) obtained for each sample was expressed as relative expression 2-ΔCT (ΔCT=target gene CT-internal reference gene CT). The relative expression of the AMI group versus the control group was statistically analyzed by the 2-ΔΔCt method.
Overexpression and interference vector construction
The overexpression vector, PgCMV/EGFP/Neo-MBOAT7, was designed according to the human MBOAT7 gene sequence published on the NCBI website, and the negative control was the PgCMV/EGFP/Neo empty vector. The interference vector was pGPU6/GFP/Neo-MBOAT7, and the negative control was pGPU6/GFP /Neo-shNC. All the vectors were synthesized by the Shanghai Gima Biological Company.
Cell culture and transfection
Human hepatocytes (L-02, Shanghai Zhongqiao Xinzhou Biotechnology Co.) were cultured in a constant temperature 5% CO2 incubator at 37 °C. The medium was RPMI 1640 with 10% fetal bovine serum and 100 U/ml penicillin/streptomycin. When the cells had reached 70%-80% confluence, they were subcultured by trypsinization into 6-well plates (2×10⁵/ml). The cells were cultured for 24 hours and when 70% confluent, were transfected. Four 1.5-ml sterile centrifuge tubes, filled with 150 μl serum- and antibiotic-free medium were prepared, and 3 μg pBI-CMV3-MBOAT7 overexpression vector, pBI-CMV3 empty vector, 3 µg pGPU6/GFP/Neo-MBOAT7 interference vector, or pGPU6/ For GFP/Neo-shNC negative control vector were added to the tubes. After mixing the plasmid and the medium thoroughly, 7.5 μl of the transfection reagent (FuGENE®HD LLC, USA) was added to each tube. The mixture was stirred with a pipette tip and allowed to stand for 15 minutes. Antibiotic-free medium was added to the tissue culture plate and the cell-plasmid mixture was added to the plate evenly in a clockwise direction, with gentle shaking to ensure even distribution. The plates were incubated for 24 hours, and the cells and the GFP distribution were observed under a fluorescence microscope (Thermo Fisher, Waltham, MA, USA).
Detection of MBOAT7 expression at the mRNA and protein levels
RNA and cDNA were obtained from cells 24 hours after transfection, as described above. The cDNA was used as a template for fluorescent quantitative PCR. The 20 µl reaction system contained 10 µl SYBR® PremixEx taqTM, 0.4 μl primer, 1 μl cDNA, and 8.2 μl water. The amplification conditions were 95 °C for 10 minutes; 95 °C for 10 seconds, 60 °C for 30 seconds, 72 °C for 15 seconds and 35 cycles, and 55 °C for 15 seconds. Fluorescent qPCR amplification of MBOAT7 and GAPDH (internal reference) was performed using different template cDNAs, with three replicates per sample to ensure accuracy.
The total protein was extracted from the cells 48 hours after transfection using RIPA lysis buffer (Beyotime Biotechnology, China), and the protein concentration was measured by the BCA Protein Assay kit (Beyotime Biotechnology). The protein concentrations of different samples were adjusted to ensure that the same amount of protein was loaded. After separation of the proteins on SDS-PAGE, the proteins were transferred to PVDF membranes and probed with the appropriate antibodies.
Investigation of lipid-associated gene expression
A total of 10 pairs of RT-qPCR primers for lipid metabolism-related genes were synthesized. The primer list is shown in Table 1. Using different cDNA templates and GAPDH as the internal reference, we investigated the levels of triglyceride-associated genes, including: sterol regulatory element binding protein (SREBP1), acetyl-coenzyme A carboxylase (ACC), fatty acid synthase (FAS), stearyl carboxylase A dehydrogenase (SCD1), and peroxisome proliferators-activated receptors γ (PPARγ), as well as the expression of cholesterol metabolism-related genes, including: SREBP Cleavage-Activating Protein (SCAP). Low density lipoprotein receptor (LDLR), 3-hydrox-3-methylglutaryl-CoA reductase (HMGCR), acetyl-CoA acetyltransferase 1 (ACAT1), and ATP binding cassette subfamily A member 1 (ABCA1). The thermal cycling conditions were the same as before. There were also three replicates for each sample to ensure the accuracy of the test.
Primer list
| Gene Symbol | Species | Sequence (5' -> 3') |
|---|---|---|
| MBOAT7 | Human | TCCGCAACATCGACTGCTAC |
| CGCAGGACATAGGAACGGG | ||
| SREBP1[36] | Human | CGGAACCATCTTGGCAACAGT |
| CGCTTCTCAATGGCGTTGT | ||
| SCD[36] | Human | TTCCTACCTGCAAGTTCTACACC |
| CCGAGCTTTGTAAGAGCGGT | ||
| ACC[36] | Human | ATGTCTGGCTTGCACCTAGTA |
| CCCCAAAGCGAGTAACAAATTCT | ||
| PPARγ[36] | Human | ACCAAAGTGCAATCAAAGTGGA |
| ATGAGGGAGTTGGAAGGCTCT | ||
| FAS[36] | Human | AAGGACCTGTCTAGGTTTGATGC |
| TGGCTTCATAGGTGACTTCCA | ||
| HMGCR[37] | Human | TACCATGTCAGGGGTACGTC |
| CAAGCCTAGAGACATAATCATC | ||
| LDLR[37] | Human | CAATGTCTCACCAAGCTCTG |
| TCTGTCTCGAGGGGTAGCTG | ||
| ACAT1[38] | Human | AACACCCATTGGATCTTTTTTAGG |
| TGCAATGGAACCAAGCTTAGTG | ||
| ABCA1[39] | Human | GGGGTGGTGTTCTTCCTCATTAC |
| CCGCCTCACATCTTCATCTTC | ||
| SCAP | Human | CCGCCTCACATCTTCATCTTC |
| GGGGCGAGTAATCCTTCACA | ||
| GAPDH | Human | ACATCATCCCTGCCTCTACTG ACCACCTGGTGCTCAGTGTA |
Measurement of triglyceride and cholesterol
The triglyceride and cholesterol concentrations in hepatocytes were measured 48 hours after transfection using the cell triglyceride and cholesterol assay kit (Applygen Technologies, Beijing, China), according to instructions.
Firstly, after removal of spent medium, the cells were washed three times with PBS and 300 μl of lysate (the amount of lysate added depending on the cell density) were added and allowed to stand for 10 minutes. The cells were collected, mixed, centrifuged, and the supernatant was used for protein quantification. The supernatant was warmed to 70 °C, centrifuged at 2000 rpm for 5 minutes, and the retaining the supernatant. Fifty microliters of the supernatant were added each well of an ELISA plate, using a blank control group and three replicates of each sample. After addition of 150 μl of working solution and allowing to react for 10 minutes at 37 °C, the absorbances at 550 nm were measured using a microplate reader (Infinite 200 PRO multi-function microplate reader, Tecan, Switzerland), and the triglyceride and cholesterol concentrations were calculated using the standard curve and expressed in terms of the protein concentrations.
Statistical analysis
SPSS software (IBM Corp., Armonk, NY, USA), version 22.0 was used to analyze the data and GraphPad Prism version 7.0 was used for the figures. Normally distributed data were represented by means ± standard deviation (SD). Independent-samples t-tests were used to compare differences between groups. P-values below 0.05 was considered statistically significant.
Results
The two patient groups did not differ significantly in terms of age, sex, BMI, diabetes, hypertension, smoking, drinking, and comorbidities (Table 2).
Baseline characteristics of control and AMI groups
| Control group | AMI group | P | |
|---|---|---|---|
| N | 90 | 90 | |
| Age (years) | 57.44±1.28 | 65.79±1.57 | <0.0001 |
| Gender (male/female) | 54/36 | 63/27 | 0.160 |
| BMI | 24.57±0.41 | 27.08 ± 2.346 | 0.29 |
| Systolic blood pressure | 136.79±21.64 | 131.31±25.48 | 0.123 |
| Diastolic blood pressure | 82 (75.5,90) | 80 (70.5,90) | 0.186 |
| Glucose fasting | 5.857±0.1864 | 7.272±0.3457 | 0.0003 |
| Total Cholesterol | 4.464±0.1169 | 4.572±0.1409 | 0.5540 |
| Triglycerides | 1.675±0.1319 | 1.799±0.1249 | 0.4997 |
| LDL-C | 2.897±0.08641 | 3.11±0.1124 | 0.1337 |
| HDL-C | 1.07±0.02978 | 0.9736±0.02485 | 0.0143 |
| WBC (×109) | 6.367±0.2248 | 8.278±0.333 | <0.0001 |
| History of diabetes mellitus | 12/78 | 19/71 | 0.893 |
| History of hypertension | 37/53 | 37/53 | 1 |
| History of smoking | 39/51 | 44/46 | 0.455 |
| History of drinking | 11/79 | 7/83 | 0.32 |
There were differences in fasting blood glucose and high-density lipoprotein (HDL) cholesterol values between the two groups. Specifically, glucose levels were higher in the AMI patients, while the HDL cholesterol levels were lower than controls. Total cholesterol, plasma triglyceride, and LDL cholesterol values did not differ significantly.
MBOAT7 expression
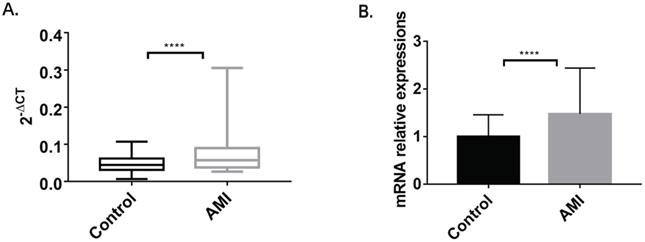
The RT fluorescence qPCR results showed a single melting peak for MBOAT7, together with high specificity and an amplification curve of a significant “S” type. The PCR products were visible as a single bright band, at about 93 bp, in agarose gel electrophoresis, which was consistent with the expected fragment size. The ΔCT values of the samples were the means of three replicates, and the standard deviation was within the required range. The 2-ΔCT of the case group was higher (0.07096±0.004887) than that of the control group (0.04816±0.00231) (P<0.0001). Relative expression of MBOAT7 between the groups was determined by 2-ΔΔCt. This indicated that MBOAT7 levels in leukocytes from AMI patients were higher, with a relative expression of 1.473 ± 0.1015 vs 0.9999 ± 0.04796 for the control (P<0.0001), as shown in Figure 1.
The comparison of MBOAT7 expression between AMI and control group. (A) MBOAT7 mRNA expression Control vs AMI. (B) MBOAT7 mRNA relative expression Control vs AMI. AMI=acute myocardial infarction. ****P<0.0001.
MBOAT7 mRNA and protein after transfection
Significantly reduced levels of MBOAT7 mRNA were observed in cells transfected with the interference plasmid (0.41±0.04 vs 1.01±0.07 for control, P=0.0019 <0.01), while the mRNA level in the overexpressing cells was raised (23.29±0.39 vs 1.00±0.06 for control, P<0.01), as shown in Figure 2.
Alterations of MBOAT7 mRNA and protein levels and effects on triglyceride and cholesterol after MBOAT7 knockdown and overexpression in L-02 cells. (A). MBOAT7 mRNA relative expression after MBOAT7 knockdown Control vs Silencing. (B) Western Blot for MBOAT7 after MBOAT7 knockdown Control vs Silencing. (C) MBOAT7 mRNA relative expression after MBOAT7 overexpression Control vs Overexpression. (D) Western Blot for MBOAT7 after MBOAT7 overexpression Control vs Overexpression. (E). Changes in triglyceride content after MBOAT7 knockdown and overexpression (umol/g). (F) Changes in cholesterol content after MBOAT7 knockdown and overexpression (umol/g). **P<0.01, ****P<0.0001.
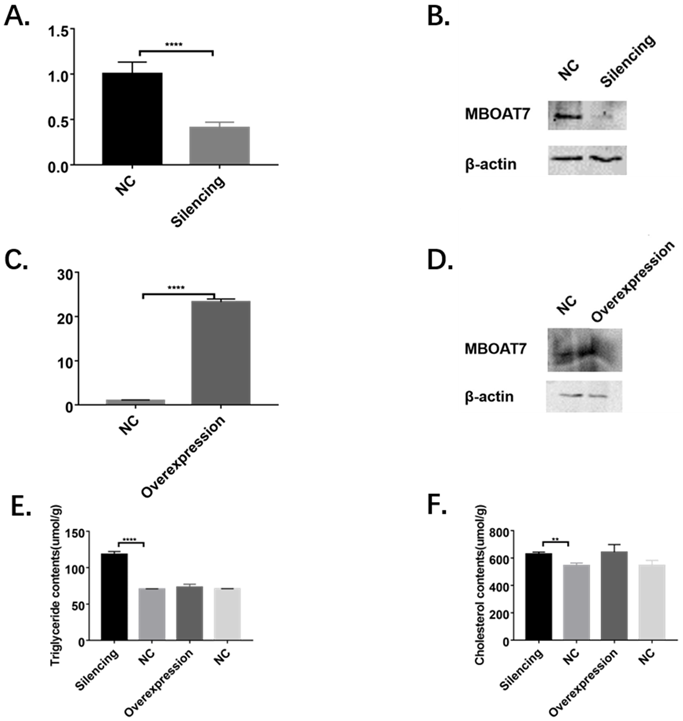
The MBOAT7 protein levels were determined 48 hours after transfection, using β-actin as reference. Western blots showed significantly reduced MBOAT7 levels in the interference group and a corresponding elevation in the overexpressing cells (Figure 2).
Changes in cholesterol and triglyceride metabolism-related gene levels
In the MBOAT7-knockdown cells, the relative expression of the cholesterol-related gene SCAP was 0.55±0.03 vs 1.01±0.09 for the control (P=0.0101), while that of LDLR was 0.71±0.03 vs. 1.00±0.03 for the control (P=0.0022), and ABCA1 was 0.71±0.04 vs 1.01±0.08 for the control (P=0.0331). Expression of HMGCR and ACAT1 were essentially the same between the two groups. For genes related to triglyceride metabolism, it was found that the relative expression of SREBP1 was 0.42±0.02 vs 1.00±0.04 for the control (P= 0.0002), while that of ACC was 0.66±0.02 vs 1.00±0.06 (P= 0.0047), that of FAS was 0.72 ± 0.03 vs 1.00 ± 0.03 (P = 0.0025), and that of SCD was 0.78 ± 0.03 vs 1.00 ± 0.02 (P = 0.0055). The levels of PPARγ showed no change (Figure 3).
Changes in cholesterol and triglyceride metabolism-related gene levels after MBOAT7 knockout and overexpression. (A) Changes in cholesterol metabolism-related gene levels after MBOAT7 Silencing. (B) Changes in triglyceride metabolism-related gene levels after MBOAT7 Silencing. (C) Changes in cholesterol metabolism-related gene levels after MBOAT7 Overexpression. (D) Changes in triglyceride metabolism-related gene levels after MBOAT7 Overexpression. *P<0.05, **P<0.01, ***P<0.001, ****P<0.0001.
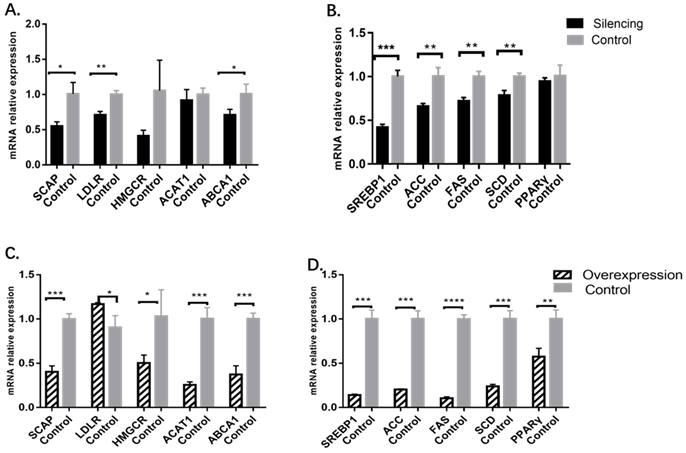
In MBOAT7-overexpressing cells, the relative expression of SCAP was 0.40 ± 0.04 vs 1.00 ± 0.03 (P=0.0003), and that of LDLR was 1.17 ± 0.01 vs 0.91±0.08 (P=0.0264). HMGCR expression was also raised 0.51±0.05 vs 1.03±0.17 (P=0.0427), as were the expression of ACAT1 (0.26 ± 0.02vs1.01±0.07; P= 0.0005), ABCA1 (0.37 ± 0.06 vs 1.00 ± 0.04; P = 0.0008), SREBP1 (0.14 ± 0.01 vs 1.00 ± 0.06; P = 0.0001), ACC (0.20 ± 0.01 vs 1.00 ± 0.05; P = 0.0001), FAS (0.11 ± 0.01 vs 1.00 ± 0.03; P<0.0001), SCD (0.24 ± 0.01 vs 1.00 ± 0.05; P= 0.0001), and PPARγ (0.58 ± 0.05 vs 1.00 ± 0.06; P=0.0055) (Figure 3).
Changes in intracellular triglyceride and cholesterol content
In the knockdown cells, the triglyceride content was found to be significantly increased (118.40 ± 2.26 vs 70.54 ± 0.25, P <0.0001), as was the cholesterol content (628.30 ± 8.89 vs 544.70 ± 11.04, P = 0.0041), as shown in Figure 2.
In the MBOAT7-overexpressing cells, no differences in either triglyceride (73.02 ± 2.46 vs 70.76 ± 0.19 for the control, P=0.41) or cholesterol concentrations (642.10 ± 32.41 vs 545.80 ± 21.22 for the control, P=0.068) were observed (Figure 2).
Discussion
In a previous study by our research team, microarray analysis of mRNAs in the peripheral blood leukocytes of three AMI patients identified 559 differentially expressed genes. Of these, 288 were upregulated and 271 were downregulated [16]. These genes were associated with 128 cellular components and were involved in 521 biological processes and 151 molecular functions. KEGG pathway analysis indicated that the differentially expressed genes were involved in 107 pathways, including “systemic lupus erythematosus”, “lipid metabolism”, “Alzheimer's disease”, “receptor interaction”, “apoptosis”, “MAPK signaling pathway”, and “insulin signaling pathway”. Yang et al. [17-20] analyzed ACSL1, PRMT5, PIK3C2A, and CPNE3 levels in additional patients, finding that the results agreed with the findings of the microarray, confirming the reliability of the microarray results and the feasibility of single-gene diagnosis of diseases. The microarray results showed elevated MBOAT7 expression after AMI [16]. Here, we evaluated the expression of MBOAT7 in more patients and found that it was markedly higher in AMI patients, consistent with the microarray observations.
The MBOAT7 rs641738 (T) gene polymorphism can lead to reduced MBOAT7 transcription in hepatocytes, increasing both the susceptibility to and severity of NAFLD [5, 7-10]. Another study confirmed the MBOAT7 hepatocyte expression findings while showing raised MBOAT7 mRNA levels in peripheral blood leukocytes where it appears to have an anti-inflammatory effect [21]. In this study, the white blood cells in the acute myocardial infarction group were significantly increased, which is consistent with the previous research conclusions, suggesting that the body is in an obvious inflammatory process after acute myocardial infarction. After the release of inflammatory factors into the blood, the body responds by starting an anti-inflammatory process, including increasing the expression of MBOAT7 gene, thereby reducing the damage caused by inflammation to the body. Further investigation into the functions of MBOAT7 and its possible role in inflammation is needed.
Here, the comparison between the AMI and control groups showed alterations in the fasting blood glucose and HDL lipoprotein levels. Glucose levels in the AMI groups were higher, while HDL levels were lower than in controls. The total cholesterol, triglyceride, and LDL levels remained unchanged. The findings of increased blood sugar and decreased HDL levels are consistent with the documented characteristics of the AMI population. However, we did not see differences in the cholesterol and triglyceride levels between the two groups, which is contrary to current research findings, especially the LDL cholesterol which is the main indicator of current lipid-lowering therapy and is a well-documented risk factor for cardiovascular disease. However, it is possible that this result may not necessarily reflect the overall situation due to the limited number of patients investigated. In addition, many patients in the AMI group had received statin treatment before admission, so the current results reflect the serum cholesterol level after lipid-lowering therapy, and may not truly reflect the relationship between cholesterol levels and the risk of AMI.
The in vitro experiments showed that, after knockdown of MBOAT7 expression, the concentrations of cholesterol and triglycerides in the hepatocytes were significantly elevated in comparison with the controls, while not altering significantly on MBOAT7 overexpression. It has previously been reported that the MBOAT7 rs641738 (T) allele attenuates MBOAT7 expression in hepatocytes together with increased lipid levels in the cells [9, 22]. This is consistent with our in vitro results.
SREBP consists of three isoforms, of which SREBP-1c has been reported to be involved in fatty acid and insulin-related glucose metabolism [23]. Raised SREPB-1c levels in the livers of dairy cows have been linked to lipid accumulation in the organ, and SREBP-1c levels correspond to triglyceride accumulation in the liver [24, 25]. ACC1, FAS, and SCD1 are lipid synthesis-associated enzymes and are targeted by SREBP-1c [26]. ACC1 catalyzes the acetyl-CoA/malonyl-CoA conversion during fatty acid synthesis [27]. FAS is a regulator of fatty acid synthesis, and SCD1 is responsible for the desaturation and extension of fatty acids [28, 29]. Thus, these genes are linked to fatty acid synthetic and metabolic processes. Our study found that after interfering with MBOAT7 expression, the triglyceride content of hepatocytes increased markedly. qPCR analysis demonstrated significant attenuation of SREBP1, ACC, FAS, and SCD expression, while that of PPARγ, responsible for the oxidative decomposition of fatty acids, remained unchanged. This suggests that MBOAT7 does not cause the increase in triglycerides through fatty acid synthesis and decomposition. A recent report confirmed that MBOAT7 can promote triglyceride synthesis in hepatocytes by increasing the conversion of phosphatidylinositol [30]. This may be the principal mechanism behind the action of the MBOAT7 rs641738 (T) allele causing and aggravating NAFLD. After MBOAT7 overexpression, there was no significant change in the triglyceride content of hepatocytes. qPCR analysis indicated downregulation of several fatty acid synthesis-associated genes together with that of PPARγ. Downregulation of PPARγ can lead to a decrease in the oxidation and decomposition of triglycerides. However, there were also lowered levels of genes related to synthesis and decomposition, with the final result that there was no significant change in the triglyceride content of the cell. This also showed that simply increasing the expression of MBOAT7 cannot reduce the triglyceride content.
MBOAT7 knockdown resulted in increased cholesterol levels in hepatocytes. Previous investigations have mostly emphasized the influence of MBOAT7 on triglyceride metabolism, and there are few studies on cholesterol. Thangapandi VR et al constructed Mboat7 knockout mice and found that the mice developed spontaneous steatosis, the main feature of which was a raised cholesterol ester level in the liver after 10 weeks [31]. Marcin Krawczyk et al. analyzed 84 obese patients who had undergone bariatric surgery, observing that not only was the MBOAT7 rs641738 (T) allele associated with elevated triglyceride levels, but was also linked to raised levels of total cholesterol, LDL, and serum glucose [32]. The changes in cholesterol observed in these studies are consistent with our findings. In our study, the cholesterol metabolism pathway analysis found that the expression of LDLR decreased after MBOAT7 knockdown and increased after MBOAT7 overexpression, while the expression of ACAT1 did not change significantly after MBOAT7 knockdown but was significantly reduced on overexpression. The expression of other genes in the pathway such as SCAP, HMGCR, and ABCA1 were all downregulated after MBOAT7 knockdown or overexpression. LDLR is the main receptor on peripheral cells for cholesterol uptake from the circulation, which is efficiently removed by LDLR endocytosis [33]. ACAT1 regulates cholesterol esterification which can prevent the accumulation of free cholesterol within cells, regulate the storage or secretion of cholesterol, and maintain the balance between free cholesterol and cholesterol esters [34, 35]. Since the cholesterol concentrations we detected include the sum of free cholesterol and cholesterol ester content, the change in ACAT1 will theoretically not affect the measured cholesterol content. In this study, after the expression of MBOAT7 gene was changed, the content of total cholesterol changed. So, the changes in ACAT1 were the result, not the cause. After MBOAT7 gene knockout, the expression of LDLR was decreased, and the content of cholesterol was increased too. After MBOAT7 overexpression, the expression of LDLR was increased, but there was no significant change in cholesterol. LDLR showed opposite changes, but the total cholesterol content did not have the opposite trend. In addition, the decreased expression of LDLR in hepatocytes would lead to a decrease in cholesterol uptake by endocytosis, which is inconsistent with the result of the decreased LDLR expression and increased cholesterol content in this study. This indicated that the knockout and overexpression of MBOAT7 resulted in different trends in LDLR, but not the reason for the change in cholesterol content. The possible reason is that the MBOAT7 gene causes changes in cholesterol content through other mechanisms, and negative feedback acts on LDLR, resulting in changes in the expression of LDLR.
Conclusion
This study found that MBOAT7 was highly expressed in the peripheral blood leukocytes of AMI patients. Knockdown of MBOAT7 resulted in raised levels of intracellular triglycerides and cholesterol. These changes do not appear to involve fatty acid synthesis and catabolism pathways. Overexpression of MBOAT7 did not affect the triglyceride and cholesterol levels in the cells. This study suggests that MBOAT7 can be used as a peripheral blood marker after AMI but cannot be used as a single therapeutic target to regulate lipid metabolism.
Abbreviations
MBOAT7: membrane bound O-acyltransferase domain containing 7; AMI: acute myocardial infarction; PNPLA3: patatin-like phospholipase domain-containing protein 3; TM6SF2: transmembrane 6 superfamily 2; HDL: high-density lipoprotein; ACSL1: long-chain acyl-coenzyme A synthetases 1; ACC: acetyl-coenzyme A carboxylase; FAS: fatty acid synthase; PPARγ: peroxisome proliferators-activated receptors γ; SREBP1: sterol regulatory element binding protein; SCD1: stearyl carboxylase A dehydrogenase; SCAP: SREBP Cleavage-Activating Protein; LDLR: Low density lipoprotein receptor; HMGCR: 3-hydrox-3-methylglutaryl-CoA reductase; ACAT1: acetyl-CoA acetyltransferase 1; ABCA1: ATP binding cassette subfamily A member 1.
Competing Interests
The authors have declared that no competing interest exists.
References
1. Disease GBD, Injury I, Prevalence C. Global, regional, and national incidence, prevalence, and years lived with disability for 310 diseases and injuries, 1990-2015: a systematic analysis for the Global Burden of Disease Study 2015. Lancet. 2016;388:1545-602
2. Lee HC, Inoue T, Imae R, Kono N, Shirae S, Matsuda S. et al. Caenorhabditis elegans mboa-7, a member of the MBOAT family, is required for selective incorporation of polyunsaturated fatty acids into phosphatidylinositol. Mol Biol Cell. 2008;19:1174-84
3. Wende H, Volz A, Ziegler A. Extensive gene duplications and a large inversion characterize the human leukocyte receptor cluster. Immunogenetics. 2000;51:703-13
4. Fukunaga-Johnson N, Lee SW, Liebert M, Grossman HB. Molecular analysis of a gene, BB1, overexpressed in bladder and breast carcinoma. Anticancer Res. 1996;16:1085-90
5. Mancina RM, Dongiovanni P, Petta S, Pingitore P, Meroni M, Rametta R. et al. The MBOAT7-TMC4 Variant rs641738 Increases Risk of Nonalcoholic Fatty Liver Disease in Individuals of European Descent. Gastroenterology. 2016;150:1219-30 e6
6. Anstee QM, Day CP. The Genetics of Nonalcoholic Fatty Liver Disease: Spotlight on PNPLA3 and TM6SF2. Seminars in liver disease. 2015;35:270-90
7. Eslam M, Valenti L, Romeo S. Genetics and epigenetics of NAFLD and NASH: Clinical impact. J Hepatol. 2018;68:268-79
8. Buch S, Stickel F, Trepo E, Way M, Herrmann A, Nischalke HD. et al. A genome-wide association study confirms PNPLA3 and identifies TM6SF2 and MBOAT7 as risk loci for alcohol-related cirrhosis. Nat Genet. 2015;47:1443-8
9. Teo K, Abeysekera KWM, Adams L, Aigner E, Anstee QM, Banales JM. et al. rs641738C>T near MBOAT7 is associated with liver fat, ALT and fibrosis in NAFLD: A meta-analysis. J Hepatol. 2021;74:20-30
10. Meroni M, Longo M, Fracanzani AL, Dongiovanni P. MBOAT7 down-regulation by genetic and environmental factors predisposes to MAFLD. EBioMedicine. 2020;57:102866
11. Byrne CD, Targher G. NAFLD: a multisystem disease. J Hepatol. 2015;62:S47-64
12. Ong JP, Pitts A, Younossi ZM. Increased overall mortality and liver-related mortality in non-alcoholic fatty liver disease. Journal of Hepatology. 2008;49:608-12
13. Prasad M, Gupta S, Sarin SK. Non-Alcoholic Fatty Liver Disease and the Risk of Incident Cardiovascular Disease: A Grade Evaluation of the Evidence through a Systematic Review and Meta-Analysis. Hepatology. 2021;74:1027a-8a
14. Targher G, Byrne CD, Lonardo A, Zoppini G, Barbui C. Non-alcoholic fatty liver disease and risk of incident cardiovascular disease: A meta-analysis. Journal of Hepatology. 2016;65:589-600
15. Thygesen K, Alpert JS, Jaffe AS, Simoons ML, Chaitman BR, White HD. et al. Third universal definition of myocardial infarction. Journal of the American College of Cardiology. 2012;60:1581-98
16. Fan L, Meng H, Guo X, Li X, Meng F. Differential gene expression profiles in peripheral blood in Northeast Chinese Han people with acute myocardial infarction. Genetics and molecular biology. 2018;41:59-66
17. Tan B, Liu M, Yang Y, Liu L, Meng F. Low expression of PIK3C2A gene: A potential biomarker to predict the risk of acute myocardial infarction. Medicine. 2019;98:e15061
18. Tan B, Liu Q, Yang L, Yang Y, Liu D, Liu L. et al. Low expression of PRMT5 in peripheral blood may serve as a potential independent risk factor in assessments of the risk of stable CAD and AMI. BMC cardiovascular disorders. 2019;19:31
19. Tan B, Liu L, Yang Y, Liu Q, Yang L, Meng F. Low CPNE3 expression is associated with risk of acute myocardial infarction: A feasible genetic marker of acute myocardial infarction in patients with stable coronary artery disease. Cardiology journal. 2019;26:186-93
20. Yang L, Yang Y, Si D, Shi K, Liu D, Meng H. et al. High expression of long chain acyl-coenzyme A synthetase 1 in peripheral blood may be a molecular marker for assessing the risk of acute myocardial infarction. Experimental and therapeutic medicine. 2017;14:4065-72
21. MBOAT7 rs641738 increases risk of liver inflammation, transition to fibrosis in chronic hepatitis C. Nature Communications. 2016; 7: 12757.
22. Mma B, Pd A, Mla C, Fc D, Gb B, Rr A. et al. Mboat7 down-regulation by hyper-insulinemia induces fat accumulation in hepatocytes. EBioMedicine.
23. Eberle D, Hegarty B, Bossard P, Ferre P, Foufelle F. SREBP transcription factors: master regulators of lipid homeostasis. Biochimie. 2004;86:839-48
24. Prodanovic R, Koricanac G, Vujanac I, Djordjevic A, Pantelic M, Romic S. et al. Obesity-driven prepartal hepatic lipid accumulation in dairy cows is associated with increased CD36 and SREBP-1 expression. Research in veterinary science. 2016;107:16-9
25. Li X, Huang W, Gu J, Du X, Lei L, Yuan X. et al. SREBP-1c overactivates ROS-mediated hepatic NF-kappaB inflammatory pathway in dairy cows with fatty liver. Cellular signalling. 2015;27:2099-109
26. Porstmann T, Griffiths B, Chung YL, Delpuech O, Griffiths JR, Downward J. et al. PKB/Akt induces transcription of enzymes involved in cholesterol and fatty acid biosynthesis via activation of SREBP. Oncogene. 2005;24:6465-81
27. Wakil SJ, Stoops JK, Joshi VC. Fatty acid synthesis and its regulation. Annual review of biochemistry. 1983;52:537-79
28. Postic C, Girard J. Contribution of de novo fatty acid synthesis to hepatic steatosis and insulin resistance: lessons from genetically engineered mice. The Journal of clinical investigation. 2008;118:829-38
29. Man WC, Miyazaki M, Chu K, Ntambi J. Colocalization of SCD1 and DGAT2: implying preference for endogenous monounsaturated fatty acids in triglyceride synthesis. J Lipid Res. 2006;47:1928-39
30. Tanaka Y, Shimanaka Y, Caddeo A, Kubo T, Mao Y, Kubota T. et al. LPIAT1/MBOAT7 depletion increases triglyceride synthesis fueled by high phosphatidylinositol turnover. Gut. 2021;70:180-93
31. Thangapandi VR, Knittelfelder O, Brosch M, Patsenker E, Vvedenskaya O, Buch S. et al. Loss of hepatic Mboat7 leads to liver fibrosis. Gut. 2021;70:940-50
32. Krawczyk M, Jimenez-Aguero R, Alustiza JM, Emparanza JI, Perugorria MJ, Bujanda L. et al. PNPLA3 p.I148M variant is associated with greater reduction of liver fat content after bariatric surgery. Surg Obes Relat Dis. 2016;12:1838-46
33. Yang HX, Zhang M, Long SY, Tuo QH, Tian Y, Chen JX. et al. Cholesterol in LDL receptor recycling and degradation. Clinica chimica acta; international journal of clinical chemistry. 2020;500:81-6
34. Brown MS, Goldstein JL. A receptor-mediated pathway for cholesterol homeostasis. Science. 1986;232:34-47
35. Brown MS, Goldstein JL. The SREBP pathway: regulation of cholesterol metabolism by proteolysis of a membrane-bound transcription factor. Cell. 1997;89:331-40
36. Zhao F, Xie P, Jiang J, Zhang L, An W, Zhan Y. The effect and mechanism of tamoxifen-induced hepatocyte steatosis in vitro. Int J Mol Sci. 2014;15:4019-30
37. Notarnicola M, Messa C, Refolo MG, Tutino V, Miccolis A, Caruso MG. Synergic effect of eicosapentaenoic acid and lovastatin on gene expression of HMGCoA reductase and LDL receptor in cultured HepG2 cells. Lipids in health and disease. 2010;9:135
38. Ruan XZ, Moorhead JF, Tao JL, Ma KL, Wheeler DC, Powis SH. et al. Mechanisms of dysregulation of low-density lipoprotein receptor expression in vascular smooth muscle cells by inflammatory cytokines. Arteriosclerosis, thrombosis, and vascular biology. 2006;26:1150-5
39. Wang JM, Zhou JJ, Zheng Q, Gan H, Wang H. Dialysis method alters the expression of microRNA-33a and its target genes ABCA1, ABCG1 in THP-1 macrophages. Therapeutic apheresis and dialysis: official peer-reviewed journal of the International Society for Apheresis, the Japanese Society for Apheresis, the Japanese Society for Dialysis Therapy. 2014;18:44-50
Author contact
![]() Corresponding authors: Ping Yang, Phone: +8613944111519; E-mail: pyangedu.cn; Fanbo Meng, Phone: +8615948346855; E-mail: mengfbedu.cn.
Corresponding authors: Ping Yang, Phone: +8613944111519; E-mail: pyangedu.cn; Fanbo Meng, Phone: +8615948346855; E-mail: mengfbedu.cn.