Impact Factor ISSN: 1449-1907
- Issue 9; 2026
- Issue 8; 2026
- Issue 7; 2026
- Issue 6; 2026
- Issue 5; 2026
- Volume 23; 2026
- Past Issues
- Editorial Board
- Cover Images
- Index & Coverage
- Cover Suggestion
- Special Issues
Introduction
Materials and Methods
Results
Discussion
Conclusions
Abbreviations
Acknowledgements
References

 Global reach, higher impact
Int J Med Sci 2022; 19(3):499-510. doi:10.7150/ijms.66996 This issue Cite
Research Paper
Ovariectomy Interferes with Proteomes of Brown Adipose Tissue in Rats
Tzu-Jung Chou1,2, Chia-Wen Lu1,2,3, Chen-Chung Liao4, Chien-Hsieh Chiang1,3,5, Chi-Chang Huang6 ![]() , Kuo-Chin Huang1,3,7
, Kuo-Chin Huang1,3,7 ![]()
1. Department of Family Medicine, National Taiwan University Hospital, Taipei, Taiwan.
2. Graduate Institute of Clinical Medicine, National Taiwan University College of Medicine, Taipei, Taiwan.
3. Department of Family Medicine, National Taiwan University College of Medicine, Taipei, Taiwan.
4. Metabolomics-Proteomics Research Center, National Yang Ming Chiao Tung University, Taipei, Taiwan.
5. Graduate Institute of Pharmacology, National Taiwan University College of Medicine, Taipei, Taiwan.
6. Graduate Institute of Sports Science, National Taiwan Sport University, Taoyuan, Taiwan.
7. Department of Family Medicine, National Taiwan University Hospital Hsin-Chu Branch, Hsinchu, Taiwan.
Received 2021-9-11; Accepted 2022-2-22; Published 2022-3-6
Abstract

Postmenopausal women exhibit a higher prevalence of obesity due to decreased energy expenditure and increased food intake compared to their premenopausal counterparts. Brown adipose tissue (BAT) plays a key role in energy homeostasis, thus providing us with appealing therapeutic targets in obesity. However, how BAT proteomes are altered in response to low levels of estrogen remains unclear. To better understand the underlying mechanisms between the postmenopausal state and BAT proteomic changes, our study aimed to investigate the effect of ovariectomy on the BAT proteome. In this study, eight-week-old female Sprague Dawley rats were randomly allocated into bilateral ovariectomy (Ovx) and sham operation (Sham) groups. Mass spectrometry was used for proteomics assay and Ingenuity Pathway Analysis was applied to examine the differentially regulated proteins. Of the 1,412 identified proteins, 18 proteins were significantly upregulated, whereas 36 proteins were significantly downregulated in the Ovx group as compared to the Sham group. Our findings demonstrate that the proteins involved in BAT morphology, the browning of white adipose tissue, and metabolic substrates for thermogenesis were regulated by ovariectomy. The dysregulation of proteins by ovariectomy might be related to the disruption of BAT function in the postmenopausal status. Understanding how BAT proteomes are altered in response to ovariectomy may illuminate novel therapeutic strategies for the management of postmenopausal weight gain in the future.
Keywords: brown adipose tissue, ingenuity pathways analysis, menopause, obesity, proteome
Introduction
Postmenopausal women tend to exhibit a higher prevalence of metabolic syndrome and obesity compared to their premenopausal counterparts [1-3]. Previous studies have shown that estrogen plays a crucial role in regulating energy balance, insulin signaling, and inflammation [4, 5]. Low levels of estrogen, occurring due to menopause, ovarian insufficiency, or ovariectomy (Ovx), are associated with decreased energy expenditure and increased food intake, likely leading to weight gain and obesity in the long term [6, 7]. However, long-term use of hormone replacement therapy may implicate risks of breast and endometrial cancer or cardiovascular diseases in a subset of postmenopausal women [8, 9]; thus, pursuing alternative solutions is needed for menopause-related obesity.
Brown adipose tissue (BAT) has become an appealing therapeutic target for obesity recently due to its distinct features of increased energy expenditure and dissipating nutrients as heat [10, 11]. The abundant expression of uncoupling protein 1 (UCP1) in BAT mitochondria can generate heat by uncoupling the proton motive force from adenosine triphosphate production [12]. The process is so-called non-shivering thermogenesis and can thereby increase energy expenditure [12, 13]. Besides BAT, beige adipocytes also possess thermogenic capacity and can be inducible from white adipocytes, known as “browning” [14]. Studies have shown that these thermogenic fat cells express estrogen receptors, supporting the notion that estrogen may play a key role in the metabolic activity of brown and beige adipocytes, and it increases UCP1 expression [15-17]. In rodents, females generally have higher BAT activity than males [18]. In humans, women exhibit a higher prevalence of BAT than men, but the sex difference declines with age, suggesting a possible role for the mid-life loss of estrogen in women [15]. The maintenance of active BAT after the menopause has the potential to reduce the development of adiposity. However, how BAT proteomes are altered in response to low levels of estrogen remains to be determined.
Proteomic analysis is a comprehensive protein study that provides information on changes in protein expression along with their interacting networks and identifies biomarkers related to pathogenic processes [19]. Proteomic techniques have demonstrated their usefulness in investigating the biological function of BAT [20, 21]. To our knowledge, no comparative study on the proteomic changes of BAT in ovariectomized rats has been conducted. This study aims to investigate the effect of ovariectomy as a postmenopausal status on proteomic changes of BAT. We aim to identify molecular changes that may provide a basis for future qualitative bioinformatics analysis of mammalian BAT and shed light on therapy development for postmenopausal-related obesity.
Materials and Methods
Animals and experiment design
Eight-week-old female Sprague Dawley rats were obtained from BioLASCO (A Charles River Licensee Corp., Yi-Lan, Taiwan). The animals were maintained at 12 h:12 h light-dark cycles, based on previous studies that show that diurnal and circadian rhythms are related to tissue function and gene expression [22, 23]. All animals were provided with a standard AIN-93 purified diet as reported [24] with some modification, including 405.7 g corn starch, 155 g dextrin, 140 g casein, 100 g sugar, 100 g corn oil, 50 g methyl cellulose, 35 g mineral mixture, 10 g vitamin mixture, 2.5 g choline bitrate, and 1.8 g L-Cystine/kg. The rats were raised at room temperature (23 ± 2°C), which was below their thermoneutral zone (28-32°C) [25], with humidity control (55% ± 10%), and offered distilled water ad libitum. The rats were allowed an acclimatization period of one week before the study was started. The animal experiment was approved by the Institutional Animal Care and Use Committee (IACUC) ethics committee under the protocol IACUC-LAC-99-251.
The rats were randomly divided into 2 groups: (1) Ovx group (n = 8), and (2) Sham control group (n = 8). The sample size of 8 rats in each group was validated by post hoc power analysis with α = 0.05 and power greater than 0.9. The effect size was calculated by Cohen's d. After acclimation for one week, anesthesia was performed by intraperitoneal injection of Zoletil/Xylazine (30 mg/kg Zoletil with 10 mg/kg Xylazine). The bilateral ovariectomy was conducted according to a standard CAF procedure. These Ovx rats only produce estrogen from extragonadal sites and were used extensively as a model of surgically induced menopause [26-28]. The Sham rats were subjected to the same general surgical procedure as that of the Ovx rats, except for the removal of bilateral ovaries. Since rats may have stress-like responses to the operation, and stress can induce browning and activation of BAT [29, 30], our study used the sham operation as the control group to avoid any adverse effects of surgery on BAT. All animals underwent the operation on the same date. Bodyweight and food intake were documented in the beginning of the study and four months after ovariectomy. As described in our previous report [26-28], the success of the ovariectomy was confirmed by assessing the plasma estradiol level. The plasma estradiol level was analyzed using a radioimmunoassay kit (Diagnostic Products Corporation, Los Angeles, CA, USA). Fourth months after ovariectomy, the plasma estradiol level was significantly decreased, by 90%, in the Ovx group in comparison to the Sham group (2.14±2.46 pg/mL vs. 21.07±9.3, p < 0.0001).
Brown adipose tissue collection
Animals were anesthetized with Zoletil/Xylazine and euthanized four months after ovariectomy or sham procedure. All animals were sacrificed on the same date after 12 h fasting. The interscapular BAT was carefully harvested, processed with ice-cold normal saline, then blotted dry and stored at -80 °C for further use. Blood samples were collected from the abdominal aorta.
Protein extraction and mass spectrometric data analysis
Protein preparation, extraction, SDS-PAGE, and in-gel digestion of the BAT samples were the same as reported in our previous study [26]. Each rat BAT sample (50 mg) was placed in a 1 mL sample tube containing ceramic beads and homogenized in cold buffer. Each lane of the gel was cut into ten equal pieces after G-250 staining. Each piece was de-stained in a mixed 50% acetonitrile and 25 mM NH4HCO3 (1:1, v/v) solution. After vacuum drying, gel pieces were rehydrated with 25 mM NH4HCO3 containing 1% β-mercaptoethanol and were alkylated in the buffer containing 5% 4-vinylpyridine in 25 mM NH4HCO3 and 50% acetonitrile (1:1, v/v) for 20 min. Trypsin (Promega, Mannheim, Germany) was added to digest the proteins overnight in gels in 25 mM NH4HCO3 (1%, w/v) at 37 °C. Afterward, tryptic peptides were extracted from the gel piece with 25 mM NH4HCO3 for 10 minutes, dried, and kept at -20 °C for further analysis.
Tryptic peptides dissolved in 10 μL formic acid (0.1%, v/v) were analyzed by liquid chromatography-mass spectrometry (NanoAcquity UP LC system, Waters, Manchester, UK) linked to a linear ion trap (Orbitrap; Thermo Scientific, San Jose, CA). The mobile phases consisted of solvent A (0.1% formic acid in water) and solvent B (0.1% formic acid in acetonitrile). Peptides loaded were initially desalted in a C18 PepMap column (180 μm inner diameter, 20 mm length, 5 μm beads, 100 Å pore size) and chromatographed in a C18 tip column (13.5 cm length, 75 μm inner diameter, and 5 μm beads; YMC-Gel) with 5-35% linear solvent B gradient for 90 minutes, and then 35-95% solvent B gradient for10 minutes at a flow rate of 0.5 μl/min.
The electrospray voltage applied for eluted peptides was 2 kV. Mass spectrometry (MS) data were recorded in data-dependent acquisition (isolation width: 1.5 Da), in which the m/z scan range was 200 to 1500 for a full scan at high resolution (> 30,000 full widths at half maximum) was scanned by MS/MS for the six most intensely charged ions (2+ and 3+). Fragmented ions of each selected precursor were generated by collision-induced dissociation with helium gas with a 35% collision energy.
The resulting MS/MS information was processed using the Xcalibur software package (version 2.0.7 SR1, Thermo-Finnigan Inc., San Jose, CA). The data were interpreted using PEAKS software (v. 8.5, Bioinformatics Solutions Inc., Waterloo, Ontario, Canada) and searched for the best-matched peptides in our protein database containing more than 530,000 entries. The false discovery rate (FDR) was set to 1% for protein identifications. All the proteins identified were annotated with UniPort ID with the following parameters: 20 ppm peptide mass tolerance and 0.8 Da fragment mass tolerance; precursor mass search type, monoisotopic; enzyme, trypsin; max missed cleavage, 2; nonspecific cleavage, 0; fixed modification; S-pyridylethylation; variable modification, methionine oxidation; and variable PTMs per peptide, 2. The results were adjusted to ≤ 1% FDR for peptide spectrum matches, -10 log P > 20, unique peptides ≥ 1, and de novo ALC score ≥ 80%. For quantitation, we normalized the MS spectral counts to the sum of the spectral counts of a sample.
Ingenuity pathway analysis
Ingenuity Pathway Analysis (IPA) software (QIAGEN Inc., https://www.qiagenbioinformatics.com/products/ingenuitypathway-analysis) was used to investigate the functions of the BAT proteome. Analysis match, activity plot, and pattern search were performed to validate the processing of IPA. Accession numbers and expression fold change of the differentially expressed proteins were loaded into the IPA software to perform biological functions and pathway analysis. The significance (p-value of overlap) was calculated by the Fisher's exact test.
Statistical analysis
All data are expressed as the mean ± standard deviation (SD) and analyzed by the t test. A p-value < 0.05 was considered statistically significant.
Results
Effects of ovariectomy on bodyweight, food intake, and calorie intake
Upon starting the experiment, there was no significant difference in initial bodyweight between the Ovx group (246±13 g) and the Sham group (240 ±14 g) at baseline. Four months after ovariectomy, the final body weight of the Ovx group (425±13 g) was greater than that of the Sham group (344±38 g) by 1.24-fold (p<0.05). The parametrial fat pad (PFP) and retroperitoneal fat pad (RFP) are white adipose tissues in the body. We only found that PFP mass was significantly greater for the Ovx group (17.86±3.27 g), by 1.63-fold (p<0.05), in comparison to that of the Sham group (10.97±2.83 g). The RFP weight had no significant difference between the Ovx group (5.70±2.73 g) and the Sham group (4.13±2.01 g). The daily food intake and calorie intake showed no significant difference between the Ovx group (12.11±1.10 g/rat/day, 38.1±7.3 kcal/rat/day) and the Sham group (10.64±2.04 g/rat/day, 43.4±3.9 kcal/rat/day). However, the daily food intake relative to body weight gain was significantly lower in the Ovx group in comparison to that of the Sham group (68.00±6.48 vs. 104.25±15.66 g/kg/day, p < 0.0001), which was suggestive of lower energy expenditure among the Ovx group.
Proteomic analysis
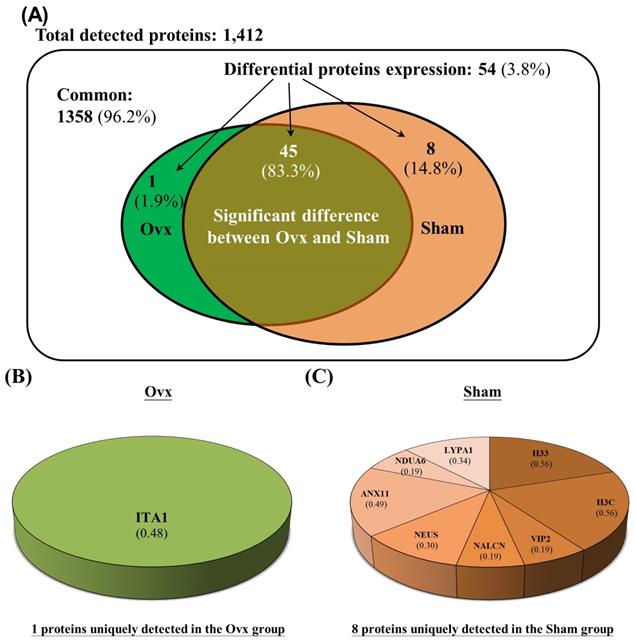
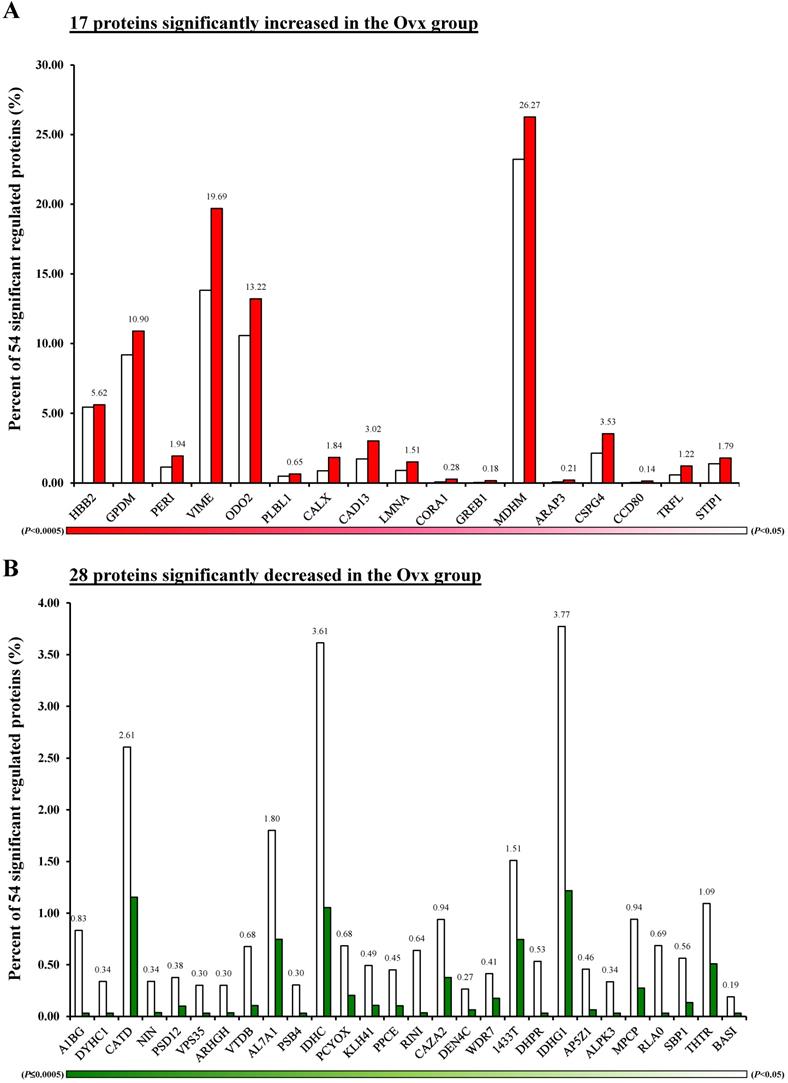
The Venn diagram in Figure 1 shows the common, overlapping, or uniquely detected proteins in the Ovx and Sham groups. There were 96.2% (1,358/1,412) common and 3.8% (54/1,412) differentially regulated proteins. When the 1358 common proteins were deducted and the rest of 54 differentially regulated proteins were normalized to 100%, the Ovx group 1.9% (1/54) unique proteins and the Sham group showed 14.8% (8/54) unique proteins, with 83.3% (45/54) overlapping regulated proteins between the two groups (Figure 1A). The only protein expressed in the Ovx group was Integrin alpha-1 (ITA1) (Figure 1B). The eight proteins that were only expressed in the Sham group were as follows: acyl-protein thioesterase 1 (LYPA1), annexin A11 (ANX11), histone H3.3 (H33), histone H3.3C (H3C), NADH dehydrogenase [ubiquinone] 1 alpha subcomplex subunit 6 (NDUA6), inositol hexakisphosphate and diphosphoinositol-pentakisphosphate kinase 2 (VIP2), sodium leak channel non-selective protein (NALCN), and neuroserpin (NEUS) (Figure 1C). In addition, among the 45 overlapping proteins, 17 increased and 28 decreased in the Ovx group compared to the Sham group (Figure 2). A complete list of all 54 proteins showing differential expression is provided in Table 1.
Significantly regulated proteins between the Ovx and Sham groups. (A) Venn diagram of the common, overlapping, or uniquely detected proteins; (B) The only protein detected in the Ovx group; (C) Distribution for the 8 proteins uniquely detected in the Sham group.
Differential BAT protein expression between Ovx and Sham rats ranked by p-values
| Description | Protein-ID | Abbrev. | Sham (n=8) | Ovx (n=8) | p value | Fold | Pooled SD | Cohen's d | Power (1-β) |
|---|---|---|---|---|---|---|---|---|---|
| The only protein uniquely detected in the Ovx group | |||||||||
| Integrin alpha-1 | Q3V3R4 | ITA1 | 0 ± 0 | 3.72 ± 1.43 | 0.0137 | 0.945 | 3.943 | 0.999 | |
| 17 proteins significantly increased in the Ovx group | |||||||||
| Glycerol-3-phosphate dehydrogenase, mitochondrial | Q64521 | GPDM | 55.12 ± 3.91 | 83.8 ± 8.46 | 0.0029 | +1.52 | 6.164 | 4.653 | 0.999 |
| Peripherin | P15331 | PERI | 6.81 ± 2.44 | 14.91 ± 2.66 | 0.0042 | +2.19 | 2.385 | 3.393 | 0.999 |
| Vimentin | P20152 | VIME | 82.86 ± 26.91 | 151.41 ± 26.45 | 0.0109 | +1.83 | 24.959 | 2.747 | 0.999 |
| Dihydrolipoyllysine-residue succinyltransferase component of 2-oxoglutarate dehydrogenase complex, mitochondrial | Q9D2G2 | ODO2 | 63.37 ± 17.48 | 101.63 ± 11.46 | 0.0137 | +1.60 | 13.825 | 2.767 | 0.999 |
| Phospholipase B-like 1 | Q8VCI0 | PLBL1 | 2.95 ± 0.93 | 5.01 ± 0.35 | 0.0156 | +1.70 | 0.657 | 3.132 | 0.999 |
| Calnexin | P35564 | CALX | 5.25 ± 2.16 | 14.14 ± 4.40 | 0.0192 | +2.69 | 3.244 | 2.740 | 0.999 |
| Cadherin-13 | Q9WTR5 | CAD13 | 10.32 ± 5.76 | 23.26 ± 5.78 | 0.0193 | +2.25 | 5.395 | 2.397 | 0.993 |
| Prelamin-A/C | P48678 | LMNA | 5.38 ± 1.82 | 11.64 ± 3.40 | 0.0257 | +2.16 | 2.550 | 2.455 | 0.995 |
| Collagen alpha-1(XXVII) chain | Q5QNQ9 | CORA1 | 0.45 ± 0.52 | 2.14 ± 0.93 | 0.0270 | +4.80 | 0.705 | 2.405 | 0.993 |
| Protein GREB1 | Q3UHK3 | GREB1 | 0.22 ± 0.45 | 1.35 ± 0.63 | 0.0309 | +6.06 | 0.512 | 2.194 | 0.979 |
| Malate dehydrogenase, mitochondrial | P08249 | MDHM | 139.24 ± 34.27 | 201.98 ± 28.79 | 0.0320 | +1.45 | 29.604 | 2.119 | 0.970 |
| Arf-GAP with Rho-GAP domain, ANK repeat and PH domain-containing protein 3 | Q8R5G7 | ARAP3 | 0.44 ± 0.51 | 1.60 ± 0.65 | 0.0324 | +3.64 | 0.544 | 2.129 | 0.972 |
| Hemoglobin subunit beta-2 | P02089 | HBB2 | 32.68 ± 6.17 | 43.2 ± 3.69 | 0.0335 | +1.32 | 4.754 | 2.213 | 0.981 |
| Chondroitin sulfate proteoglycan 4 | Q8VHY0 | CSPG4 | 12.83 ± 8.27 | 27.17 ± 5.84 | 0.0336 | +2.12 | 6.699 | 2.141 | 0.973 |
| Coiled-coil domain-containing protein 80 | Q8R2G6 | CCD80 | 0.23 ± 0.46 | 1.06 ± 0.07 | 0.0348 | +4.61 | 0.307 | 2.701 | 0.999 |
| Lactotransferrin | P08071 | TRFL | 3.47 ± 2.97 | 9.35 ± 3.38 | 0.0403 | +2.70 | 2.973 | 1.980 | 0.946 |
| Stress-induced-phosphoprotein 1 | Q60864 | STIP1 | 8.29 ± 3.22 | 13.79 ± 2.90 | 0.0444 | +1.66 | 2.864 | 1.921 | 0.932 |
| 8 proteins non-detected in the Ovx group but uniquely detected in the Sham group | |||||||||
| Histone H3.3 | P84244 | H33 | 3.39 ± 0.44 | 0 ± 0 | 0.0006 | 0.292 | 11.608 | 0.999 | |
| Histone H3.3C | P02301 | H3C | 3.39 ± 0.44 | 0 ± 0 | 0.0006 | 0.292 | 11.608 | 0.999 | |
| Inositol hexakisphosphate and diphosphoinositol-pentakisphosphate kinase 2 | Q6ZQB6 | VIP2 | 1.12 ± 0.41 | 0 ± 0 | 0.0116 | 0.268 | 4.181 | 0.999 | |
| Sodium leak channel non-selective protein | Q8BXR5 | NALCN | 1.12 ± 0.41 | 0 ± 0 | 0.0116 | 0.268 | 4.181 | 0.999 | |
| Neuroserpin | O35684 | NEUS | 1.79 ± 0.71 | 0 ± 0 | 0.0147 | 0.466 | 3.847 | 0.999 | |
| Annexin A11 | P97384 | ANX11 | 2.94 ± 1.16 | 0 ± 0 | 0.0149 | 0.768 | 3.822 | 0.999 | |
| NADH dehydrogenase [ubiquinone] 1 alpha subcomplex subunit 6 | Q9CQZ5 | NDUA6 | 1.14 ± 0.50 | 0 ± 0 | 0.0197 | 0.331 | 3.447 | 0.999 | |
| Acyl-protein thioesterase 1 | P97823 | LYPA1 | 2.05 ± 1.18 | 0 ± 0 | 0.0398 | 0.778 | 2.638 | 0.998 | |
| 28 proteins significantly decreased in the Ovx group | |||||||||
| Cytoplasmic dynein 1 heavy chain 1 | Q9JHU4 | DYHC1 | 2.03 ± 0.43 | 0.251 ± 0.501 | 0.0018 | -8.09 | 0.437 | 4.070 | 0.999 |
| Alpha-1B-glycoprotein | Q19LI2 | A1BG | 4.99 ± 1.30 | 0.251 ± 0.501 | 0.0027 | -19.89 | 0.920 | 5.156 | 0.999 |
| Cathepsin D | P18242 | CATD | 15.63 ± 2.06 | 8.881 ± 1.947 | 0.0031 | -1.76 | 1.873 | 3.603 | 0.999 |
| Ninein | Q61043 | NIN | 2.04 ± 0.48 | 0.287 ± 0.574 | 0.0037 | -7.10 | 0.497 | 3.526 | 0.999 |
| 26S proteasome non-ATPase regulatory subunit 12 | Q9D8W5 | PSD12 | 2.26 ± 0.53 | 0.773 ± 0.517 | 0.0070 | -2.92 | 0.490 | 3.033 | 0.999 |
| Vacuolar protein sorting-associated protein 35 | Q9EQH3 | VPS35 | 1.81 ± 0.07 | 0.25 ± 0.499 | 0.0076 | -7.23 | 0.333 | 4.673 | 0.999 |
| Rho guanine nucleotide exchange factor 17 | Q80U35 | ARHGH | 1.81 ± 0.07 | 0.272 ± 0.545 | 0.0103 | -6.65 | 0.364 | 4.225 | 0.999 |
| Vitamin D-binding protein | P21614 | VTDB | 4.05 ± 1.54 | 0.809 ± 0.543 | 0.0186 | -5.01 | 1.077 | 3.012 | 0.999 |
| Alpha-aminoadipic semialdehyde dehydrogenase | Q9DBF1 | AL7A1 | 10.79 ± 2.34 | 5.737 ± 2.184 | 0.0197 | -1.88 | 2.119 | 2.387 | 0.992 |
| Proteasome subunit beta type-4 | P99026 | PSB4 | 1.83 ± 0.81 | 0.25 ± 0.499 | 0.0206 | -7.31 | 0.626 | 2.519 | 0.997 |
| Isocitrate dehydrogenase [NADP] cytoplasmic | O88844 | IDHC | 21.67 ± 6.94 | 8.109 ± 5.921 | 0.0257 | -2.67 | 6.036 | 2.246 | 0.984 |
| Prenylcysteine oxidase | Q9CQF9 | PCYOX | 4.10 ± 1.33 | 1.574 ± 1.059 | 0.0261 | -2.61 | 1.122 | 2.252 | 0.984 |
| Kelch-like protein 41 | A2AUC9 | KLH41 | 2.956 ± 0.95 | 0.823 ± 1.088 | 0.0261 | -3.59 | 0.956 | 2.231 | 0.983 |
| Prolyl endopeptidase | Q9QUR6 | PPCE | 2.70 ± 0.71 | 0.795 ± 1.037 | 0.0267 | -3.40 | 0.831 | 2.298 | 0.988 |
| Ribonuclease inhibitor | Q91VI7 | RINI | 3.83 ± 1.86 | 0.272 ± 0.545 | 0.0269 | -14.09 | 1.284 | 2.773 | 0.999 |
| F-actin-capping protein subunit alpha-2 | P47754 | CAZA2 | 5.63 ± 1.49 | 2.905 ± 0.968 | 0.0269 | -1.94 | 1.175 | 2.317 | 0.989 |
| DENN domain-containing protein 4C | A6H8H2 | DEN4C | 1.59 ± 0.49 | 0.5 ± 0.578 | 0.0287 | -3.18 | 0.500 | 2.182 | 0.978 |
| WD repeat-containing protein 7 | Q920I9 | WDR7 | 2.48 ± 0.44 | 1.346 ± 0.634 | 0.0297 | -1.84 | 0.511 | 2.224 | 0.982 |
| 14-3-3 protein theta | P68254 | 1433T | 9.05 ± 1.24 | 5.723 ± 1.87 | 0.0297 | -1.58 | 1.482 | 2.246 | 0.984 |
| Dihydropteridine reductase | Q8BVI4 | DHPR | 3.20 ± 1.62 | 0.251 ± 0.501 | 0.0305 | -12.74 | 1.121 | 2.629 | 0.998 |
| Isocitrate dehydrogenase [NAD] subunit gamma 1, mitochondrial | P70404 | IDHG1 | 22.62 ± 7.61 | 9.363 ± 3.954 | 0.0311 | -2.42 | 5.674 | 2.336 | 0.990 |
| AP-5 complex subunit zeta-1 | Q3U829 | AP5Z1 | 2.74 ± 1.33 | 0.501 ± 1.002 | 0.0385 | -5.47 | 1.099 | 2.037 | 0.957 |
| Alpha-protein kinase 3 | Q924C5 | ALPK3 | 2.02 ± 1.10 | 0.25 ± 0.499 | 0.0409 | -8.06 | 0.800 | 2.207 | 0.980 |
| Phosphate carrier protein, mitochondrial | Q8VEM8 | MPCP | 5.64 ± 2.14 | 2.117 ± 1.637 | 0.0422 | -2.66 | 1.780 | 1.979 | 0.946 |
| 60S acidic ribosomal protein P0 | P14869 | RLA0 | 4.12 ± 2.34 | 0.25 ± 0.499 | 0.0426 | -16.46 | 1.583 | 2.443 | 0.994 |
| Methanethiol oxidase | P17563 | SBP1 | 3.38 ± 1.11 | 1.039 ± 1.419 | 0.0429 | -3.25 | 1.190 | 1.966 | 0.943 |
| Thiosulfate sulfurtransferase | P52196 | THTR | 6.55 ± 1.17 | 3.916 ± 1.64 | 0.0438 | -1.67 | 1.333 | 1.977 | 0.945 |
| Basigin | P18572 | BASI | 1.14 ± 0.50 | 0.251 ± 0.501 | 0.0457 | -4.54 | 0.468 | 1.899 | 0.926 |
Table 1 is a list of uniquely detected, significantly increased, non-detected, and significantly decreased brown adipose tissue proteome at 4-month after ovariectomy, as ranked by p-values. 2 Sham and Ovx expression ratios were the Mean ± SD of peptides quantified in each sample expressed relative to the pooled internal standard. 3 p-values were analyzed by paired Student's t-test. Fold difference relative to Sham values was reported and p-values were determined from log-transformed data using Student's independent t-tests. 4 The effect size was calculated by pooled SD, and cohen's d. 5 The sample size of 8 rats in each group was validated by post hoc power analysis with α = 0.05 and power greater than 0.9.
Differentially expressed proteins; (A) Percentage distribution for the 17 proteins with significantly increased in the Ovx group compared to the Sham group; (B) Percentage distribution for the 28 proteins with significantly decreased in the Ovx group compared to the Sham group.
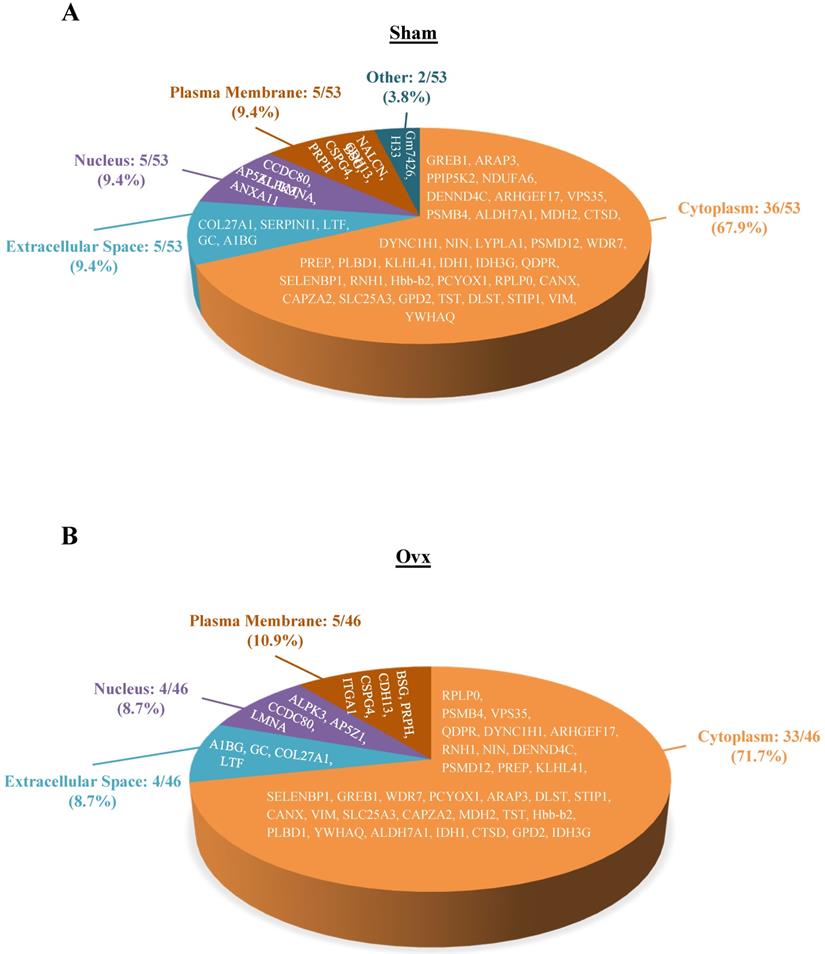
The 46 and 53 differentially expressed proteins for the Ovx and Sham groups, respectively, were mostly in the cytoplasm (33/46, Ovx group; 36/53, Sham group), plasma membrane (5/46, Ovx group; 5/53, Sham group), nucleus (4/46, Ovx group; 5/53, Sham group), and extracellular space (4/46, Ovx group; 5/53, Sham group) (Figure 3).
Pie charts represents the cellular locations of the differentially expressed proteins in the Ovx and Sham groups. (A) Distribution of the 53 differential proteins of the Sham group; (B) Distribution of the 46 differential proteins of the Ovx group.
Ingenuity pathways analysis
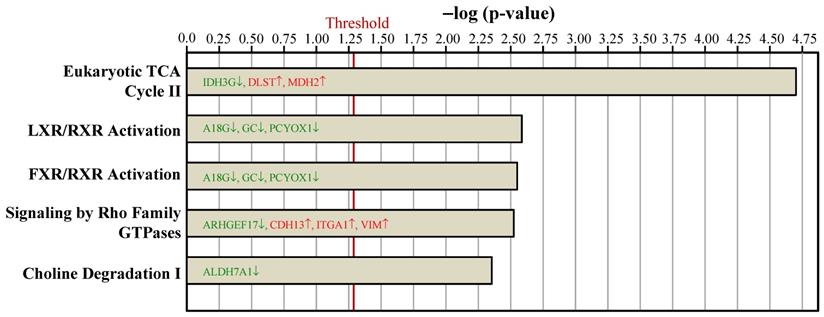
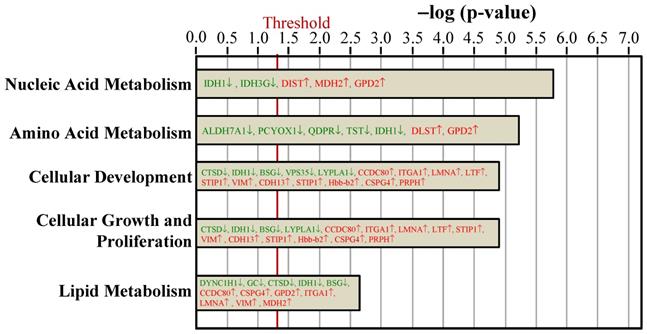
To examine the proteome mapping analysis of differential expressed proteins between the Ovx and Sham groups, IPA was conducted. The proteins in BAT whose expressions were changed by ovariectomy were analyzed by their canonical signaling pathways (Figure 4) and biologic functions (Figure 5). In Figure 4 and 5, the proteins in red letters were upregulated by ovariectomy, whereas those in green letters were downregulated.
Ingenuity pathways analyses compared the top 5 canonical pathways between the Ovx and Sham groups based on peer-reviewed literature database. The x-axis represents the negative log of the p-value, calculated by the right-tailed Fisher exact test. Proteins in red letters were upregulated by ovariectomy and those in green letters were downregulated. The threshold of p < 0.05 is displayed as the red vertical line.
Ingenuity pathways analyses compared the biologic function proteins between the Ovx and Sham groups based on peer-reviewed literature database. The threshold of p < 0.05 is displayed as the red vertical line.
The top statistically significant canonical pathways affected by the differential proteins due to ovariectomy included eukaryotic tricarboxylic acid (TCA) cycle II, liver X receptor (LXR)/retinoid X receptor (RXR) activation, farnesoid X receptor (FXR)/retinoid X receptor (RXR) activation, signaling by Rho family GTPases, and choline degradation I (Figure 4). Most of the canonical pathways were associated with energy dissipation in BAT and adipogenesis.
The key molecular and cellular functions of the ovariectomy-regulated proteins in BAT were categorized into nucleic acid metabolism, amino acid metabolism, cellular development, cellular growth and proliferation, and lipid metabolism (Figure 5). The nucleic acid metabolism influenced by differentially expressed proteins included metabolism of NADH, NADPH, and 5-hydroxymethylation of cytosine. The adipogenesis of adipose cell lines was predicted to be decreased since the VPS35 protein was downregulated in our dataset. The catabolism of amino acid and the lipolysis of non-esterified fatty acid were also affected.
Discussion
In the current study, using the hypothesis that BAT proteins can be regulated by ovariectomy as a low level of estrogen in postmenopausal status, we performed a comparative proteomic analysis on BAT comparing Ovx and Sham rats. To gain insight into how ovariectomy interferes with BAT proteomes, IPA software was used to examine the interaction between differentially regulated proteins based on known connections in peer-reviewed literature. Although the findings are putative and preliminary, our study demonstrates that ovariectomy may impact several different proteins related to BAT metabolic pathways. The BAT proteome was significantly altered by ovariectomy, especially in proteins involving BAT morphology, browning of white adipose tissue, and metabolic substrates for thermogenesis.
Among the 54 significantly regulated proteins in our study, several proteins have been previously reported to interfere with the white adipose tissue browning pathway and disrupt the morphology of BAT. Twelve proteins were found related to the white adipose tissue browning pathway, including ARAP3, BSG, CCDC80, CTSD, GC, GPD2, IDH1, ITGA1, LMNA, LTF, LYPLA1, and VPS35. Most of these are associated with the expression of peroxisome proliferator-activated receptor-γ (PPARγ), an important transcription factor that regulates adipocyte gene expression and differentiation and induces the browning of white adipose tissue [31, 32]. Estrogen receptors and PPARγ are both nuclear receptor families and have convergence of signaling crosstalk [33]. Browning of white adipocytes is compromised when PPARγ signaling is disrupted due to ovariectomy [34]. In addition, SBP1 and DYHC1 are involved in the differentiation of BAT [35] and were markedly reduced in the Ovx group. Decreased levels of SBP1 and DYHC1 would disrupt the morphology of BAT, causing defects in energy metabolism [36]. On the other hand, the increased CSPG4 in the Ovx group leads to abnormal morphology of BAT and hinders BAT-dependent energy homeostasis [37]. Our result suggests that ovariectomy hampers the browning and morphology of BAT.
A low level of estrogen reduces UCP1 expression and BAT thermogenesis in ovariectomized rats [38, 39]. Two of the differentially expressed proteins, DYHC1 and LMNA, mediate sterol regulatory element binding transcription factor 1 (SREBF1) [40, 41] and CCAAT enhancer binding protein beta (C/EBP-β) [42], transcription factors that decrease the expression of mouse UCP1 mRNA [43, 44]. On the other hand, transcription factors that increase expression of UCP1 such as forkhead box C2 (FOXC2) [45], E2F transcription factor 1 (E2F1) [46], and Kruppel-like factor 11 (KLF11) [47], are downregulated by multiple differentially expressed proteins in our study, including VTDB, TRFL, and VIME. In addition, several UCP1-independent thermogenic pathways have been identified in recent years, such as Ca2+ futile cycling, creatine futile cycling, and triglycerides-fatty acid cycling [48]. Estrogen can also modulate BAT development and thermogenesis via the hypothalamic adenosine monophosphate-activated protein kinase (AMPK) signaling pathway [49]. AMPK activation can stimulate Ca2+ cycling thermogenesis [50]. We observed significantly increased lactotransferrin (TRFL), which decreases the activity of the AMPK complex [51]. Moreover, LMNA and VTDB were found to alter the level of Ca2+ in previous murine studies [52, 53]. We can therefore postulate that ovariectomy results in the disruption of UCP1 expression as well as the AMPK pathway, which leads to decreased BAT thermogenic activity in the long run.
Furthermore, estrogen may also indirectly regulate BAT activity by modulating different metabolic pathways related to energy homeostasis. Most of the differentially expressed proteins were mainly involved in nucleic acid, amino acid, and lipid metabolism. The downregulations of enzymes involved in utilizing glucose, branched-chain amino acids, and lipids for thermogenesis are of significant interest. The activation of BAT thermogenesis involves glucose uptake, branched-chain amino acid catabolism, and hydrolysis of intracellular triglycerides for the production of fatty acids, which serve as both activators and metabolic substrates for BAT mitochondria [54-56]. The proteins required in the fatty acid and glucose metabolism process were found to be downregulated in the Ovx group. For instance, DYHC1 decreased in the Ovx group and would lead to decreases in lipolysis to non-esterified fatty acid [36]. The catabolism of essential amino acids is affected by ODO2, AL7A1, and DHPR. In addition, proteins that act as enzymes in mitochondria were dysregulated. Specifically, IDH3G, DLST, and MDH2 have downstream effects on the metabolism of NADH in the TCA cycle [57-59]. On the other hand, the uniquely upregulated protein ITA1 in the Ovx group is worth exploring. ITA1 is an important receptor for laminin and collagen in the extracellular matrix and plays a key role in cell adhesion as well as interacting with insulin receptors in adipocytes [60]. The pathological accumulation of extracellular matrix proteins has metabolic consequences including insulin resistance and adipose tissue inflammation [61, 62]. Furthermore, a study conducted by Malinská et al. found that the interscapular BAT in the Ovx rats exhibited decreased fatty acid oxidation, lipogenesis, and lipolysis, which might lead to visceral adiposity as well as triglyceride accumulation [63]. Our results are supported by previous literature in which BAT metabolic pathways were impaired in response to ovariectomy and might have contributed to postmenopausal obesity in the long run [63, 64].
Our study has several limitations. First of all, because our study mainly focused on the BAT proteomic changes in response to ovariectomy, we did not quantify the mass of BAT nor analyze the mRNA expression. Moreover, since ovariectomized rats have been widely used as a menopausal animal model that promotes the development of obesity, glucose intolerance, insulin resistance, and dyslipidemia, we did not measure other metabolic profiles such as fasting glucose or cholesterol. The mRNA analysis is not a direct reflection of the protein content in the cell. Recent studies have indicated a poor correlation between mRNA and protein expression due to various factors such as post-transcriptional control [65, 66]. An integrated transcriptomic and proteomic analysis might be warranted in the future. Secondly, the underlying mechanisms between differentially expressed proteins and BAT functions were mostly postulated from the IPA knowledge database and the known literature. Further studies building upon these preliminary findings to rigorously validate the results by thorough experiments (e.g., via histology and Western blot) are warranted. Additionally, since ovariectomy was performed in young healthy animals, the use of ovariectomized rats may not be a flawless model for natural reproductive senescence wherein aging is also an important factor. However, natural senescence in rats would increase the risks of developing cancer or other comorbidities [67], and around 60-70% of the aging rats spontaneously transition to a poly-follicular anovulatory status with low levels of progesterone and sustained levels of plasma estradiol that can last 10-100 days [68]. The above-mentioned problems can thereby cause heterogeneity among our animals and further reduce the power of the experiment to detect the exclusive effect of the loss of ovarian function. Hence, we choose to use ovariectomy, a surgical model widely used in menopause that allows us to reduce possible confounding [26, 27, 69]. Last but not least, although the plasma estradiol level was significantly decreased in the Ovx group, the direct causal relationship with estrogen deficiency cannot be proven due to no intervention group with estradiol to access the reversibility of these proteomic changes. Moreover, the BAT proteome might be influenced in different environments such as thermoneutrality, cold exposure, or a high-fat diet [12, 20, 70]. Further studies investigating the BAT proteomic change under different temperatures or diets as well as the reversibility under estrogen replacement might be important to provide a deeper understanding of the relationship between BAT, estrogen, and environmental factors.
Conclusions
In conclusion, we report a proteomic analysis of BAT comparing Ovx and Sham rats to investigate how the BAT proteome is altered in ovariectomized rats as a model of surgically induced menopause. Proteomic investigations into protein modulation in BAT revealed the expression of numerous proteins involved in BAT morphology, the browning of white adipose tissue, and metabolic substrates for thermogenesis was regulated by ovariectomy. The dysregulation of proteins by ovariectomy might be related to the disruption of BAT function in the postmenopausal status. Our results provide a further understanding of the effects of ovariectomy on the alterations of the BAT proteome and postulate possible links to the metabolic consequences, which may help illuminate novel therapeutic strategies for the management of postmenopausal weight gain in the future.
Abbreviations
AMPK: adenosine monophosphate-activated protein kinase; BAT: Brown adipose tissue; C/EBP-β: CCAAT enhancer binding protein beta; E2F1: E2F transcription factor 1; FDR: false discovery rate; FOXC2: forkhead box C2; FXR: farnesoid X receptor; IPA: Ingenuity Pathway Analysis; KLF11: Kruppel-like factor 11; LXR: liver X receptor; Ovx: ovariectomy; PFP: parametrial fat pad; PPARγ: peroxisome proliferator-activated receptor-γ; RFP: retroperitoneal fat pad; RXR: retinoid X receptor; SD: standard deviation; Sham: sham-operation; SREBF1: sterol regulatory element binding transcription factor 1; TCA: tricarboxylic acid; UCP1: uncoupling protein 1.
Acknowledgements
This study was supported by the Ministry of Science and Technology of Taiwan (grant no. MOST-110-2314-B-002-094-MY2 to Kuo-Chin Huang). The authors are grateful to Professor Wan-Chun Chiu for technical assistance in animal experiments.
Ethics Committee Approval
The study was conducted according to the guidelines of the Institutional Animal Care and Use Committee (IACUC) of Taipei Medical University. The IACUC ethics committee approved this study under the protocol IACUC-LAC-99-251.
Author Contributions
K.-C.H. and C.-C.H. conceptualized and designed the study. T.-J.C. per-formed the formal analyses and prepared the original draft. C.-W.L., C.-C.L., C.-H.C. contributed medical expertise and reviewed the manuscript. All authors have read and agreed to the published version of the manuscript.
Competing Interests
The authors have declared that no competing interest exists.
References
1. Marchand GB, Carreau A-M, Weisnagel SJ, Bergeron J, Labrie F, Lemieux S. et al. Increased body fat mass explains the positive association between circulating estradiol and insulin resistance in postmenopausal women. American Journal of Physiology-Endocrinology and Metabolism. 2018;314:E448-E56
2. Gurka MJ, Vishnu A, Santen RJ, DeBoer MD. Progression of Metabolic Syndrome Severity During the Menopausal Transition. Journal of the American Heart Association. 2016;5:e003609
3. Lin WY, Yang WS, Lee LT, Chen CY, Liu CS, Lin CC. et al. Insulin resistance, obesity, and metabolic syndrome among non-diabetic pre- and post-menopausal women in North Taiwan. Int J Obes (Lond). 2006;30:912-7
4. Tramunt B, Smati S, Grandgeorge N, Lenfant F, Arnal JF, Montagner A. et al. Sex differences in metabolic regulation and diabetes susceptibility. Diabetologia. 2020;63:453-61
5. Mauvais-Jarvis F, Clegg DJ, Hevener AL. The role of estrogens in control of energy balance and glucose homeostasis. Endocr Rev. 2013;34:309-38
6. Frank A, Brown LM, Clegg DJ. The role of hypothalamic estrogen receptors in metabolic regulation. Front Neuroendocrinol. 2014;35:550-7
7. Gavin KM, Kohrt WM, Klemm DJ, Melanson EL. Modulation of Energy Expenditure by Estrogens and Exercise in Women. Exerc Sport Sci Rev. 2018;46:232-9
8. Fahlén M, Fornander T, Johansson H, Johansson U, Rutqvist LE, Wilking N. et al. Hormone replacement therapy after breast cancer: 10 year follow up of the Stockholm randomised trial. Eur J Cancer. 2013;49:52-9
9. Baber RJ, Panay N, Fenton A. 2016 IMS Recommendations on women's midlife health and menopause hormone therapy. Climacteric. 2016;19:109-50
10. Payab M, Abedi M, Foroughi Heravani N, Hadavandkhani M, Arabi M, Tayanloo-Beik A. et al. Brown adipose tissue transplantation as a novel alternative to obesity treatment: a systematic review. International Journal of Obesity. 2020
11. Peres Valgas da Silva C, Hernández-Saavedra D, White JD, Stanford KI. Cold and exercise: Therapeutic tools to activate brown adipose tissue and combat obesity. Biology. 2019;8:9
12. Gaspar RC, Pauli JR, Shulman GI, Muñoz VR. An update on brown adipose tissue biology: a discussion of recent findings. American Journal of Physiology-Endocrinology and Metabolism. 2021;320:E488-E95
13. Samuelson I, Vidal-Puig A. Studying Brown Adipose Tissue in a Human in vitro Context. Front Endocrinol (Lausanne). 2020;11:629 -
14. Ikeda K, Maretich P, Kajimura S. The Common and Distinct Features of Brown and Beige Adipocytes. Trends in Endocrinology & Metabolism. 2018;29:191-200
15. Kaikaew K, Grefhorst A, Visser JA. Sex Differences in Brown Adipose Tissue Function: Sex Hormones, Glucocorticoids, and Their Crosstalk. Front Endocrinol (Lausanne). 2021 12
16. Zhou Z, Moore TM, Drew BG, Ribas V, Wanagat J, Civelek M. et al. Estrogen receptor α controls metabolism in white and brown adipocytes by regulating Polg1 and mitochondrial remodeling. Science Translational Medicine. 2020;12:eaax8096
17. Bernasochi GB, Bell JR, Simpson ER, Delbridge LMD, Boon WC. Impact of Estrogens on the Regulation of White, Beige, and Brown Adipose Tissue Depots. Comprehensive Physiology. 2019 p. 457-75
18. Goossens GH, Jocken JWE, Blaak EE. Sexual dimorphism in cardiometabolic health: the role of adipose tissue, muscle and liver. Nat Rev Endocrinol. 2021;17:47-66
19. Aebersold R, Mann M. Mass-spectrometric exploration of proteome structure and function. Nature. 2016;537:347-55
20. Li J, Li J, Zhao W-G, Sun H-D, Guo Z-G, Liu X-Y. et al. Comprehensive proteomics and functional annotation of mouse brown adipose tissue. PLOS ONE. 2020;15:e0232084
21. Müller S, Balaz M, Stefanicka P, Varga L, Amri E-Z, Ukropec J. et al. Proteomic Analysis of Human Brown Adipose Tissue Reveals Utilization of Coupled and Uncoupled Energy Expenditure Pathways. Sci Rep. 2016;6:30030
22. Zhang R, Lahens NF, Ballance HI, Hughes ME, Hogenesch JB. A circadian gene expression atlas in mammals: implications for biology and medicine. Proc Natl Acad Sci U S A. 2014;111:16219-24
23. van der Veen DR, Shao J, Chapman S, Leevy WM, Duffield GE. A Diurnal Rhythm in Glucose Uptake in Brown Adipose Tissue Revealed by In vivo PET-FDG Imaging. Obesity. 2012;20:1527-9
24. Reeves PG, Nielsen FH, Fahey GC Jr. AIN-93 purified diets for laboratory rodents: final report of the American Institute of Nutrition ad hoc writing committee on the reformulation of the AIN-76A rodent diet. J Nutr. 1993;123:1939-51
25. Gordon CJ. The mouse thermoregulatory system: Its impact on translating biomedical data to humans. Physiol Behav. 2017;179:55-66
26. Liao C-C, Chiu Y-S, Chiu W-C, Tung Y-T, Chuang H-L, Wu J-H. et al. Proteomics Analysis to Identify and Characterize the Molecular Signatures of Hepatic Steatosis in Ovariectomized Rats as a Model of Postmenopausal Status. Nutrients. 2015;7:8752-66
27. Saleh N, Nassef NA, Shawky MK, Elshishiny MI, Saleh HA. Novel approach for pathogenesis of osteoporosis in ovariectomized rats as a model of postmenopausal osteoporosis. Experimental Gerontology. 2020;137:110935
28. Xu X, Li X, Liang Y, Ou Y, Huang J, Xiong J. et al. Estrogen Modulates Cartilage and Subchondral Bone Remodeling in an Ovariectomized Rat Model of Postmenopausal Osteoarthritis. Med Sci Monit. 2019;25:3146-53
29. Razzoli M, Frontini A, Gurney A, Mondini E, Cubuk C, Katz LS. et al. Stress-induced activation of brown adipose tissue prevents obesity in conditions of low adaptive thermogenesis. Mol Metab. 2016;5:19-33
30. Jeanson Y, Carrière A, Casteilla L. A New Role for Browning as a Redox and Stress Adaptive Mechanism? Front Endocrinol (Lausanne). 2015 6
31. Kroon T, Harms M, Maurer S, Bonnet L, Alexandersson I, Lindblom A. et al. PPARγ and PPARα synergize to induce robust browning of white fat in vivo. Molecular Metabolism. 2020;36:100964
32. Hernandez-Quiles M, Broekema MF, Kalkhoven E. PPARgamma in Metabolism, Immunity, and Cancer: Unified and Diverse Mechanisms of Action. Front Endocrinol (Lausanne). 2021 12
33. Broekema MF, Savage DB, Monajemi H, Kalkhoven E. Gene-gene and gene-environment interactions in lipodystrophy: Lessons learned from natural PPARγ mutants. Biochimica et Biophysica Acta (BBA) - Molecular and Cell Biology of Lipids. 2019;1864:715-32
34. Xiong W, Zhao X, Villacorta L, Rom O, Garcia-Barrio MT, Guo Y. et al. Brown Adipocyte-Specific PPARγ (Peroxisome Proliferator-Activated Receptor γ) Deletion Impairs Perivascular Adipose Tissue Development and Enhances Atherosclerosis in Mice. Arteriosclerosis, Thrombosis, and Vascular Biology. 2018;38:1738-47
35. Steinbrenner H, Micoogullari M, Hoang NA, Bergheim I, Klotz LO, Sies H. Selenium-binding protein 1 (SELENBP1) is a marker of mature adipocytes. Redox Biol. 2019;20:489-95
36. Eschbach J, Fergani A, Oudart H, Robin JP, Rene F, Gonzalez de Aguilar JL. et al. Mutations in cytoplasmic dynein lead to a Huntington's disease-like defect in energy metabolism of brown and white adipose tissues. Biochim Biophys Acta. 2011;1812:59-69
37. Chang Y, She Z-G, Sakimura K, Roberts A, Kucharova K, Rowitch DH. et al. Ablation of NG2 Proteoglycan Leads to Deficits in Brown Fat Function and to Adult Onset Obesity. PLOS ONE. 2012;7:e30637
38. Pedersen SB, Bruun JM, Kristensen K, Richelsen B. Regulation of UCP1, UCP2, and UCP3 mRNA expression in brown adipose tissue, white adipose tissue, and skeletal muscle in rats by estrogen. Biochem Biophys Res Commun. 2001;288:191-7
39. Sievers W, Rathner JA, Kettle C, Zacharias A, Irving HR, Green RA. The capacity for oestrogen to influence obesity through brown adipose tissue thermogenesis in animal models: A systematic review and meta-analysis. Obesity Science & Practice. 2019;5:592-602
40. Ebmeier CC, Taatjes DJ. Activator-Mediator binding regulates Mediator-cofactor interactions. Proc Natl Acad Sci U S A. 2010;107:11283-8
41. Vadrot N, Duband-Goulet I, Cabet E, Attanda W, Barateau A, Vicart P. et al. The p.R482W substitution in A-type lamins deregulates SREBP1 activity in Dunnigan-type familial partial lipodystrophy. Hum Mol Genet. 2015;24:2096-109
42. Cirilli M, Bereshchenko O, Ermakova O, Nerlov C. Insights into specificity, redundancy and new cellular functions of C/EBPa and C/EBPb transcription factors through interactome network analysis. Biochimica et Biophysica Acta (BBA) - General Subjects. 2017;1861:467-76
43. Shimomura I, Hammer RE, Richardson JA, Ikemoto S, Bashmakov Y, Goldstein JL. et al. Insulin resistance and diabetes mellitus in transgenic mice expressing nuclear SREBP-1c in adipose tissue: model for congenital generalized lipodystrophy. Genes Dev. 1998;12:3182-94
44. Karamitri A, Shore AM, Docherty K, Speakman JR, Lomax MA. Combinatorial transcription factor regulation of the cyclic AMP-response element on the Pgc-1alpha promoter in white 3T3-L1 and brown HIB-1B preadipocytes. J Biol Chem. 2009;284:20738-52
45. Seale P, Kajimura S, Spiegelman BM. Transcriptional control of brown adipocyte development and physiological function-of mice and men. Genes Dev. 2009;23:788-97
46. Blanchet E, Annicotte JS, Lagarrigue S, Aguilar V, Clapé C, Chavey C. et al. E2F transcription factor-1 regulates oxidative metabolism. Nat Cell Biol. 2011;13:1146-52
47. Loft A, Forss I, Siersbæk MS, Schmidt SF, Larsen AS, Madsen JG. et al. Browning of human adipocytes requires KLF11 and reprogramming of PPARγ superenhancers. Genes Dev. 2015;29:7-22
48. Cohen P, Kajimura S. The cellular and functional complexity of thermogenic fat. Nature Reviews Molecular Cell Biology. 2021;22:393-409
49. Martínez de Morentin Pablo B, González-García I, Martins L, Lage R, Fernández-Mallo D, Martínez-Sánchez N. et al. Estradiol Regulates Brown Adipose Tissue Thermogenesis via Hypothalamic AMPK. Cell Metabolism. 2014;20:41-53
50. Aquilano K, Sciarretta F, Turchi R, Li B-H, Rosina M, Ceci V. et al. Low-protein/high-carbohydrate diet induces AMPK-dependent canonical and non-canonical thermogenesis in subcutaneous adipose tissue. Redox Biology. 2020;36:101633
51. Moreno-Navarrete JM, Ortega F, Sabater M, Ricart W, Fernández-Real JM. Proadipogenic effects of lactoferrin in human subcutaneous and visceral preadipocytes. J Nutr Biochem. 2011;22:1143-9
52. Villa-Bellosta R. ATP-based therapy prevents vascular calcification and extends longevity in a mouse model of Hutchinson-Gilford progeria syndrome. Proc Natl Acad Sci U S A. 2019;116:23698-704
53. Duchow EG, Cooke NE, Seeman J, Plum LA, DeLuca HF. Vitamin D binding protein is required to utilize skin-generated vitamin D. Proc Natl Acad Sci U S A. 2019;116:24527-32
54. Fedorenko A, Lishko Polina V, Kirichok Y. Mechanism of Fatty-Acid-Dependent UCP1 Uncoupling in Brown Fat Mitochondria. Cell. 2012;151:400-13
55. McNeill BT, Morton NM, Stimson RH. Substrate Utilization by Brown Adipose Tissue: What's Hot and What's Not? Front Endocrinol (Lausanne). 2020;11:571659
56. Yoneshiro T, Wang Q, Tajima K, Matsushita M, Maki H, Igarashi K. et al. BCAA catabolism in brown fat controls energy homeostasis through SLC25A44. Nature. 2019;572:614-9
57. Lai JC, Clark JB. Preparation and properties of mitochondria derived from synaptosomes. Biochem J. 1976;154:423-32
58. Matuda S, Kodama J, Goshi N, Takase C, Nakano K, Nakagawa S. et al. A polypeptide derived from mitochondrial dihydrolipoamide succinyltransferase is located on the plasma membrane in skeletal muscle. Biochem Biophys Res Commun. 1997;241:151-6
59. Tan C, Tuch BE, Tu J, Brown SA. Role of NADH shuttles in glucose-induced insulin secretion from fetal beta-cells. Diabetes. 2002;51:2989-96
60. Moser M, Legate KR, Zent R, Fässler R. The tail of integrins, talin, and kindlins. Science. 2009;324:895-9
61. Williams AS, Kang L, Wasserman DH. The extracellular matrix and insulin resistance. Trends Endocrinol Metab. 2015;26:357-66
62. Anguita-Ruiz A, Bustos-Aibar M, Plaza-Díaz J, Mendez-Gutierrez A, Alcalá-Fdez J, Aguilera CM. et al. Omics Approaches in Adipose Tissue and Skeletal Muscle Addressing the Role of Extracellular Matrix in Obesity and Metabolic Dysfunction. International Journal of Molecular Sciences. 2021;22:2756
63. Malinská H, Hüttl M, Miklánková D, Trnovská J, Zapletalová I, Poruba M. et al. Ovariectomy-Induced Hepatic Lipid and Cytochrome P450 Dysmetabolism Precedes Serum Dyslipidemia. Int J Mol Sci. 2021 22
64. Nadal-Casellas A, Proenza AM, Lladó I, Gianotti M. Effects of ovariectomy and 17-β estradiol replacement on rat brown adipose tissue mitochondrial function. Steroids. 2011;76:1051-6
65. Haider S, Pal R. Integrated analysis of transcriptomic and proteomic data. Curr Genomics. 2013;14:91-110
66. Wang J, Wu G, Chen L, Zhang W. Integrated Analysis of Transcriptomic and Proteomic Datasets Reveals Information on Protein Expressivity and Factors Affecting Translational Efficiency. Methods Mol Biol. 2016;1375:123-36
67. Collado M, Serrano M. Senescence in tumours: evidence from mice and humans. Nat Rev Cancer. 2010;10:51-7
68. Finch CE, Felicio LS, Mobbs CV, Nelson JF. Ovarian and steroidal influences on neuroendocrine aging processes in female rodents. Endocr Rev. 1984;5:467-97
69. Medina-Contreras J, Villalobos-Molina R, Zarain-Herzberg A, Balderas-Villalobos J. Ovariectomized rodents as a menopausal metabolic syndrome model. A minireview. Mol Cell Biochem. 2020;475:261-76
70. Cui X, Nguyen NL, Zarebidaki E, Cao Q, Li F, Zha L. et al. Thermoneutrality decreases thermogenic program and promotes adiposity in high-fat diet-fed mice. Physiol Rep. 2016 4
Author contact
![]() Corresponding authors: Professor Kuo-Chin Huang, MD, PhD. Department of Family Medicine, National Taiwan University Hospital, Taipei, Taiwan. Address: 7 Chung-Shan South Road, Taipei, Taiwan 100. Tel: 886-2-23123456 ext. 66081; Fax: 886-2-23118674. E-mail: bretthuangedu.tw; Professor Chi-Chang Huang, Graduate Institute of Sports Science, National Taiwan Sport University, No. 250, Wenhua 1st Rd., Guishan Township, Taoyuan County 33301, Taiwan. Tel.: +886-2-2736-1661 (ext. 2270). E-mail: d301090007com; john5523edu.tw.
Corresponding authors: Professor Kuo-Chin Huang, MD, PhD. Department of Family Medicine, National Taiwan University Hospital, Taipei, Taiwan. Address: 7 Chung-Shan South Road, Taipei, Taiwan 100. Tel: 886-2-23123456 ext. 66081; Fax: 886-2-23118674. E-mail: bretthuangedu.tw; Professor Chi-Chang Huang, Graduate Institute of Sports Science, National Taiwan Sport University, No. 250, Wenhua 1st Rd., Guishan Township, Taoyuan County 33301, Taiwan. Tel.: +886-2-2736-1661 (ext. 2270). E-mail: d301090007com; john5523edu.tw.