Impact Factor ISSN: 1449-1907

 Global reach, higher impact
Int J Med Sci 2020; 17(17):2653-2662. doi:10.7150/ijms.51159 This issue Cite
Research Paper
Temporal changes of CT findings between non-severe and severe cases of COVID-19 pneumonia: a multi-center, retrospective, longitudinal Study
Meng Dai1,2#, Xiaoming Liu1,2#, Xiqi Zhu3, Tiejun Liu4, Cihao Xu1,2, Fang Ye5, Lian Yang1,2, Yu Zhang1,2 ![]()
1. Department of Radiology, Union Hospital, Tongji Medical College, Huazhong University of Science and Technology, Wuhan, Hubei, China.
2. Hubei Province Key Laboratory of Molecular Imaging, Wuhan, Hubei, China.
3. Department of Radiology, Nanxishan Hospital, Guangxi Zhuang Autonomous Region, No. 46 Chongxin Road, Guilin 541002 Guangxi, People's Republic of China.
4. Department of Radiology, Liuzhou People's Hospital, No. 8, Wenchang Road, Liuzhou 545006, Guangxi, People's Republic of China.
5. Department of Occupational and Environmental Health and Ministry of Education Key Lab for Environment and Health, School of Public Health, Tongji Medical College, Huazhong University of Science and Technology, Wuhan, Hubei, China.
#These authors contributed equally to this work.
Received 2020-7-27; Accepted 2020-8-30; Published 2020-9-21
Abstract
Background and aim: To perform a longitudinal analysis of serial CT findings over time in patients with COVID-19 pneumonia.
Methods: From February 5 to March 8, 2020, 73 patients (male to female, ratio of 43:30; mean age, 51 years) with COVID-19 pneumonia were retrospectively enrolled and followed up until discharge from three institutions in China. The patients were divided into the severe and non-severe groups according to treatment option. The patterns and distribution of lung abnormalities, total CT scores, single ground-glass opacity (GGO) CT scores, single consolidation CT scores, single reticular CT scores and the amounts of zones involved were reviewed by 2 radiologists. These features were analyzed for temporal changes.
Results: In non-severe group, total CT scores (median, 9.5) and the amounts of zones involved were slowly increased and peaked in disease week 2. In the severe group, the increase was faster, with scores also peaking at 2 weeks (median, 20). In both groups, the later parameters began to decrease in week 4 (median values of 9 and 19 in the non-severe and severe groups, respectively). In the severe group, the dominant residual lung lesions were reticular (median single reticular CT score, 10) and consolidation (median single consolidation CT score, 7). In the non-severe group, the dominant residual lung lesions were GGO (median single GGO CT score, 7) and reticular (median single reticular CT score, 4). In both non-severe and severe groups, the GGO pattern was dominant in week 1, with a higher proportion in the severe group compared with the non-severe group (72% vs. 65%). The consolidation pattern peaked in week 2, with 9 (32%) and 19 (73%) in the non-severe and severe groups, respectively; the reticular pattern became dominant from week 4 (both group >40%).
Conclusion: The extent of CT abnormalities in the severe and non-severe groups peaked in disease week 2. The temporal changes of CT manifestations followed a specific pattern, which might indicate disease progression and recovery.
Keywords: COVID-19, CT score, Ground-glass opacity, CT abnormalities, non-severe, severe
Introduction
In late December 2019, an outbreak of Coronavirus disease-19 (COVID-19) occurred in Wuhan, Hubei Province, China [1-6]. Currently, this infection has been detected all over the world. On July 14, 2020, the global number of confirmed COVID-19 cases surpassed 12,964,809 [7]. On February 11, 2020, a novel coronavirus was identified by the Chinese Center for Disease Control and Prevention (CDC) from Chinese patients with pneumonia [2], which was named severe acute respiratory syndrome coronavirus 2 (SARS-CoV-2) by WHO [8], which formed a clade within the subgenus sarbecovirus in the orthocoronavirinae subfamily [2].
Patients with SARS-CoV-2 infection typically present with fever, cough and dyspnea [5,6]. Most patients with COVID-19 have mild symptoms, whereas a few develop severe pneumonia, pulmonary edema, acute respiratory distress syndrome (ARDS), and/or multiple organ failure (MOF), or even die, similar to individuals with severe acute respiratory syndrome (SARS) and Middle East respiratory syndrome (MERS) [4, 9, 10].
Chest CT examination plays an important role in the diagnosis and management of COVID-19 pneumonia [11-16]. Reports also indicated that patients with highly suspected SARS-CoV-2 infection have negative results in the initial real time reverse transcription-polymerase chain-reaction (RT-PCR) test, but positive findings on CT images [17-19].
Previous studies demonstrated CT findings to be diverse [20, 21]; however, CT abnormalities between non-severe and severe COVID-19 pneumonia cases have not been well investigated. A better understanding of the progression of CT findings in COVID-19 pneumonia may help achieve accurate diagnosis and disease staging. Thus, this longitudinal study was performed to analyze serial CT findings between non-severe and severe COVID-19 pneumonia cases.
Materials and Methods
Patients
This retrospective study was approved by our Institutional Ethics Committee. Patient data were collected from 3 hospitals in China from Feb 5 to Mar 8, 2020. A total of 73 patients with definite COVID-19 were enrolled, including 43 males and 30 females, aged 26 to 85 years (51 ± 13 years). The diagnosis of COVID-19 was made in accordance with the Guidelines for the Diagnosis, Discharge and Treatment Criteria of New Coronavirus Pneumonia (sixth edition) [22] formulated by the National Health Commission of the People's Republic of China.
Inclusion criteria were: (1) at least two CT examinations; (2) discharged from one of the 3 hospitals by the censored date (Mar 08, 2020); (3) 1.5-2.0 mm thickness thin-section images, no artifacts affecting diagnosis. Exclusion criteria were: (1) only one CT examination, (2) severe image artifacts due to poor respiratory cooperation.
Discharge Criteria were specified as: (1) absence of fever for at least 3 days; (2) substantial improvement in both lungs upon chest CT, clinical remission of respiratory symptoms; (3) two negative results of throat-swab tests for SARS-CoV-2 RNA at an interval of at least 24 h.
CT scans were categorized according to the time duration between symptom onset and CT images acquisition, i.e., 1, 2, 3, 4, and over 4 weeks after symptom onset.
Clinical typing and images grouping
Disease severity was classified into 4 categories according to the Guidelines for the Diagnosis and Treatment of New Coronavirus Pneumonia (sixth edition): (1) mild type, mild clinical symptoms and no pulmonary changes on CT images; (2) common type, fever and signs of respiratory infection, with pneumonia changes on CT images; (3) severe type, any of the items including respiratory distress (respiratory rate ≥ 30/min), finger oxygen saturation ≤ 93% in the resting state, arterial partial pressure of oxygen (PaO2) /oxygen concentration (FiO2) ≤ 300 mmHg (1 mmHg = 0.133 kPa) and critical type (respiratory failure requiring mechanical ventilation, shock or ICU admission requirement due to multiple organ failure).
To analyze the serial CT images, 73 patients were re-grouped into non-severe (mild and common type) and severe (severe and critical type) groups according to treatment criteria. Among the re-grouped patients, 47 (mean age, 49 ± 12 years) were recruited into the non-severe group, while 26 (mean age, 55 ±15 years) were enrolled in the severe group.
CT Protocol
High-resolution CT scans were performed in all patients with commercial multi-detector CT scanners at the single inspiratory phase (uCT550, Shanghai United Imaging Healthcare, Shanghai, China; Aquilion 16-slice, TOSHIBA Medical Systems; Tochigi, Japan; NeuViz 64in, Shengyang Neusoft medical system, Hunan, China; Somatom Definition AS, Siemens, Nurnberg,Germany; Brilliance 64, Phillips Medical System, Eindhoven, the Netherlands). CT images were acquired under the following conditions: tube voltage 120 kVp; pitch, 1.075; collimator widths of 64×0.6 mm, 128×0.6 mm, 64×0.6 mm, and 40×0.55 mm. They were reconstructed based on the raw data with a matrix size of 512×512 as axial images (thickness, 1.5 or 2 mm; increment, 1.5 or 2 mm) in the transverse slice direction. All images were acquired with the lung (window width, 1,000~1,500 HU; window level, -700 HU) and mediastinal (window width, 350 HU; window level, 35~40 HU) settings.
Chest CT Evaluation
All images were independently assessed by 2 senior radiology specialists (M.D. and Y.Z., with 7and 5 years of experience in interpreting chest CT findings, respectively) using the institutional digital database system (Vue PACS, version 11.3.5.8902, Carestream Health, Canada). The location, shape, number and size of the abnormalities on chest CT images were carefully observed and recorded. Decisions were reached by consensus in case of disagreement between the two radiologists.
Table 1 illustrates all CT imaging features extracted from each CT scan of the study cohort [16, 23-26].
CT imaging features of patients with COVID-19
| CT Characteristics | Definition |
|---|---|
| Lobe involvement | Categorized as right upper, right middle, right lower, left upper and left lower lobe involvement |
| The lung segment involved | Each lung segment was reviewed for GGO, consolidation and reticular types, respectively |
| Lung involvement | Categorized as unilateral or bilateral lung involvement |
| Lesion location | Central, lesion located in the interior two-thirds of the lung; peripheral, located in the outer one-third of the lung; Both central and peripheral. |
| Extent of lesion involvement | Categorized as focal, multifocal, diffuse |
| Predominantly distribution of opacities | Septal/sub-pleural, involving mainly the sub-peripheral one-third of the lung; peri-bronchovasular, surrounding mainly the peri-bronchovascular bundle; random, without predilection for sub-pleural or peri-bronchovascular regions. |
| Predominantly CT pattern | GGO pattern, an area of hazy increased lung opacity, within which margins of pulmonary vessels may be indistinct; consolidation pattern, a homogeneous increase in pulmonary parenchymal attenuation that obscures the margins of vessels and airway walls; reticular pattern, a descriptive term usually associated with interstitial lung diseases; mixed pattern, combination of GGO, consolidation, and reticulation. |
| Interlobular septal thickening | Smooth or irregular |
| Pleural effusion | Fluid in the pleural cavity |
| Lymphadenopathy | Arbitrary thresholds for the upper limit of normal of 1 cm in short-axis diameters of mediastinal nodes. |
A semi-quantitative analysis was performed to quantify disease severity [11, 27]. For each lung lobe, a total CT score representing the extent of lung involvement [ground-glass opacity (GGO), consolidation and reticular types 65%] was visually rated from 0 to 5: 0, none; 1, <5% lobe involvement; 2, 5%-25% lobe involvement; 3, 26%-49% lobe involvement; 4, 50%-75% lobe involvement; and 5, >75% lobe involvement. Single GGO, single consolidation, and single reticular CT scores were evaluated, respectively, according to the criteria described above.
Statistical analysis
Illness day 0 was defined as the day of initial symptom onset. Median total, single GGO, single consolidation and single reticular CT scores were plotted as a function of time, as well as the amounts of zones involved. The temporal changes of main CT patterns, ground-glass opacity subtypes, and the distribution of lung abnormalities were also analyzed. The Kruskal Wallis rank-sum test was performed to compare CT lung quantification in different periods. The Chi-square test was applied to compare the frequency of CT patterns in different periods. P < 0.05 was considered statistically significant. Statistical analyses were performed with the R software (version 3.6.2, the R Foundation for Statistical Computing, Vienna, Austria).
Results
Patient characteristics
Totally 73 patients were enrolled in this study. They included 47 non-severe (32 males and 15 females, aged 49±12 years) and 26 were severe (11 males and 15 females, aged 55±15 years) cases. Among the non-severe cases, 68% were male, while 58% of severe cases were female. As for concurrent underlying diseases (Table 2), 56% of patients had different underlying diseases, among which hypertension (29%) and fatty liver (18%) were dominant. In the severe group, 61% of patients had non-pulmonary underlying diseases, versus 41% in the non-severe group. Fever (86%), cough (62%), and dyspnea (56%) were the most common symptoms. Over 70% of severe cases had cough and dyspnea, and diarrhea (26%) and anorexia (58%) cases were more abundant compared with the non-severe group. The time from initial symptom onset to positive nucleic acid RT-PCR was shorter in the severe group compared with the non-severe group, meanwhile, the time between two successive negative nucleic acid tests was more prolonged versus the non-severe group. In addition, the imaging peak time from initial symptom onset in the non-severe and severe groups occurred in the second week (Table 2).
Clinical characteristics of patients with COVID-19
| Characteristics | All patients (n=73) | Non-severe (n=47) | Severe (n=26) |
|---|---|---|---|
| Age, year | 51±13 | 49±12 | 55±15 |
| Sex | |||
| Men | 43 (59%) | 32 (68%) | 11 (42%) |
| Women | 30 (41%) | 15 (32%) | 15 (58%) |
| Any comorbidity | 41 (56%) | 24 (51%) | 17 (65%) |
| Diabetes | 8 (11%) | 4 (9%) | 4 (15%) |
| Hypertension | 21 (29%) | 13 (28%) | 8 (31%) |
| Cardiovascular disease | 7 (10%) | 5 (11%) | 2 (8%) |
| COPD | 3 (4%) | 2 (4%) | 1 (4%) |
| Tuberculosis | 3 (4%) | 3 (6%) | 0 |
| Fatty liver | 13 (18%) | 11 (23%) | 2 (8%) |
| Hepatitis B | 10 (14%) | 6 (13%) | 4 (15%) |
| Signs and symptoms | |||
| Fever | 64 (86%) | 41 (87%) | 23 (88%) |
| Highest temperature, °C | |||
| <37.3 | 9 (12%) | 6 (13%) | 3 (12%) |
| 37.3-38 | 13 (18%) | 10 (21%) | 3 (12%) |
| 38.1-39 | 38 (52%) | 23 (49%) | 15 (58%) |
| >39 | 13 (18%) | 8 (17%) | 5 (19%) |
| Cough | 45 (62%) | 26 (55%) | 19 (73%) |
| Chest tightness | 41 (56%) | 21 (54%) | 20 (77%) |
| Diarrhea | 13 (18%) | 12 (26%) | 1 (4%) |
| Anorexia | 28 (38%) | 27 (58%) | 1 (4%) |
| Headache | 5 (7%) | 1 (2%) | 4 (15%) |
| Myalgia and fatigue | 27 (37%) | 18 (38%) | 9 (35%) |
| Time of hospitalization | 24 (12) | 21 (8) | 32 (10) |
| Time from symptoms to image peak | 11 (3) | 12 (10) | 11 (3) |
| Time from symptoms to PCR positive test | 7 (7) | 9 (7) | 3 (4) |
| Time from symptoms to PCR negative test | 33 (11) | 29 (12) | 37 (10) |
Age is mean±SD; time of Hospitalization, time from symptoms to image peak, time from symptoms to PCR positive test, and time from symptoms to PCR negative test were presented as median (IQR); the remaining data were presented as n (n/N%), where N is the total number of patients with available data.
CT imaging manifestations
In the non-severe group, bilateral lower lobe involvements were more common and the involvement of the middle lobe of the right lung accounted for the lowest proportion among the 5 lung lobes. In the severe group, over 95% of patients had simultaneous involvement of 5 lung lobes within the initial 4 weeks of the disease course; this proportion was over 90% after 4 weeks.
In the non-severe group, over 85% of patients had a trend of bilateral lung involvement, while in the severe group, obvious bilateral lung involvement was observed within 1-week after disease onset.
In the non-severe and severe groups, disease site and scope were dominated by the central and peripheral and diffuse types, without predilection for sub-pleural or peri-bronchovascular regions (Table 3).
CT features of patients with COVID-19
| Characteristics | Non-severe | Severe | ||||||||
|---|---|---|---|---|---|---|---|---|---|---|
| 1 week (n=31) | 2 weeks (n=28) | 3 weeks (n=25) | 4 weeks (n=23) | >4 weeks (n=17) | 1 week (n=25) | 2 weeks (n=26) | 3 weeks (n=21) | 4 weeks (n=22) | >4 weeks (n=13) | |
| Lobe | ||||||||||
| Left upper lobe | 23 (74%) | 20 (71%) | 23 (92%) | 18 (78%) | 15 (88%) | 24 (96%) | 25 (96%) | 21 (100%) | 22 (100%) | 12 (92%) |
| Left lower lobe | 26 (84%) | 26 (93%) | 24 (96%) | 21 (91%) | 17 (100%) | 24 (96%) | 26 (100%) | 21 (100%) | 22 (100%) | 13 (100%) |
| Right upper lobe | 20 (66%) | 20 (71%) | 22 (88%) | 19 (83%) | 15 (88%) | 24 (96%) | 26 (100%) | 21 (100%) | 22 (100%) | 13 (100%) |
| Right middle lobe | 15 (48%) | 18 (64%) | 19 (76%) | 14 (61%) | 11 (65%) | 25 (100%) | 26 (100%) | 21 (100%) | 22 (100%) | 13 (100%) |
| Right lower lobe | 29 (94%) | 25 (89%) | 24 (96%) | 21 (91%) | 17 (100%) | 24 (96%) | 26 (100%) | 21 (100%) | 22 (100%) | 13 (100%) |
| Lung involvement | ||||||||||
| Unilateral | 4 (13%) | 4 (14%) | 1 (4%) | 3 (13%) | 0 | 0 | 0 | 0 | 0 | 0 |
| Bilateral | 27 (87%) | 24 (86%) | 24 (96%) | 20 (87%) | 17 (100%) | 25 (100%) | 26 (100%) | 21 (100%) | 22 (100%) | 13 (100%) |
| Lesion location | ||||||||||
| Central | 0 | 0 | 0 | 0 | 0 | 2 (8%) | 0 | 0 | 0 | 0 |
| Peripheral | 10 (32%) | 7 (25%) | 6 (24%) | 5 (22%) | 3 (18%) | 4 (16%) | 1 (4%) | 0 | 1 (5%) | 1 (8%) |
| Both central and peripheral | 21 (68%) | 21 (75%) | 19 (76%) | 17 (74%) | 14 (82%) | 19 (76%) | 25 (96%) | 21 (100%) | 21 (95%) | 12 (92%) |
| Extent of lesion involvement | ||||||||||
| Focal | 3 (10%) | 2 (7%) | 1 (4%) | 3 (13%) | 1 (6%) | 0 | 0 | 0 | 0 | 0 |
| Multifocal | 12 (39%) | 4 (14%) | 2 (8%) | 2 (9%) | 3 (18%) | 11 (44%) | 2 (8%) | 4 (19%) | 5 (23%) | 5 (38%) |
| Diffuse | 16 (52%) | 22 (79%) | 22 (88%) | 18 (78%) | 13 (76%) | 14 (56%) | 24 (86%) | 17 (81%) | 17 (77%) | 8 (62%) |
| Predominant distribution of opacities | ||||||||||
| Septal/sub-pleural | 9 (29%) | 7 (25%) | 6 (24%) | 6 (26%) | 3 (18%) | 2 (8%) | 1 (4%) | 1 (5%) | 0 | 0 |
| Peri-bronchovascular | 8 (26%) | 2 (7%) | 0 | 2 (9%) | 3 (18%) | 10 (40%) | 6 (23%) | 3 (14%) | 10 (45%) | 4 (31%) |
| Random | 14 (45%) | 19 (68%) | 19 (76%) | 15 (65%) | 11 (65%) | 13 (52%) | 18 (69%) | 17 (81%) | 12 (55%) | 9 (69%) |
| Predominant CT pattern | ||||||||||
| Ground glass opacity pattern | 20 (65%) | 8 (29%) | 6 (24%) | 7 (30%) | 4 (24%) | 18 (72%) | 4 (15%) | 0 | 0 | 2 (15%) |
| Consolidation pattern | 6 (19%) | 9 (32%) | 5 (20%) | 1 (4%) | 0 | 3 (12%) | 19 (73%) | 7 (33%) | 4 (18%) | 0 |
| Reticular pattern | 0 | 2 (7%) | 5 (20%) | 12 (53%) | 12 (70%) | 0 | 0 | 3 (14%) | 11 (50%) | 6 (46%) |
| Mixed pattern | 5 (16%) | 9 (32%) | 9 (36%) | 3 (13%) | 1 (6%) | 4 (16%) | 3 (12%) | 11 (53%) | 7 (32%) | 5 (39%) |
| Ground glass opacity | ||||||||||
| Number of involved segments | 5 (7) | 5 (9) | 8 (7) | 6 (8) | 7 (12) | 15 (4) | 7 (6) | 5 (4) | 3 (4) | 2 (4) |
| Single ground glass opacity CT score | 5 (5) | 5.5 (7.3) | 6.5 (6) | 7 (7) | 7 (5) | 12 (7) | 6 (3) | 3 (2) | 1 (1) | 1 (2) |
| Consolidation | ||||||||||
| Number of involved segments | 2 (6) | 4 (5) | 1 (7) | 0 (1) | 0 (0) | 4 (4) | 9 (6) | 7 (5) | 5 (6) | 6 (5) |
| Single consolidation CT score | 2 (5) | 3.5 (6) | 2 (5.8) | 0 (1) | 0 (0) | 3 (2) | 13.5 (6.8) | 9 (4) | 8 (5) | 7 (6) |
| Reticular | ||||||||||
| Number of involved segments | 0 (0) | 0 (1) | 1 (5) | 3 (7) | 4 (7) | 0 | 1 (5) | 5 (6) | 7 (8) | 8 (5) |
| Single reticular CT score | 0 (0) | 0 (1.3) | 1.5 (5) | 2 (6) | 4 (4) | 0 (0) | 0 (2) | 8 (2) | 9 (2.8) | 10 (2) |
| Total CT score | 7 (7.5) | 9.5 (8.5) | 10 (6) | 9 (7) | 9 (11) | 15 (7) | 20 (2.8) | 20 (4) | 19 (6.5) | 18 (2) |
| Pure ground-glass opacity | 22 (71%) | 13 (46%) | 10 (40%) | 8 (35%) | 7 (41%) | 11 (44%) | 2 (8%) | 1 (5%) | 1 (5%) | 1 (8%) |
| Ground-glass opacity plus Interlobular septal thickening | 8 (26%) | 4 (14%) | 1 (4%) | 0 | 0 | 21 (84%) | 14 (54%) | 4 (19%) | 0 | 0 |
| Ground-glass opacity plus irregular line | 12 (39%) | 13 (46%) | 16 (64%) | 12 (52%) | 8 (47%) | 3 (12%) | 6 (23%) | 18 (86%) | 8 (36%) | 4 (31%) |
| Reticular | 1 (3%) | 4 (14%) | 11 (44%) | 12 (52%) | 11 (65%) | 0 (0%) | 1 (4%) | 13 (62%) | 22 (100%) | 12 (92%) |
| Fibrotic changes | 3 (10%) | 12 (43%) | 16 (64%) | 13 (57%) | 14 (82%) | 1 (4%) | 2 (8%) | 12 (57%) | 21 (95%) | 13 (100%) |
| Consolidation | 18 (58%) | 17 (61%) | 14 (56%) | 5 (22%) | 4 (24%) | 4 (16%) | 19 (73%) | 17 (81%) | 20 (91%) | 8 (62%) |
| Traction bronchiectasis | 0 | 0 | 1 (4%) | 2 (9%) | 2 (12%) | 2 (8%) | 4 (15%) | 3 (14%) | 9 (41%) | 7 (54%) |
| Pleural effusion | 0 | 0 | 0 | 0 | 0 | 2 (8%) | 4 (15%) | 3 (14%) | 1 (5%) | 0 |
The number of involved segments, and single ground glass opacity, single consolidation, single reticular and total CT scores were presented as median (IQR), the remaining data were presented as n (n/N%), where N is the total number of patients with available data.
CT scores
In the non-severe group, the disease slowly worsened within the first two weeks; the median total CT score was increased from 7 (range: 0-18) points in the first week to a peak of 9.5 (range: 1-24) points in the second week, but began to decline in the 4th week to reach 9 (range: 2-19) points (Fig. 1A). Such a result revealed the presence of residual lesions at the late disease stage. Differences in total CT scores in the non-severe group at different time periods were not statistically significant (P=0.435). In the severe group, the disease peaked in the 2nd week rapidly with a median total CT score as high as 20 (range: 8-25) points. In the 3rd week, the median total CT score in the severe group remained at the peak value (20; range: 7-25 points), and it began to decline slowly in the 4th week to 18 (range: 12-22) points after 4 weeks. Differences in the total CT scores in the severe group at different time periods were statistically significant (P=0.000). The median total CT score in the severe group at each time point was higher than the corresponding values for the non-severe group (P=0.000), suggesting the presence of obviously greater residual lung lesions in severe cases compared with the non-severe group.
(a) Temporal changes of median total CT scores in the non-severe and severe groups both peaked in the 2nd week, with the severe showing significantly higher values than the non-severe group (P=0.000). (b) Temporal changes of median single GGO CT scores, with the severe group showing a downward trend (P=0.000). (c) Temporal changes of median single consolidation CT scores, with the non-severe and severe groups both peaking in the 2nd week, and the severe group showing significantly higher values (P=0.000). (d) Temporal changes of median single reticular CT score, with the non-severe and severe groups both peaking after 4 weeks; both the severe (P=0.000) and non-severe (P=0.000) groups showed an upward trend.
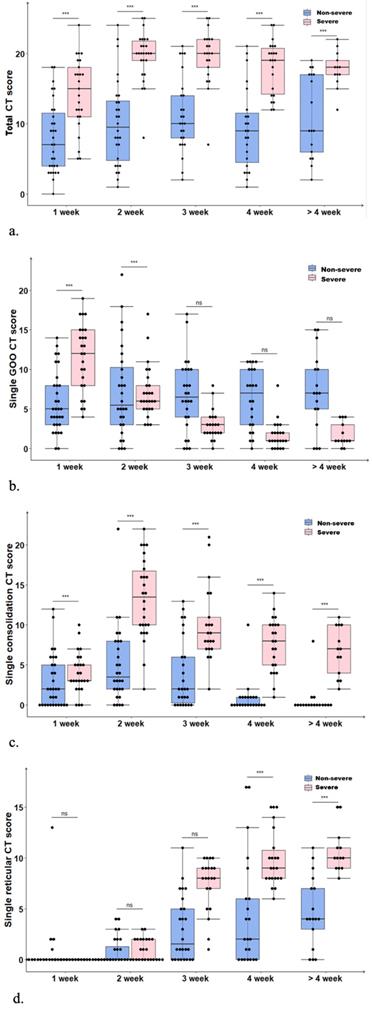
In the non-severe group, single GGO CT scores showed no statistically significant differences among various time periods of the disease course (P=0.204); in the severe group, the median single GGO CT score gradually decreased from 12 (range: 4-19) points in the first week to 1 (range: 0-4) point after 4 weeks (Fig. 1B), indicating statistically significant differences among various time periods (P=0.000). In the non-severe and severe groups, median single consolidation CT scores peaked in the second week, with 4 and 14 points, respectively; the lowest scores in the above two groups were obtained after 4 weeks, i.e., 0 and 7 points, respectively (Fig. 1C). Differences in single consolidation CT scores at different time periods were statistically significant in the non-severe group (P=0.000); the median single consolidation CT score at each time point was higher in the severe group compared with the non-severe group (P=0.000). In the non-severe and severe groups, median single reticular CT scores were low in the first two weeks, gradually elevated from the second week, and peaked after 4 weeks (4 and 10 points in the non-severe and severe groups, respectively) (Fig. 1D). Differences in single reticular CT scores at different time periods in non-severe (P=0.000) and severe (P=0.000) cases were statistically significant, and scores were remarkably higher in the severe group compared with the non-severe group after 3 weeks. In severe cases, the residual lung lesions were mostly of reticular and consolidation types, with reticular ones being more common. By contrast, most residual lung lesions in the non-severe group were GGO and reticular, with GGO being more common.
Predominant CT patterns
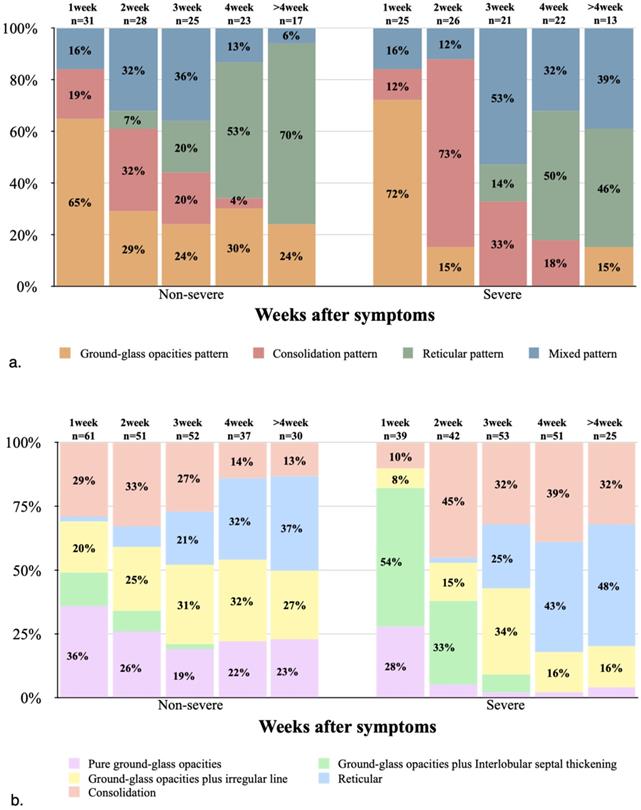
In both non-severe and severe groups, the GGO pattern was dominant in the first week, with the severe group showing a higher proportion compared with non-severe cases (18 [72%] and 20 [65%], respectively). Thereafter, the GGO pattern began to decrease substantially, and almost no GGO pattern was observed in the middle and late stages of the disease course in severe cases. In the non-severe and severe groups, the consolidation pattern peaked in the second week, with 9 (32%) and 19 (73%) cases, respectively, indicating an apparently higher proportion in the severe group compared with non-severe cases. Later, the consolidation pattern gradually decreased, and was almost no detectable in both groups after 4 weeks. In the non-severe and severe groups, the reticular pattern began in the second and third weeks, respectively, notably increased thereafter, and became dominant from 4 weeks (both over 40%, Figs. 2A, 3 & 4).
(a) Stacked-bar graph showing temporal changes of the predominant CT patterns in the non-severe and severe groups at various time points from the onset of symptoms. (b) Stacked-bar graph showing the amounts of positive CT features in the non-severe and severe groups at various time points from the onset of symptoms.
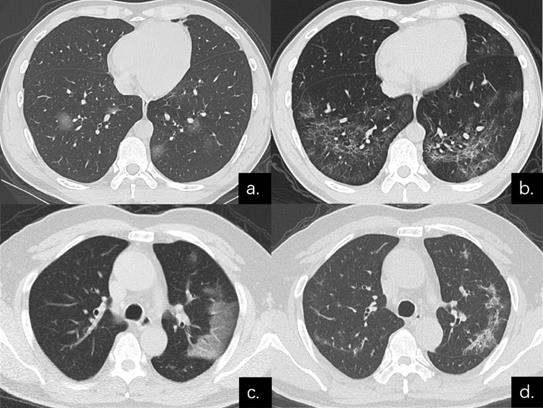
Series CT scans in a 38-year-old man with COVID-19 pneumonia in the non-severe group. (a) Scan obtained on disease day 6 showed a predominant GGO pattern with multiple pure GGO in the lower lobes. (b) Scan obtained on day 31 showed a predominant reticular pattern with interlacing line shadows that suggest a mesh mainly in the lower lobes. Series CT scans in a 54-year-old man with COVID-19 pneumonia in the non-severe group. (c) Scan obtained on disease day 1 showed GGO in left upper lobe; predominant GGO pattern. (d) Scan obtained on day 27 showed a predominant reticular pattern with interlacing line shadows mainly in left upper lobe.
Positive CT features
In the first week of disease onset in the non-severe group, pure GGO accounted for the highest proportion (22/31, 71%), while in the severe group, GGO plus interlobular septal thickening was the most common type (21/25, 84%). In the non-severe and severe groups, the most common imaging sign in the second week of disease was consolidation, with 17 (61%) and 19 (73%) cases, respectively. In the severe group, pure GGO, GGO plus interlobular septal thickening, and GGO plus irregular line showed low proportions after 3 weeks, consistent with markedly decreased single GGO CT scores in the severe group after 3 weeks. In the non-severe group, reticular and fibrotic changes, and GGO plus irregular line were the most common signs from 4 weeks of disease onset, while reticular and fibrotic changes and consolidation were the most common in the severe group (Table 3; Figs. 2B & 4).
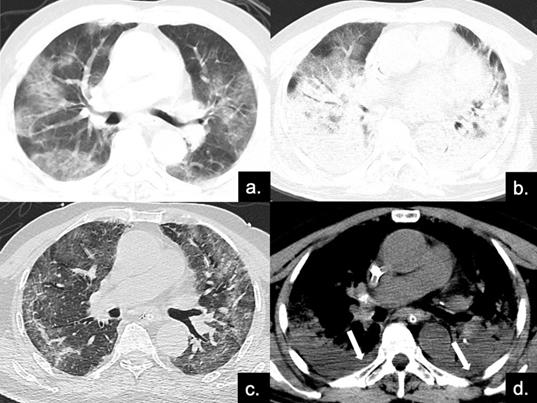
Series CT scans in an 85-year-old man with COVID-19 pneumonia in the severe group. (a) Scan obtained on disease day 4, showing patchy ground-glass opacities plus interlobular septal thickening (crazy paving). The Predominant CT pattern was of GGO type, with 12 as total CT score. (b, d) Scan obtained on day 10, the disease progressed rapidly to ARDS (PaO2 / FiO2 continued to decrease with a minimum of 85), and the patient was treated with ECMO. Figure b is the lung window, showing diffuse distribution of consolidation and bronchial meteorology in both lungs, mainly dorsal, while the crazy paving can also be seen on the ventral side. Figure d depicts the soft tissue window, and pleural effusion can be found under the dorsal pleura (red arrows). The predominant CT pattern was of consolidation type, with 25 as total CT score. (c) Scan obtained on day 40, lung lesions were further absorbed and reticular involvement was increased, accompanied by fibrotic changes. The predominantly CT sign was the reticular pattern, with 17 as total CT score.
Discussion
This study systemically described serial CT findings between non-severe and severe COVID-19 pneumonia cases. According to the above results, both non-severe and severe groups reached the disease peak in the second week after initial symptom onset, and disease scores were higher in the severe group. With disease development, imaging scores in the non-severe and severe groups declined to various degrees, but did not reach 0 point, revealing the presence of massive residual lesions after conversion to a negative nucleic acid test. In the non-severe group, the residual lesions were dominated by GGO and reticular types, while those in the severe group were mainly of consolidation and reticular types. Moreover, we also compared development patterns of non-severe and severe cases at different longitudinal time periods. To the best of our knowledge, this was the first comparative description of a longitudinal thin-section CT series between non-severe and severe patients with clinically and laboratory-confirmed COVID-19.
In the non-severe patient cohort, the disease peak was reached in the second week, corroborating previous findings [11, 12, 23]. Meanwhile, we also discovered that many lung lobes were involved in the third week, and maximal diffusion was attained at this moment (in 88% of cases). In the severe patient cohort, disease symptoms peaked in the second week, rapidly progressing from the first week to the second, similar to the development pattern of SARS [23]. The peaks in the non-severe and severe groups gradually declined thereafter, but still remained at high levels, which was consistent with previous literature [12, 23]. In addition, the SARS follow-up literature also suggested that among 24 patients discharged, 20 show residual lung lesions on chest X-ray films.
We next carried out a semi-quantitative analysis of different lesions, and examined the development trend in this longitudinal research, which has not been mentioned in previous studies. In the non-severe group, GGO remained in a high proportion, and residual lesions at late disease stage were mostly of GGO and reticular type. According to previous findings, GGO is reversible to a large extent [23, 28]. Therefore, we speculated that GGO occurrence at the late stage was a sign of disease improvement in non-severe cases, consistent with conclusions drawn from SARS. On the contrary, we demonstrated that GGO proportion was low at the middle and late stages in severe cases, with residual lesions mainly of reticular and consolidation types. A SARS follow-up research [29] indicated that elderly patients in the intensive care unit (ICU) are more likely to develop irreversible pulmonary fibrosis. In this study, median age was higher in the severe group compared with non-severe cases. Consequently, we speculated that severe cases are more likely to develop irreversible pulmonary fibrosis, which should be verified in future studies.
In the first week after initial symptom onset, CT imaging signs in non-severe and severe cases were dominated by the GGO pattern, non-severe cases mainly showed the GGO pattern, while the severe group mostly exhibited GGO accompanied by interlobular septal thickening. Typically, such imaging finding of GGO with or without interlobular septal thickening was similar to previously reported CT features of viral pneumonia induced by SARS and MERS [23, 30-32]. However, almost no GGO pattern was observed in the middle and late disease stages in severe cases. These studies also suggested that pure GGO, GGO plus interlobular septal thickening, and GGO plus irregular line account for less than 5% of all positive CT imaging signs, which might be related to more severe disease in the severe group. In the non-severe and severe groups, the consolidation pattern peaked in the second week, with 9 (32%) and 19 (73%) cases, respectively, indicating an overly higher proportion in the severe group compared with non-severe cases. Meanwhile, disease symptoms in the severe group peaked in the second week, revealing that the disease peak is strictly related to the consolidation pattern on lung CT images. At the late disease stage, the reticular pattern was dominant in the non-severe and severe groups; of all positive imaging signs, reticular and fibrotic changes had the highest proportions. The occurrence of reticular changes is usually accompanied by bronchiectasis and structural distortion [23], revealing the possibility of further development into pulmonary fibrosis [29].
This study had some limitations. Firstly, this was a retrospective multicenter study and the time of CT examination was uneven, which may bias CT feature description. Secondly, no pathological analysis was performed in the present study, making it impossible to evaluate the associations of CT features with pathological changes. Finally, a larger sample and longer follow-up are needed to better describe the development of this illness.
In conclusion, COVID-19 in the non-severe and severe groups peak in the second week, and massive residual lesions are found at the late disease stage. In the non-severe group, the residual lesions are dominated by the GGO and reticular type, while those of the severe group are mainly of reticular and consolidation type. The transiently distinct CT manifestations of severe and non-severe cases follow certain patterns at different time points of the disease course, which is related to disease severity, progression, and recovery.
Abbreviations
COVID-19: Corona virus disease 2019; SARS-CoV-2: Severe acute respiratory syndrome coronavirus 2; SARS: Severe acute respiratory syndrome; MERS: Middle East respiratory syndrome; GGO: Ground-glass opacity.
Acknowledgements
Authors' contributions
MD and XML carried out data curation, study conceptualization and manuscript writing. Yu Zhang was involved in conceptualization, methodology, manuscript review and study supervision. XQZ and TJL contributed to data curation and interpretation. CHX and FY participated in data curation. YZ and LY help draft the manuscript and revised its final version. All authors read and approved the final manuscript.
Ethics approval and consent to participate
This study was approved by the Ethics Committee of Wuhan Union Hospital of Huazhong University of Science and Technology.
Competing Interests
The authors have declared that no competing interest exists.
References
1. Li Q, Guan X, Wu P, Wang X, Zhou L, Tong Y, Ren R, Leung KSM, Lau EHY, Wong JY, Xing X, Xiang N, Wu Y, Li C, Chen Q, Li D, Liu T, Zhao J, Liu M, Tu W, Chen C, Jin L, Yang R, Wang Q, Zhou S, Wang R, Liu H, Luo Y, Liu Y, Shao G, Li H, Tao Z, Yang Y, Deng Z, Liu B, Ma Z, Zhang Y, Shi G, Lam TTY, Wu JT, Gao GF, Cowling BJ, Yang B, Leung GM, Feng Z. Early Transmission Dynamics in Wuhan, China, of Novel Coronavirus-Infected Pneumonia. The New England journal of medicine. 2020;382(13):1199-1207 doi: 10.1056/NEJMoa2001316
2. Zhu N, Zhang D, Wang W, Li X, Yang B, Song J, Zhao X, Huang B, Shi W, Lu R, Niu P, Zhan F, Ma X, Wang D, Xu W, Wu G, Gao GF, Tan W, China Novel Coronavirus I, Research T. A Novel Coronavirus from Patients with Pneumonia in China, 2019. The New England journal of medicine. 2020;382(8):727-733 doi: 10.1056/NEJMoa2001017
3. Huang C, Wang Y, Li X, Ren L, Zhao J, Hu Y, Zhang L, Fan G, Xu J, Gu X, Cheng Z, Yu T, Xia J, Wei Y, Wu W, Xie X, Yin W, Li H, Liu M, Xiao Y, Gao H, Guo L, Xie J, Wang G, Jiang R, Gao Z, Jin Q, Wang J, Cao B. Clinical features of patients infected with 2019 novel coronavirus in Wuhan, China. The Lancet. 2020;395(10223):497-506 doi: 10.1016/s0140-6736(20)30183-5
4. Chen N, Zhou M, Dong X, Qu J, Gong F, Han Y, Qiu Y, Wang J, Liu Y, Wei Y, Xia Ja, Yu T, Zhang X, Zhang L. Epidemiological and clinical characteristics of 99 cases of 2019 novel coronavirus pneumonia in Wuhan, China: a descriptive study. The Lancet. 2020;395(10223):507-513 doi: 10.1016/s0140-6736(20)30211-7
5. Wu F, Zhao S, Yu B, Chen Y-M, Wang W, Song Z-G, Hu Y, Tao Z-W, Tian J-H, Pei Y-Y, Yuan M-L, Zhang Y-L, Dai F-H, Liu Y, Wang Q-M, Zheng J-J, Xu L, Holmes EC, Zhang Y-Z. A new coronavirus associated with human respiratory disease in China. Nature. 2020;579(7798):265-269 doi: 10.1038/s41586-020-2008-3
6. Zhou P, Yang XL, Wang XG, Hu B, Zhang L, Zhang W, Si HR, Zhu Y, Li B, Huang CL, Chen HD, Chen J, Luo Y, Guo H, Jiang RD, Liu MQ, Chen Y, Shen XR, Wang X, Zheng XS, Zhao K, Chen QJ, Deng F, Liu LL, Yan B, Zhan FX, Wang YY, Xiao GF, Shi ZL. A pneumonia outbreak associated with a new coronavirus of probable bat origin. Nature. 2020;579(7798):270-273 doi: 10.1038/s41586-020-2012-7
7. World Health Organization. Coronavirus Disease 2019 (COVID-19) Situation Reports-176. https://www.who.int/emergencies/diseases/novel-coronavirus-2019/situation-reports
8. World Health Organization. https://www.who.int/zh/emergencies/diseases/novel-coronavirus-2019/technical-guidance/naming-the-coronavirus-disease-(covid-2019)-and-the-virus-that-causes-it
9. Yin Y, Wunderink RG. MERS, SARS and other coronaviruses as causes of pneumonia. Respirology. 2018;23(2):130-137 doi: 10.1111/resp.13196
10. Zaki AM, van Boheemen S, Bestebroer TM, Osterhaus ADME, Fouchier RAM. Isolation of a Novel Coronavirus from a Man with Pneumonia in Saudi Arabia. New England Journal of Medicine. 2012;367(19):1814-1820 doi: 10.1056/NEJMoa1211721
11. Pan F, Ye T, Sun P, Gui S, Liang B, Li L, Zheng D, Wang J, Hesketh RL, Yang L, Zheng C. Time Course of Lung Changes On Chest CT During Recovery From 2019 Novel Coronavirus (COVID-19) Pneumonia. Radiology. 2020 p: 200370. doi: 10.1148/radiol.2020200370
12. Wang Y, Dong C, Hu Y, Li C, Ren Q, Zhang X, Shi H, Zhou M. Temporal Changes of CT Findings in 90 Patients with COVID-19 Pneumonia: A Longitudinal Study. Radiology. 2020 p:200843. doi: 10.1148/radiol.2020200843
13. Bernheim A, Mei X, Huang M, Yang Y, Fayad ZA, Zhang N, Diao K, Lin B, Zhu X, Li K, Li S, Shan H, Jacobi A, Chung M. Chest CT Findings in Coronavirus Disease-19 (COVID-19): Relationship to Duration of Infection. Radiology. 2020 p:200463. doi: 10.1148/radiol.2020200463
14. Chung M, Bernheim A, Mei X, Zhang N, Huang M, Zeng X, Cui J, Xu W, Yang Y, Fayad ZA, Jacobi A, Li K, Li S, Shan H. CT Imaging Features of 2019 Novel Coronavirus (2019-nCoV). Radiology. 2020;295(1):202-207 doi: 10.1148/radiol.2020200230
15. Pan Y, Guan H. Imaging changes in patients with 2019-nCov. European radiology. 2020 doi: 10.1007/s00330-020-06713-z
16. Shi H, Han X, Jiang N, Cao Y, Alwalid O, Gu J, Fan Y, Zheng C. Radiological findings from 81 patients with COVID-19 pneumonia in Wuhan, China: a descriptive study. The Lancet Infectious diseases. 2020 doi: 10.1016/S1473-3099(20)30086-4
17. Xie X, Zhong Z, Zhao W, Zheng C, Wang F, Liu J. Chest CT for Typical 2019-nCoV Pneumonia: Relationship to Negative RT-PCR Testing. Radiology. 2020 p:200343. doi: 10.1148/radiol.2020200343
18. Fang Y, Zhang H, Xie J, Lin M, Ying L, Pang P, Ji W. Sensitivity of Chest CT for COVID-19: Comparison to RT-PCR. Radiology. 2020 p:200432. doi: 10.1148/radiol.2020200432
19. Huang P, Liu T, Huang L, Liu H, Lei M, Xu W, Hu X, Chen J, Liu B. Use of Chest CT in Combination with Negative RT-PCR Assay for the 2019 Novel Coronavirus but High Clinical Suspicion. Radiology. 2020;295(1):22-23 doi: 10.1148/radiol.2020200330
20. Zhao W, Zhong Z, Xie X, Yu Q, Liu J. Relation Between Chest CT Findings and Clinical Conditions of Coronavirus Disease (COVID-19) Pneumonia: A Multicenter Study. AJR American journal of roentgenology. 2020 p: 1-6. doi: 10.2214/AJR.20.22976
21. Xu YH, Dong JH, An WM, Lv XY, Yin XP, Zhang JZ, Dong L, Ma X, Zhang HJ, Gao BL. Clinical and computed tomographic imaging features of novel coronavirus pneumonia caused by SARS-CoV-2. The Journal of infection. 2020;80(4):394-400 doi: 10.1016/j.jinf.2020.02.017
22. National Health Commission of the People's Republic of China. The guidlines for the diagnosis and treatment of 2019-nCoV pneumonia (the 6th edition). http://www.nhc.gov.cn/xcs/zhengcwj/202002/8334a8326dd94d329df351d7da8aefc2.shtml
23. Ooi GC, Khong PL, Müller NL, Yiu WC, Zhou LJ, Ho JCM, Lam B, Nicolaou S, Tsang KWT. Severe Acute Respiratory Syndrome: Temporal Lung Changes at Thin-Section CT in 30 Patients. Radiology. 2004;230(3):836-844 doi: 10.1148/radiol.2303030853
24. Austin JH, Müller NL, Friedman PJ, Hansell DM, Naidich DP, Remy-Jardin M, Webb WR, Zerhouni EA. Glossary of terms for CT of the lungs: recommendations of the Nomenclature Committee of the Fleischner Society. Radiology. 1996;200(2):327-331 doi: 10.1148/radiology.200.2.8685321
25. Franquet T. Imaging of Pulmonary Viral Pneumonia. Radiology. 2011;260(1):18-39 doi: 10.1148/radiol.11092149
26. Hansell DM, Bankier AA, MacMahon H, McLoud TC, Müller NL, Remy J. Fleischner Society: glossary of terms for thoracic imaging. Radiology. 2008;246(3):697-722 doi:10.1148/radiol.2462070712
27. Chang Y-C, Yu C-J, Chang S-C, Galvin JR, Liu H-M, Hsiao C-H, Kuo P-H, Chen K-Y, Franks TJ, Huang K-M, Yang P-C. Pulmonary Sequelae in Convalescent Patients after Severe Acute Respiratory Syndrome: Evaluation with Thin-Section CT. Radiology. 2005;236(3):1067-1075 doi: 10.1148/radiol.2363040958
28. Remy-Jardin M, Giraud F, Remy J, Copin MC, Gosselin B, Duhamel A. Importance of ground-glass attenuation in chronic diffuse infiltrative lung disease: pathologic-CT correlation. Radiology. 1993;189(3):693-698 doi: 10.1148/radiology.189.3.8234692
29. Antonio GE, Wong KT, Hui DSC, Wu A, Lee N, Yuen EHY, Leung CB, Rainer TH, Cameron P, Chung SSC, Sung JJY, Ahuja AT. Thin-Section CT in Patients with Severe Acute Respiratory Syndrome Following Hospital Discharge: Preliminary Experience. Radiology. 2003;228(3):810-815 doi: 10.1148/radiol.2283030726
30. Antonio GE, Ooi CGC, Wong KT, Tsui ELH, Wong JSW, Sy ANL, Hui JYH, Chan CY, Huang HYH, Chan YF, Wong TP, Leong LLY, Chan JCK, Ahuja AT. Radiographic-Clinical Correlation in Severe Acute Respiratory Syndrome: Study of 1373 Patients in Hong Kong. Radiology. 2005;237(3):1081-1090 doi: 10.1148/radiol.2373041919
31. Das KM, Lee EY, Enani MA, AlJawder SE, Singh R, Bashir S, Al-Nakshbandi N, AlDossari K, Larsson SG. CT Correlation With Outcomes in 15 Patients With Acute Middle East Respiratory Syndrome Coronavirus. Ajr American Journal of Roentgenology. 2015;204(4):736-742
32. Ajlan AM, Ahyad RA, Jamjoom LG, Alharthy A, Madani TA. Middle East respiratory syndrome coronavirus (MERS-CoV) infection: chest CT findings. AJR American journal of roentgenology. 2014;203(4):782-787 doi: 10.2214/AJR.14.13021
Author contact
![]() Corresponding author: Yu Zhang, MD, Department of Radiology, The Union Hospital, Tongji Medical College, Huazhong University of Science and Technology, 1277# Jiefang Dadao Wuhan 430022, Hubei, People's Republic of China. Tel: +86 132 7709 9464; E-mail: zhangyu1988edu.cn.
Corresponding author: Yu Zhang, MD, Department of Radiology, The Union Hospital, Tongji Medical College, Huazhong University of Science and Technology, 1277# Jiefang Dadao Wuhan 430022, Hubei, People's Republic of China. Tel: +86 132 7709 9464; E-mail: zhangyu1988edu.cn.