Impact Factor ISSN: 1449-1907

 Global reach, higher impact
Int J Med Sci 2020; 17(3):280-291. doi:10.7150/ijms.37134 This issue Cite
Research Paper
Machine Learning in Prediction of Second Primary Cancer and Recurrence in Colorectal Cancer
Wen-Chien Ting1,2, Yen-Chiao Angel Lu3, Wei-Chi Ho4 ![]() , Chalong Cheewakriangkrai5, Horng-Rong Chang6,7
, Chalong Cheewakriangkrai5, Horng-Rong Chang6,7 ![]() , Chia-Ling Lin8
, Chia-Ling Lin8
1. Division of Colorectal Surgery, Department of Surgery, Chung Shan Medical University Hospital, Taiwan
2. Institute of Medicine, Chung Shan Medical University, Taiwan
3. School of Nursing, Chung-Shan Medical University, Taiwan
4. Department of Gastroenterology, Jen-Ai Hospital, Taichung, Taiwan
5. Division of Gynecologic Oncology, Department of Obstetrics and Gynecology, Faculty of Medicine, Chiang Mai University, Thailand
6. Division of Nephrology, Department of Internal medicine, Chung Shan Medical University Hospital, Taiwan
7. School of Medicine, Chung Shan Medical University
8. Department of Nutrition, Jen-Ai hospital, Taichung, Taiwan
Received 2019-9-11; Accepted 2019-10-3; Published 2020-1-15
Abstract
Background: Colorectal cancer (CRC) is the third commonly diagnosed cancer worldwide. Recurrence of CRC (Re) and onset of a second primary malignancy (SPM) are important indicators in treating CRC, but it is often difficult to predict the onset of a SPM. Therefore, we used mechanical learning to identify risk factors that affect Re and SPM.
Patient and Methods: CRC patients with cancer registry database at three medical centers were identified. All patients were classified based on Re or no recurrence (NRe) as well as SPM or no SPM (NSPM). Two classifiers, namely A Library for Support Vector Machines (LIBSVM) and Reduced Error Pruning Tree (REPTree), were applied to analyze the relationship between clinical features and Re and/or SPM category by constructing optimized models.
Results: When Re and SPM were evaluated separately, the accuracy of LIBSVM was 0.878 and that of REPTree was 0.622. When Re and SPM were evaluated in combination, the precision of models for SPM+Re, NSPM+Re, SPM+NRe, and NSPM+NRe was 0.878, 0.662, 0.774, and 0.778, respectively.
Conclusions: Machine learning can be used to rank factors affecting tumor Re and SPM. In clinical practice, routine checkups are necessary to ensure early detection of new tumors. The success of prediction and early detection may be enhanced in the future by applying “big data” analysis methods such as machine learning.
Keywords: colorectal cancer, second primary malignancy, machine learning
Introduction
Colorectal cancer (CRC) is the third most common cancer in the world and the fourth most common cause of death overall [1]. In Taiwan, CRC is the most common type of cancer, with crude incidence rate approximately 46.7 in colon cancer and 27.9 in rectal cancer per 100,000 populations [2]. The recurrence rate for late-stage CRC is relatively high, but the 5-year relative survival rate varies from 88.1% (stage I) to 65.8% (stage III) [3] worldwide.
Recurrence and second primary malignancies (SPMs) affect the survival of CRC patients. Numerous studies have documented increases in the incidence and recurrence of CRC as well as increases in second primary cancers, including lung, head, neck, and gastric cancer [4-6]. It has been suggested that second primary cancers may affect the recurrence of the primary cancer [7]; however, no conclusive data to this effect have been reported in CRC.
Early detection of tumor recurrence and SPMs is essential to improving health outcomes of cancer patients. To detect SPMs, valid and reliable prediction tools are necessary. Traditional statistical methods, such as the chi-square test, multiple linear regression test, ANOVA, and t-test, have been used, but this requires a rigorous research design and clear, explicit hypotheses. In addition, the calculations cannot be modified when parameters change without redesign.
In recent years, machine learning (ML) has emerged as an alternative to express parameters in disease treatment and outcome. ML is a process where an acceptable generalization is obtained by searching through an n-dimensional space for a given set of biological samples using different techniques and algorithms [8]. It has been applied extensively in biomedical research. The two main common types of ML methods are supervised learning and unsupervised learning. Supervised learning can be thought as a classification process, meaning the learning process categorizes the data into a finite set of classes. The expansion of computational tools that allow ML processes has been a key development in the analysis of histological data for CRC [9, 10]. In this approach, a computer is first 'trained' using a clinical CRC data set classified by a physician. The data include recurrent and non-recurrent cancer with related clinical factors. The ML method then uses this classification information to develop its own pattern-recognition criteria to identify recurrent tumors. Our research aims to analyze these clinical data using ML models to identify the recurrence of colorectal tumors as well as the occurrence of second primary cancers.
Methods
Dataset preparation
Our study used data accessed from the Cancer Registry in three medical centers. Individuals with ICD-09 codes 153~154 who were diagnosed with CRC between 2004 and 2012 and were 18 years or older at the time of diagnosis were selected for inclusion in the study. We used the cancer sequence number and the recurrence status of primary CRC as the target classification. Patients with CRC alone were selected first and identified using sequence number 1. Patients with an SPM in addition to primary CRC were identified using sequence number 2 and included in the analysis. All CRC patients were classified between 2004 and 2012 and the study is conducted as a time to event analysis.
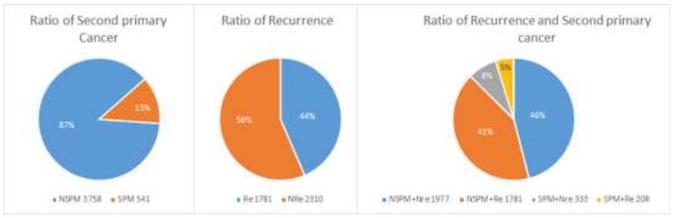
A total of 4299 patients with primary CRC were enrolled. As shown in Figure 1, 541 patients had at least one SPM (“SPM” group) and 3758 had no SPM (“NSPM”). In addition, 1989 patients had recurrent CRC (“Re” group) and 2310 had no recurrence (“NRe”). To evaluate both parameters, the total sample was divided into four groups (Figure 1): SPM+Re (208), NSPM+Re (1781), SPM+NRe (333), and NSPM+NRe (1977).
Second primary malignancies and recurrence of colorectal cancer (CRC) in the study population.
Features
Risk factors previously reported to be associated with CRC tumor recurrence and SPM include tumor size, morphology, differentiation [11], previous radiation therapy [12], and smoking [13]. Because a ranking of these factors was not found in the reported studies, we tried to rank risk factors based on data from the cancer registry using machine learning. We used correlation analysis to examine the following 20 features (risk factors): patient age, primary site, histology, behavior code, differentiation, tumor size, pathologic stage (pStage), surgical margins, surgical procedure, radiation therapy, pre-operative radiation therapy, regional body order, highest and lowest dose of radiotherapy, maximum and minimum times of radiotherapy, body mass index (BMI), smoking, areca consumption, and drinking. Those factors not only be the risk factor of CRC but also have important role in other cancer. Such as drinking, betel used, previous radiation therapy have contribution in hepatocellular cancer, oral cancer and lung cancer. We analyzed the relationships between these features and recurrence of CRC and/or occurrence of SPM.
Classifier
Support Vector Machines (SVMs) are supervised learning algorithms that can be used in binary classification problems and have been applied in many fields. SVMs maps feature vectors to a high-dimensional feature space, which classifies samples by searching for an optimal hyperplane and can divide the samples into different spatial areas. We uses LIBSVM (A Library for Support Vector Machines)[14] with the radial basis function kernel to construct predictive models and optimize the C and γ parameters of each model.
Reduced Error Pruning Tree (REPTree) uses regression tree logic and creates multiple trees in different iterations. After this process, the optimal (or representative) decision from all generated trees were identified. The mean squared error of the prediction was used to prune the tree. REPTree offers a fast decision tree learning method and builds a decision/regression tree based on information gain or by minimizing the variance. The information gain was used as the splitting criterion and the reduce-error pruning method was also applied to reduce the size of the decision trees. Values were sorted once for numeric attributes, and then, to improve accuracy, all subtrees were visited in a bottom-up manner until no subtrees were replaced with leaves.
Feature selection
We applied the feature selection tool developed by the LIBSVM (A Library for Support Vector Machines)[14] team to determine the discrimination of single vectors in different categories by the scoring of the F-test (F-score), and then ranked the significance of vectors by the F-score [15]. Given training vectors xk, where k = 1,…,m, if the number of positive and negative instances are n+ and n-, respectively, the F-score of the ith feature is defined as:
(1)
where  ,
,  ,
,  are the average of the ith feature of the whole, positive, and negative data sets, respectively;
  is the ith feature of the kth positive instance; and
  is the ith feature of the kth negative instance. The larger the F-score, the more likely this feature is discriminative. This score was used as a feature selection criterion.
System workflow
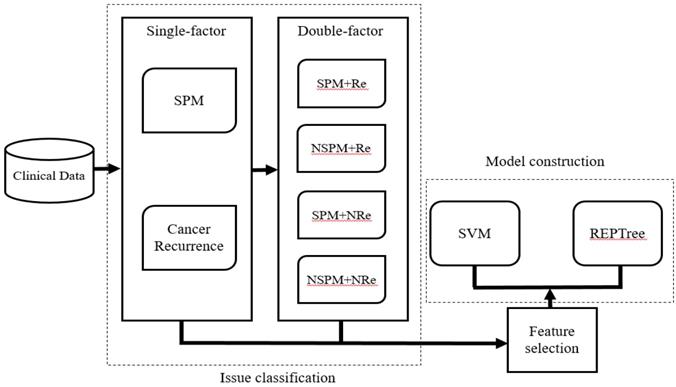
After selecting patients for inclusion and dividing them into the four classification groups, the significant ranking of the 20 features was analyzed using the LIBSVM feature selection mode of the training dataset. Then, based on the performance of the predictive model, we selected candidate features that could assist in classification of recurrence and SPM. The LIBSVM algorithm was used as the initial classifier for model construction. Although it is easy to achieve the best accuracy using LIBSVM, some SVM algorithms are complicated and difficult to understand. Therefore, Reduced Error Pruning Tree (REPTree) was applied to provide possible rules for auxiliary analysis. In the study, we choose [16]. In our initial analysis, we constructed separate models assessing the relationship between the 20 features and either SPM or recurrence of CRC. In the subsequence analysis, SPM and Re were analyzed together and four models (SPM+Re, NSPM+Re, SPM+NRe and NSPM+NRe) were built (Figure 2). We implemented the REPTree and SVM algorithms using WEKA [17, 18] and LIBSVM, and employed a 10-fold cross-validation to evaluate model performance.
Workflow for model construction from clinical data.
Evaluation
The predictive ability of each system was evaluated for accuracy (Acc), sensitivity (Sn), specificity (Sp), and the Matthews correlation coefficient (MCC), which were defined as follows:
(2)
(3)
(4)
(5)
Where TP, FP, FN, and TN represent true and false positives and negatives. Acc evaluates the prediction accuracy of positive and negative data, whereas Sn and Sp evaluate the accuracy of the prediction of positive and negative data, respectively. The values of these parameters range from 0 to 1. MCC is suitable for assessing the dataset for imbalance between positive and negative data and ranges from -1 to 1. The model performance is better when MCC is closer 1 and vice versa.
Results
Significant features by Re
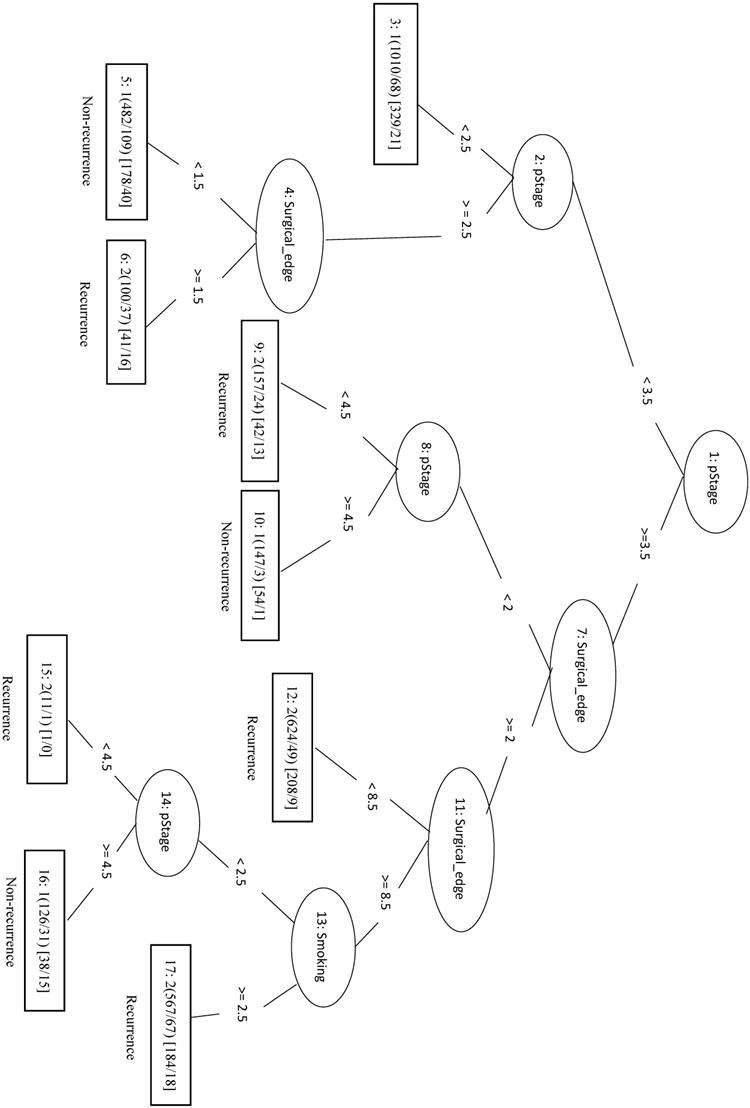
In this study, we identified 1989 out of 4299 total cases that had recurrent CRC (the Re group) and 2310 cases with no recurrence (the NRe group). Model evaluation data are shown in Table 1. The MCC of the initial LIBSVM model including all 20 features was 0.709. When only the top four features (pStage, surgical margin, smoking, and drinking) were included in the model (LIBSVM_4F), the MCC improved from 0.709 to 0.753 and the Acc improved from 0.856 to 0.877. Removing drinking from the analysis (LIBSVM_3F) increased the MCC, Sn, Sp, and Acc to 0.755, 0.891, 0.863, and 0.878, respectively. A similar increase was observed when compared REPTree classifier models involving either all 20 features or the same three selected features (pStage, surgical margin, and smoking). Using only the top three features (REPTree_3F), the Acc increased from 0.875 to 0.878 and the MCC increased from 0.748 to 0.754. The REPTree_3F model is shown in Figure 3.
Model evaluation for CRC recurrence alone.
| Classifier | TP | FP | TN | FN | Sn | Sp | Acc | MCC |
|---|---|---|---|---|---|---|---|---|
| LIBSVM | 2040 | 351 | 1638 | 270 | 0.883 | 0.824 | 0.856 | 0.709 |
| LIBSVM_4F | 2063 | 281 | 1708 | 247 | 0.893 | 0.859 | 0.877 | 0.753 |
| LIBSVM_3F | 2059 | 273 | 1716 | 251 | 0.891 | 0.863 | 0.878 | 0.755 |
| REPTree | 2035 | 263 | 1726 | 275 | 0.881 | 0.868 | 0.875 | 0.748 |
| REPTree_3F | 2070 | 286 | 1703 | 240 | 0.896 | 0.856 | 0.878 | 0.754 |
LIBSVM_3F, REPTree_3F, and LIBSVM_4F models were constructed using feature selection with the top three or four features, respectively.
Decision tree of important factors for recurrent CRC classification using the REPTree_3F model.
Significant features by SPM
In addition, we identified 541 cases with SPM and 3758 cases without SPM (NSPM). Because using two datasets with drastically different sizes (SPM/NSPM ratio = 1:6.95) can affect data quality and hinder models training process, we constructed models using three different ratios (1:1, 1:1.5, and 1:6.95) and compared their accuracy. Our results are shown in Table 2. Using the model at the 1:6.95 ratio, LIBSVM improved the accuracy compared to the REPTree classifier by adjusting the unbalanced parameters (LIBSVM - w1 1 - w2 10) and the Acc was 0.635 (Table 2).
Model evaluation for SPM alone.
| Ratio | Classifier | TP | FP | TN | FN | Sn | Sp | Acc | MCC |
|---|---|---|---|---|---|---|---|---|---|
| 1:6.95 | LIBSVM | 315 | 1345 | 2413 | 226 | 0.582 | 0.642 | 0.635 | 0.153 |
| 1:1.5 | LIBSVM | 173 | 89 | 723 | 368 | 0.320 | 0.890 | 0.662 | 0.261 |
| 1:1 | LIBSVM | 350 | 175 | 366 | 191 | 0.647 | 0.677 | 0.662 | 0.324 |
| 1:1 | LIBSVM_F | 363 | 188 | 353 | 178 | 0.671 | 0.652 | 0.662 | 0.324 |
| 1:1 | REPTree | 373 | 221 | 320 | 168 | 0.689 | 0.591 | 0.640 | 0.282 |
| 1:1 | REPTree_OP | 382 | 224 | 317 | 159 | 0.706 | 0.586 | 0.646 | 0.294 |
| 1:1 | REPTree_F | 363 | 240 | 301 | 178 | 0.671 | 0.556 | 0.614 | 0.229 |
LIMSVM_F and REPTree_F models were constructed using feature selection with the top eight features. REPTree_OP model was constructed [using parameter optimization OR as an optimized model] with the top three features.
To generate models using ratios of 1:1, the SPM patients were combined with 541 randomly selected patients from NSPM to form training dataset. Under the condition, the MCC of the LIBSVM model was 0.324 and the Sp and Sn were both greater than 0.6. The LIBSVM_F model, employing only the top eight features (behavior code, differentiation, regional body order, patient age, areca, surgery, radiation therapy, and lowest dose), had the equivalent performance outcome as the model using all 20 features.
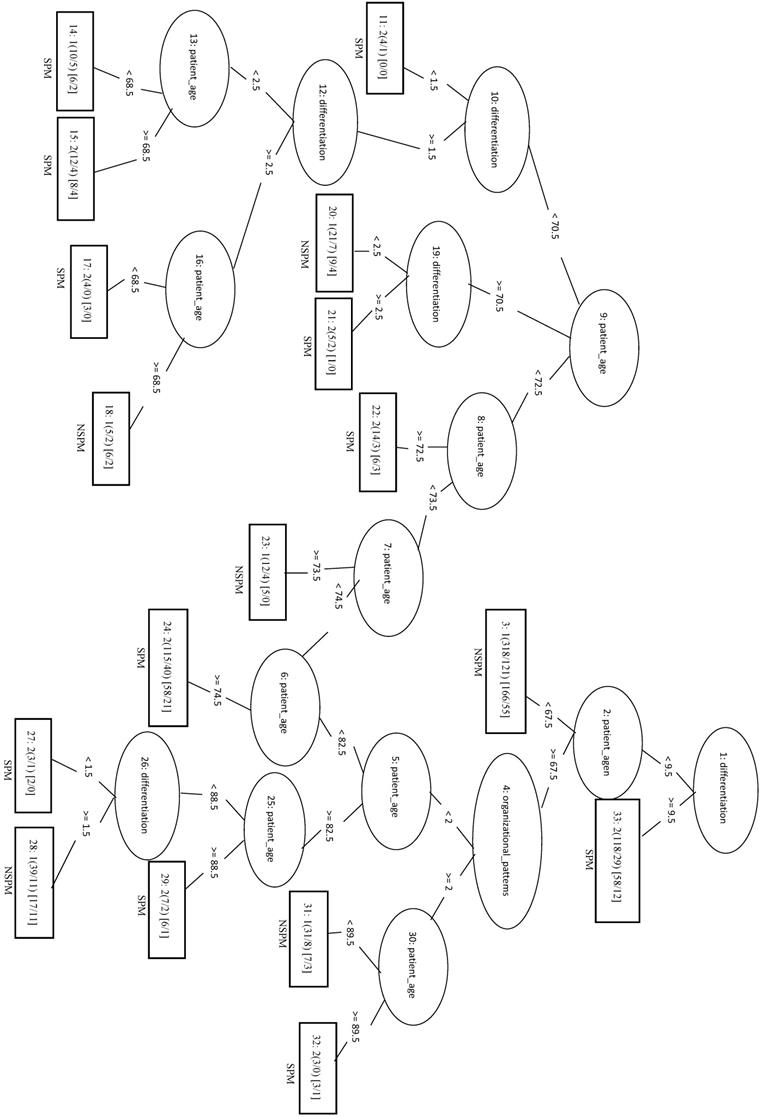
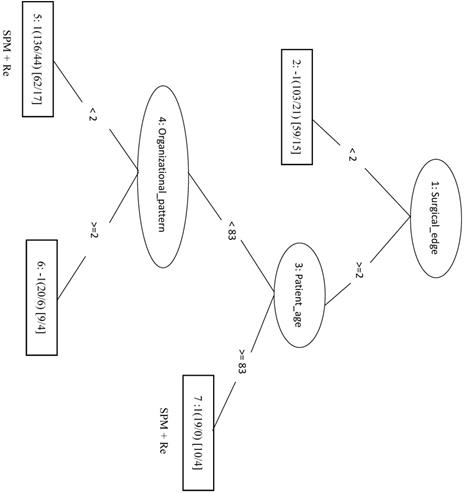
Applying the REPTree algorithm with the 1:1 ratio gave an MCC of 0.282. When an optimized model (REPTree_OP) was constructed using only the top three features (patient age, differentiation and organizational patterns), the MCC increased to 0.294 and the Sn increased to 0.706. In the REPTree_OP decision tree in Figure 4, differentiation values > 9.5 were classified as SPM, whereas differentiation values < 9.5 lead to leaf nodes of organizational patterns and patient age for classifying SPM versus NSPM.
Decision tree of important features for SPM classification using the REPTree-OP model.
Significant factors by Re and SPM
Lastly, we considered the two results of recurrent CRC and SPM together using the four conditions SPM+Re, SPM+NRe, NSPM+Re, and NSPM+NRe. Data are presented in Table 3.
The model evaluation for second primary malignancies and recurrent cancer co-discussion.
| Classifier | TP | FP | TN | FN | Sn | Sp | Acc | MCC | |
|---|---|---|---|---|---|---|---|---|---|
| SPM+Re | REPTree | 161 | 69 | 141 | 47 | 0.774 | 0.671 | 0.722 | 0.448 |
| REPTree_F | 169 | 83 | 127 | 39 | 0.813 | 0.605 | 0.708 | 0.426 | |
| LIBSVM | 145 | 63 | 148 | 62 | 0.700 | 0.701 | 0.701 | 0.402 | |
| LIBSVM_F | 161 | 65 | 145 | 47 | 0.774 | 0.690 | 0.732 | 0.466 | |
| NSPM+Re | REPTree | 1546 | 365 | 1416 | 235 | 0.868 | 0.795 | 0.832 | 0.665 |
| REPTree_F | 1572 | 374 | 1407 | 209 | 0.883 | 0.790 | 0.836 | 0.676 | |
| LIBSVM | 1477 | 365 | 1416 | 304 | 0.829 | 0.795 | 0.812 | 0.625 | |
| LIBSVM_F | 1569 | 370 | 1411 | 212 | 0.881 | 0.792 | 0.837 | 0.676 | |
| SMP+NRe | REPTree | 252 | 104 | 229 | 81 | 0.757 | 0.688 | 0.722 | 0.446 |
| REPTree_OP | 274 | 108 | 225 | 59 | 0.823 | 0.676 | 0.749 | 0.504 | |
| REPTree_F | 236 | 98 | 235 | 97 | 0.709 | 0.706 | 0.707 | 0.414 | |
| LIBSVM | 235 | 99 | 234 | 98 | 0.706 | 0.703 | 0.704 | 0.408 | |
| LIBSVM_F | 226 | 63 | 270 | 107 | 0.679 | 0.811 | 0.745 | 0.494 | |
| NSPM+NRe | REPTree | 1705 | 504 | 1473 | 272 | 0.862 | 0.745 | 0.804 | 0.612 |
| REPTree_OP | 1739 | 505 | 1472 | 238 | 0.880 | 0.745 | 0.812 | 0.630 | |
| REPTree_F | 1670 | 465 | 1512 | 307 | 0.845 | 0.765 | 0.805 | 0.611 | |
| LIBSVM | 1700 | 539 | 1438 | 277 | 0.860 | 0.727 | 0.794 | 0.592 | |
| LIBSVM_2F | 1705 | 502 | 1475 | 272 | 0.862 | 0.746 | 0.804 | 0.613 |
LIBSVM_F indicates SVM model building with feature selection. REPTree_F indicates REPTree model building with feature selection. REPTree_OP indicates REPTree model building by parameters optimization.
Second Primary Malignancy +Recurrence
We randomly selected 70 samples from each of the other three classes (total of 210 negative samples) and combined these with the 208 SPM+Re (positive) samples into the training dataset. When only the top four factors (surgical margins, pStage, areca, and drinking) were included in the analysis (LIBSVM_F), the MCC was 0.466 and the Acc was 0.732. In the REPTree model, the MCC, Acc, and Sn were 0.448, 0.722, and 0.774, respectively. This was the same as the SVM model applying only the three features of surgical margins, organizational patterns, and patient age. The decision tree shows that rules of surgical margins ≥2, patient age <83, and organizational patterns <2 or surgical margins ≥2 and patient age ≥83 can be classified into SPM+Re (Figure 5).
Decision tree of important factors for SPM + Re classification using the REP Tree_F model.
No Second Primary Malignancy +Recurrence
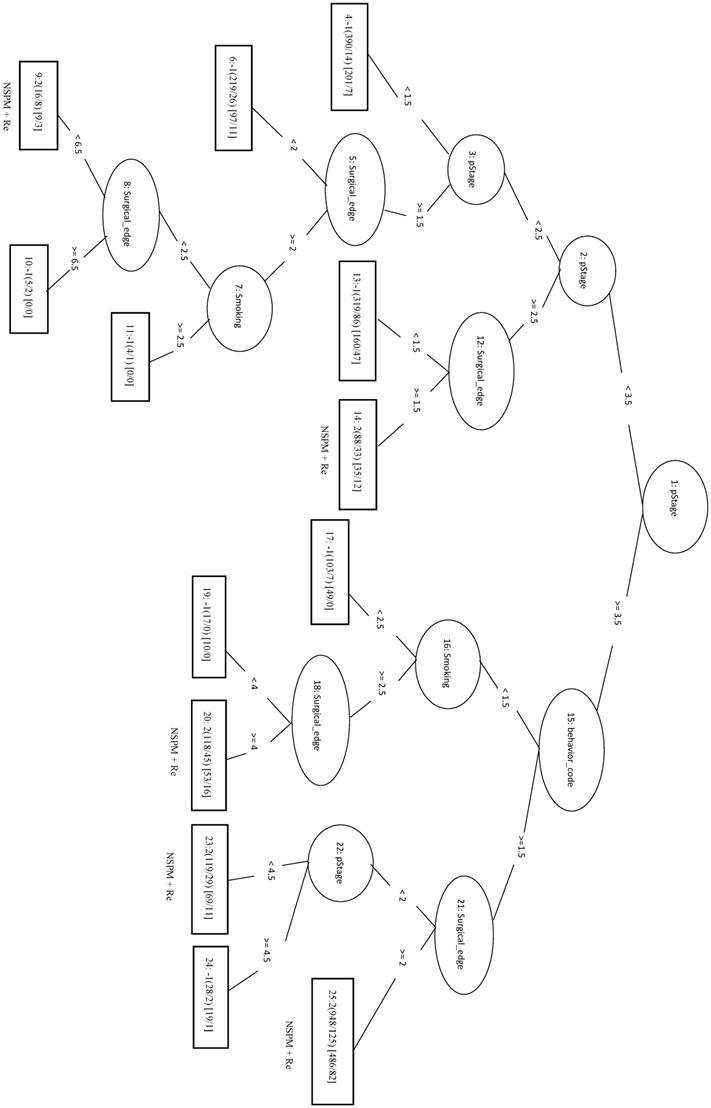
We randomly selected a total of 1781 samples from three remaining classes as negative data and combined them with the 1781 NSPM+Re (positive) samples into the training dataset. When four major factors (pStage, surgical margins, behavior code, and smoking) were selected for analysis, the MCC of the LIBSVM_F model was 0.676 and the Acc was 0.836. Using the same four factors in the REPTree_F model gave similar values for MCC and Acc. Both models also achieved a sensitivity above 0.88. The rules of the decision tree for REPTree_F are shown in Figure 6.
Decision tree of important factors for NSPM+Re classification using the REPTree_F model.
Second Primary Malignancy + No Recurrence
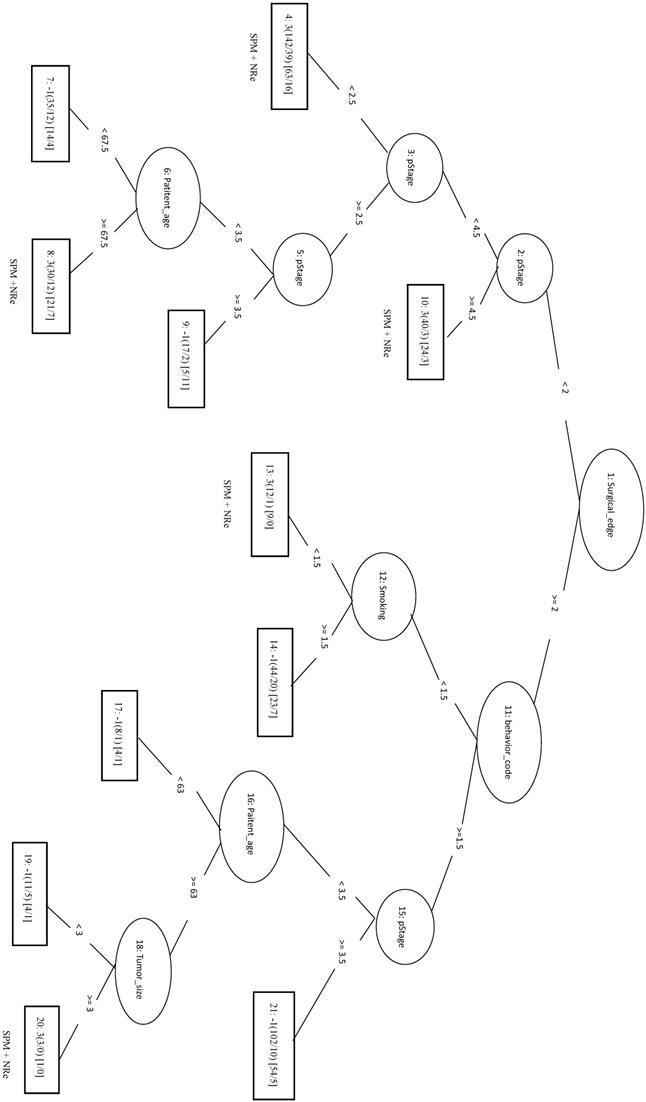
The 333 samples from SPM+NRe class (positive data) and 111 samples randomly selected from each the other three classes (negative data) were combined into the training dataset. In the LIBSVM_F model using the top three features (behavior code, pStage, and surgical margins), the MCC was 0.494 and the Sn was 0.679. For the REPTree model, the MCC was 0.446 and the Sn was 0.757. When surgical margins, pStage, tumor size, behavior code, patient age, and smoking are used in the REPTree model after parameter optimization (REPTree_OP), the MCC was 0.504 and the Sn was 0.823 (increases of 0.058 and 0.066, respectively). Compared to the SVM model with three features, the REPTree_OP model was similar in MCC and had a higher Sn (by 0.144), but had a lower Sp (by 0.135). The rules of the decision tree for REPTree_OP are shown in Figure 7.
Decision tree of important factors for SPM+NRe classification using the REPTree_OP model.
No Second Primary Malignancy + No Recurrence
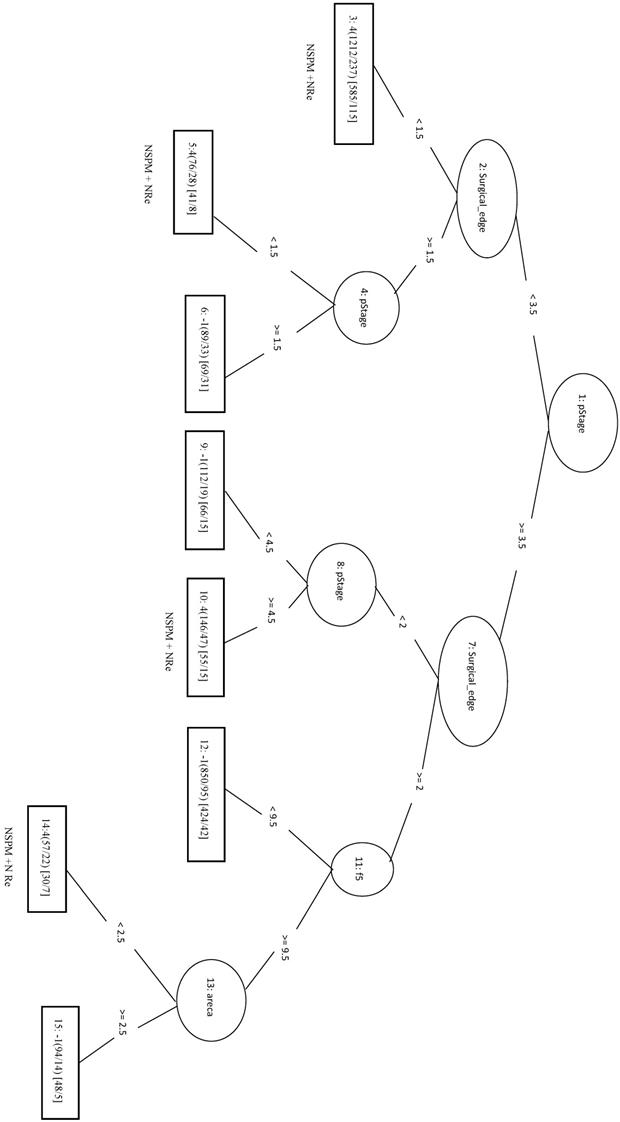
The 1977 samples (positive data) and were combined with 1977 randomly selected samples from other three classes as negative data for the training data. The top four features were pStage, surgical margins, differentiation, and tumor size. The LIBSVM model using all features had an MCC of 0.592. Using only pStage and surgical margins in the model improved performance of MCC (0.613), Sn (0.862), and Sp (0.746). In REPTree, the MCC increased from 0.612 before parameter optimization to 0.630 after parameter optimization using pStage, surgical margins, differentiation, and areca. The performance of REPTree was better than that of SVM. The rules of the decision tree for REPTree_OP are shown in Figure 8.
Decision tree of important factors for NSPM+NRe classification using the REPTree_OP model.
Discussion
Our study explored risk factors for predicting CRC recurrence and SPM and discovered that the four most important factors were pStage, surgical margins, smoking, and drinking. However, sensitivity (Sn) decreased slightly when drinking was removed from the analysis and decreased further when smoking was removed. These findings suggest that both drinking and smoking have an effect on recurrence and SPM. On the other hand, both surgical margins and pStage were significant factors using both SVM and REPTree models for classification.
In classification for SPM, when eight features (behavior code, differentiation, regional body order, patient age, areca, surgery, radiation therapy, and lowest dose) were selected to construct the REPTree model, the MCC (0.229, data not shown) outperformed the REPTree model without feature selection (MCC = 0.282, Table 2). In addition, the REPTree algorithm with parameter optimization used only three features (patient age, organizational patterns, and differentiation) to improve performance. Both methods used patient age and differentiation as factors in constructing the models. When only these two factors were used, the accuracy was relatively high for predicting SPM (0.708), but dropped to 0.518 for predicting NSPM. These findings suggested that other factors may be involved in classifying NSPM.
For all four groups in the combined analysis of recurrence and SPM, pathologic stage and surgical margins were included in all models. This highlights the clinical importance of these two factors. On the other hand, primary site was the last feature to be included in all models, indicating that it has little clinical or reference value (Table 4).
Order of top ten features by F-score for feature selection
| Re | SPM | SPM+Re | NSPM+Re | SPM+NRe | NSPM+NRe |
|---|---|---|---|---|---|
| pStage | behavior code | Surgical edge | pStage | behavior code | pStage |
| Surgical edge | differentiation | pStage | surgical edge | pStage | surgical edge |
| Smoking | regional body order | areca | behavior code | surgical edge | differentiation |
| drink | age | drink | smoking | highest dose | tumor size |
| radiation therapy | areca | Smoking | radiation therapy | radiation therapy | smoking |
| areca | surgery | BMI | drink | age | drink |
| differentiation | radiation therapy | age | surgery | lower number of times | radiation therapy |
| surgery | lowest dose | differentiation | areca | smoking | areca |
| BMI | organizational patterns | lowest dose | BMI | radiation therapy before surgery | BMI |
| behavior code | highest dose | tumor size | differentiation | tumor size | surgery |
Although our results show that selected features can be weighted using mechanical learning to find predicting factors for recurrence and SPM, there were some limitations to the study. Some site-specific factors, such as tumor markers and tumor regression grade, were not included as risk factors. Including these and other factors in machine learning programs may improve the prediction and early detection of recurrence and SPM.
There are some limitations in the study. Risk factors such as family history of breast cancer, Hereditary Nonpolyposis Colorectal Cancer cannot be available. This may affect the result of SPM. The will be enrolled in further study.
Conclusion
With mechanical learning programs, we have developed a feasible and a robust method to identify factors that are important for predicting recurrence of colorectal cancer and SPM. The four most important factors are pStage, surgical margin, smoking, and drinking. Mechanical learning can be used as an effective medical decision-making tool to improve prognostic and diagnostic accuracy in clinical settings. We strongly recommend that clinicians consider using mechanical learning in diagnosing and treating cancer patients to provide high-quality care.
Acknowledgements
This work is supported by the Jen-Ai Hospital and Chung-Shan Medical University of Taiwan (CSMU-JAH-107-01).
Competing Interests
The authors have declared that no competing interest exists.
References
1. Global Burden of Disease Cancer C, Fitzmaurice C, Akinyemiju TF, Al Lami FH, Alam T, Alizadeh-Navaei R. et al. Global, Regional, and National Cancer Incidence, Mortality, Years of Life Lost, Years Lived With Disability, and Disability-Adjusted Life-Years for 29 Cancer Groups, 1990 to 2016: A Systematic Analysis for the Global Burden of Disease Study. JAMA Oncol. 2018
2. Chiang CJ, Lo WC, Yang YW, You SL, Chen CJ, Lai MS. Incidence and survival of adult cancer patients in Taiwan, 2002-2012. J Formos Med Assoc. 2016;115:1076-88
3. Cronin KA, Lake AJ, Scott S, Sherman RL, Noone AM, Howlader N. et al. Annual Report to the Nation on the Status of Cancer, part I: National cancer statistics. Cancer. 2018;124:2785-800
4. Martini N, Bains MS, Burt ME, Zakowski MF, McCormack P, Rusch VW. et al. Incidence of local recurrence and second primary tumors in resected stage I lung cancer. J Thorac Cardiovasc Surg. 1995;109:120-9
5. Leoncini E, Vukovic V, Cadoni G, Giraldi L, Pastorino R, Arzani D. et al. Tumour stage and gender predict recurrence and second primary malignancies in head and neck cancer: a multicentre study within the INHANCE consortium. Eur J Epidemiol. 2018
6. Yamamoto M, Yamanaka T, Baba H, Kakeji Y, Maehara Y. The postoperative recurrence and the occurrence of second primary carcinomas in patients with early gastric carcinoma. J Surg Oncol. 2008;97:231-5
7. Kang M, Jung JW, Oh JJ, Lee S, Hong SK, Lee SE. et al. Do Second Primary Cancers Affect the Risk of Biochemical Recurrence in Prostate Cancer Patients Undergoing Radical Prostatectomy? A Propensity Score-Matched Analysis. Clin Genitourin Cancer. 2016;14:e363-9
8. Niknejad A, Petrovic D. Introduction to computational intelligence techniques and areas of their applications in medicine. Med Appl Artif Intell. 2013:51
9. Kleppe A, Albregtsen F, Vlatkovic L, Pradhan M, Nielsen B, Hveem TS. et al. Chromatin organisation and cancer prognosis: a pan-cancer study. Lancet Oncol. 2018;19:356-69
10. Ehteshami Bejnordi B, Veta M, Johannes van Diest P, van Ginneken B, Karssemeijer N, Litjens G. et al. Diagnostic Assessment of Deep Learning Algorithms for Detection of Lymph Node Metastases in Women With Breast Cancer. JAMA. 2017;318:2199-210
11. Cho YB, Chun HK, Yun HR, Lee WS, Yun SH, Lee WY. Clinical and pathologic evaluation of patients with recurrence of colorectal cancer five or more years after curative resection. Dis Colon Rectum. 2007;50:1204-10
12. Shimada Y, Morioka T, Nishimura M, Sawai T, Iwata K, Yi S. et al. [Radiation-induced colorectal cancer: second primary cancer after radiotherapy]. Nihon Rinsho. 2011;69(Suppl 3):126-32
13. Chung JW, Chung MJ, Bang S, Park SW, Song SY, Chung JB. et al. Assessment of the Risk of Colorectal Cancer Survivors Developing a Second Primary Pancreatic Cancer. Gut Liver. 2017;11:728-32
14. Chang C-C, Lin C-J. LIBSVM: a library for support vector machines. ACM transactions on intelligent systems and technology (TIST). 2011;2:27
15. Chen Y-W, Lin C-J. Combining SVMs with various feature selection strategies. Feature extraction: Springer. 2006 p. 315-24
16. He J, Hu H-J, Harrison R, Tai PC, Pan Y. Transmembrane segments prediction and understanding using support vector machine and decision tree. Expert Systems with Applications. 2006;30:64-72
17. Martens D, Baesens B, Van Gestel T, Vanthienen J. Comprehensible credit scoring models using rule extraction from support vector machines. European journal of operational research. 2007;183:1466-76
18. Hall M, Frank E, Holmes G, Pfahringer B, Reutemann P, Witten IH. The WEKA data mining software: an update. ACM SIGKDD explorations newsletter. 2009;11:10-8
Author contact
![]() Corresponding author: Wei-Chi Ho, Department of Gastroenterology, Jen-Ai Hospital, 483 Dong Rong Rd., Dali, Taichung, Taiwan. Email afkingcom.tw Horng-Rong Chang, Division of Nephrology, Department of Internal medicine, Chung Shan Medical University Hospital, No.110, Sec.1, Jianguo N.Road, Taichung City 40201, Taiwan. Email chrcsmucom
Corresponding author: Wei-Chi Ho, Department of Gastroenterology, Jen-Ai Hospital, 483 Dong Rong Rd., Dali, Taichung, Taiwan. Email afkingcom.tw Horng-Rong Chang, Division of Nephrology, Department of Internal medicine, Chung Shan Medical University Hospital, No.110, Sec.1, Jianguo N.Road, Taichung City 40201, Taiwan. Email chrcsmucom