Impact Factor ISSN: 1449-1907

 Global reach, higher impact
Int J Med Sci 2019; 16(12):1652-1667. doi:10.7150/ijms.38571 This issue Cite
Research Paper
Systematic Analysis of Transcriptomic Profile of the Effects of Low Dose Atropine Treatment on Scleral Fibroblasts using Next-Generation Sequencing and Bioinformatics
Yu-Ting Hsiao1,2, Wei-An Chang1,3,4, Ming-Tse Kuo5, Jung Lo1,5, Hsien-Chung Lin6, Meng-Chi Yen1,7, Shu-Fang Jian1, Yi-Jen Chen1,3,8 ![]() , Po-Lin Kuo1,9
, Po-Lin Kuo1,9 ![]()
1. Graduate Institute of Clinical Medicine, College of Medicine, Kaohsiung Medical University, Kaohsiung 807, Taiwan
2. Department of Ophthalmology, Kaohsiung Chang Gung Memorial Hospital, Kaohsiung 833, Taiwan
3. School of Medicine, College of Medicine, Kaohsiung Medical University, Kaohsiung 807, Taiwan
4. Division of Pulmonary and Critical Care Medicine, Kaohsiung Medical University, Kaohsiung 807, Taiwan
5. Department of Ophthalmology, Kaohsiung Chang Gung Memorial Hospital and Chang Gung University College of Medicine, Kaohsiung 833, Taiwan
6. Department of Ophthalmology, Kaohsiung Medical University Hospital, Kaohsiung 807, Taiwan
7. Department of Emergency Medicine, Kaohsiung Medical University Hospital, Kaohsiung Medical University, Kaohsiung 807, Taiwan
8. Department of Physical Medicine and Rehabilitation, Kaohsiung Medical University Hospital, Kaohsiung 807, Taiwan
9. Center for Cancer Research, Kaohsiung Medical University Kaohsiung 807, Taiwan
Received 2019-7-19; Accepted 2019-10-25; Published 2019-11-9
Abstract
This study has two novel findings: it is not only the first to deduct potential genes involved in scleral growth repression upon atropine instillation from a prevention point of view, but also the first to demonstrate that only slight changes in scleral gene expression were found after atropine treatment as side effects and safety reasons of the eye drops are of concern. The sclera determines the final ocular shape and size, constituting of scleral fibroblasts as the principal cell type and the major regulator of extracellular matrix. The aim of our study was to identify differentially expressed genes and microRNA regulations in atropine-treated scleral fibroblasts that are potentially involved in preventing the onset of excessive ocular growth using next-generation sequencing and bioinformatics approaches. Differentially expressed genes were functionally enriched in anti-remodeling effects, comprising of structural changes of extracellular matrix and metabolic pathways involving cell differentiation. Significant canonical pathways were correlated to inhibition of melatonin degradation, which was compatible with our clinical practice as atropine eye drops are instilled at night. Validation of the dysregulated genes with previous eye growth-related arrays and through microRNA-mRNA interaction predictions revealed the association of hsa-miR-2682-5p-KCNJ5 and hsa-miR-2682-5p-PRLR with scleral anti-remodeling and circadian rhythmicity. Our findings present new insights into understanding the anti-myopic effects of atropine, which may assist in prevention of myopia development.
Keywords: atropine, sclera, fibroblast, myopia, next-generation sequencing, bioinformatics, microRNA, messenger RNA
Introduction
The sclera is a highly organized connective tissue that comprises the major component of the outermost layer of the eye. Besides providing intraocular protection and anchorage for extraocular muscles, the sclera is a crucial determinant of the final shape and size of the eye [1]. The scleral structure is predominantly made up of collagen, and interwoven fibroblasts that are responsible for the regulation and production of the extracellular matrix (ECM). Enzymes that are responsible for the remodeling of the ECM, including matrix metalloproteinases (MMPs) and tissue inhibitor of metallopreoteinase (TIMP) families, and a wide variety of cytokines and signaling molecules, are important to homeostasis of the sclera [2,3].
Any change regarding eye size are facilitated by alterations in scleral tissue volume and composition. Given the important role of axial eye size in the process of emmetropization and the occurrence of myopia, the sclera has garnered much attention in ocular and refractive development research [4]. Myopia is currently the most common ocular disorder, and has emerged as a major socioeconomic public health concern worldwide [5,6]. Although corrective measures can be arranged by prescribing spectacle lenses, highly myopic eyes, defined as refractive error of at least -6.00 diopters (D) or axial length  26.5mm [7], are prone to eye diseases such as myopic maculopathy, retinal detachment, cataract, glaucoma, and ultimately, blindness [8,9].
A considerable amount of effort has been devoted to understanding the biomechanical and genetic regulators in ocular growth, and preventing excessive growth of the eye [10-12]. The development of myopia is accompanied by increased scleral matrix remodeling, including scleral thinning, fibril disassembly, and reduced glycosaminoglycan (GAG) and collagen content [2,13]. Therefore, disrupting the scleral remodeling process may allow us to retard, or even prevent excessive ocular growth.
Anticholinergics have shown potential anti-remodeling effects of airway and lung tissues in both in vivo and in vitro studies [14,15]. Antimuscarinics also demonstrated protective effects in bladder remodeling in bladder outlet obstruction situations through direct antagonistic effect and reduced muscarinic receptor expressions [16]. Atropine is a non-selective antimuscarinic agent evident to be effective in preventing the progression of myopia in children [17,18], and a lower concentration of topically administered atropine could prevent myopia onset in premyopic children with lower incidence of adverse effects such as photophobia and blurry vision [19]. Reports indicate that atropine could have biochemical effects on the retina or sclera, which sequentially affects sclera remodeling [1,17]. However, the exact mechanism of atropine in myopia control remains unclear. Originally, inhibition of accommodation was believed to be the primary factor in preventing myopic progression [20,21]. Other theories to explain more recently included potential mechanisms through neurochemical cascade initiated from muscarinic receptors, direct effect on scleral fibroblasts by inhibiting GAG synthesis [18], and chronic inflammation related to myopia development that may be downregulated by atropine [22].
Studies that target scleral interventions for preventing myopia onset are still nascent [1], and detailed mechanisms remain unclear. Previous study suggested dose-dependent cytotoxicity of atropine to human corneal epithelial cells at concentrations above 0.03% [23], but the cytotoxic effect to scleral fibroblasts is uncertain. We postulated the administration of very low dose atropine to scleral fibroblasts could minimize the risk of adverse effects, potentiating its preventive role in clinical use for myopia prevention in children. To explore the effects of atropine on gene expression modulation in scleral fibroblasts, we conducted this study with next-generation sequencing (NGS) technology and bioinformatics analyses. To our knowledge, this is the first study to systematically investigate the changes of gene regulation in scleral fibroblasts treated with atropine.
Materials and Methods
Study Design
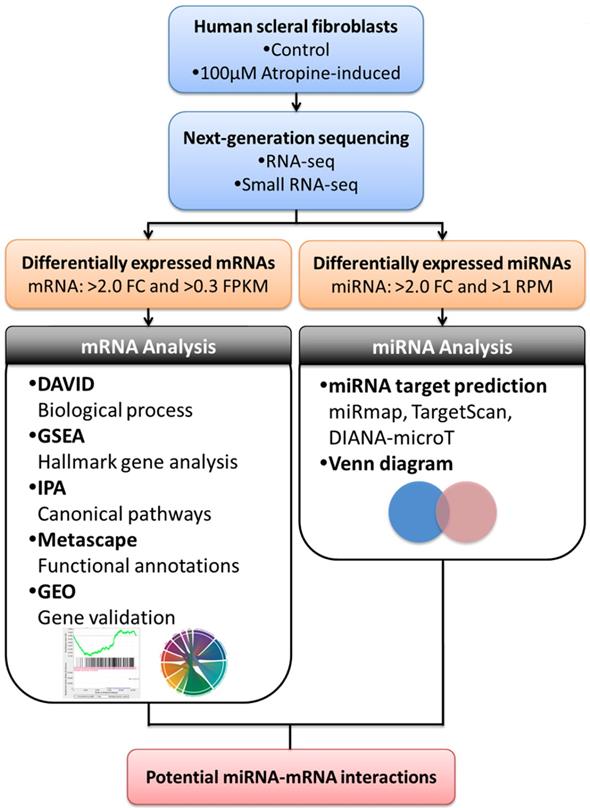
The study flowchart is illustrated in Figure 1. Scleral fibroblasts (the first passage) were cultured with 0.1% DMSO (control) and 100 M atropine [22,24,25] for 24 hours. The fibroblasts were then harvested for RNA and small RNA sequencing through the NGS platform. The differentially expressed genes (>2.0 fold-change) were analyzed using bioinformatics tools including the Database for Annotation, Visualization and Integrated Discovery (DAVID) database [26], Gene Set Enrichment Analysis (GSEA) software [27], Ingenuity® Pathway Analysis (IPA) [28], and Metascape [29] for pathway analysis and functional interpretation. Next, these differentially upregulated and downregulated genes were verified in representative Gene Expression Omnibus (GEO) datasets [30]. The target prediction for the differentially expressed microRNAs (miRNAs) (>2.0 fold-change) were analyzed with miRmap [31], and genes with potential miRNA-mRNA interactions were determined through Venn diagram (http://bioinformatics.psb.ugent.be/webtools/Venn/). These potential miRNA-mRNA interactions were further confirmed by other prediction databases, TargetScan [32] and DIANA-microT [33]. Lastly, an English literature search for the associated functions of these dysregulated genes was carried out to generate the hypothesis.
Flowchart of study design. Scleral fibroblasts were cultured with 0.1% DMSO (control) or 100 M atropine for 24 hours, and were harvested for RNA and small RNA deep sequencing. The differentially expressed genes were analyzed for enrichment analyses using various bioinformatics databases, and verified in representative arrays in GEO database. Putative targets of differentially expressed miRNAs were predicted with miRNA prediction databases, and potential miRNA-mRNA interactions were determined through Venn diagram. The potential miRNA-mRNA interactions were then validated by other miRNA prediction databases.
Culture of Primary Cells
Human scleral fibroblasts (Part No. FC0098, Lot No. 06992) were purchased from Lifeline Cell Technology. The cells were incubated at 37 in a 5% CO2-containing incubator in FibroLife® S2 LifeFactors kit (Lifeline Cell technology, Catalog No. LS-1038) containing 0.5 mL recombinant human FGF-basic (rh FGF-b), 0.5mL recombinant human insulin, 0.5 mL ascorbic acid, 18.75mL L-glutamine, 0.5mL hydrocortisone hemisuccinate, 10mL fetal bovine serum (FBS), 0.5mL Gentamicin and Amphotericin B (G-A). The medium was changed every 2 to 3 days and the cells were harvested at 80-90% confluence.
Atropine Treatment
Atropine powder with a purity  99%, purchased from Sigma-Aldrich (St. Louis, MO, USA), was dissolved in dimethyl sulfoxide (DMSO). In atropine-treated condition, scleral fibroblasts were treated with 100
 M atropine for 24 h. In control condition, scleral fibroblasts were treated with 0.1% DMSO, the carrier solvent. The atropine concentration at 100
 M was based on previous studies that evaluated the effects of atropine on scleral fibroblasts and ocular cell types [22,24,25]. To avoid losing original characteristics of scleral fibroblasts with serial passages, the first passages of cells following cultivation from primary cells underwent treatment and were harvested for NGS analysis.
Next-Generation Sequencing (NGS) for miRNA and mRNA Expression Profiling
The NGS technique was used for examining the expression profiles of miRNAs and mRNAs as described in our previous studies [34-36]. Total RNA from the atropine-treated and normal scleral fibroblasts were extracted with TRIzol® Reagent (Invitrogen, USA.) at Welgene Biotech Co., Ltd. (Taipei, Taiwan). Purified RNA was quantified at an optical density of 260nm with a ND-1000 spectrophotometer (Nanodrop Technologies, Wilmington, DE, USA). The quality of extracted RNA was analyzed using a Bioanalyzer 2100 (Agilent Technologies, Santa Clara, CA, USA), with RNA 6000 LabChip® kit (Agilent Technologies, Santa Clara, CA, USA). The small RNA library construction and NGS were executed by Welgene Biotech Co., Ltd. (Taipei, Taiwan). Samples were prepared with the QIAseq miRNA Library Kit (QIAGEN) following the instruction manual. Following the sequential ligation of adaptors to the 3' and 5' ends of miRNAs, universal cDNA synthesis was carried out, and the cDNA constructs containing 18-40 nucleotide (140-155 nucleotides in length with both adaptors) RNA fragments were chosen. The libraries were sequenced on an Illumina platform (75-cycle single-end read). Sequencing data was processed by Illumina software. The small RNA sequencing data was further analyzed through a filtering process to procure qualified reads. Trimmomatic (version 0.36) [37] was applied to trim and discard reads with low quality scores. By using miRDeep2 [38], qualified reads were examined, and then the reads were aligned to the reference genome downloaded from UCSC (University of California, Santa Cruz, CA, USA) [39]. Since miRNAs usually map to few genomic locations, only reads that mapped perfectly to the genome five or less times were used for miRNA detection. The miRNAs with low levels (<1 normalized read per million (rpm)) were excluded, and those with >2-fold changes were considered dysregulated.
For transcriptome sequencing, library construction with Agilent's SureSelect Strand Specific RNA Library Preparation kit (Agilent Technologies, Inc.) followed by sequencing the library on a Solexa platform (150 paired-end cycles) using the TruSeq sequencing-by-synthesis (SBS) kit (Illumina, Inc., San Diego, CA, USA) was carried out. Trimmomatic (version 0.36) [37] was also implemented to trim and eliminate reads with low quality score. Qualified reads were then surveyed using HISAT2 [40]. The genes with low expression levels (<0.3 fragment per kilobase of transcript per million mapped reads (FPKM)) in both atropine-treated scleral fibroblasts and normal scleral fibroblasts were excluded, and those with >2 fold-changes were considered as differentially expressed genes.
miRmap Database Analysis
miRmap is an open-source software library for predicting miRNA targets [31]. This miRNA target prediction tool uses thermodynamic, conservation, probabilistic and sequence-based approaches for the prediction of repression strength. With the predictive reference value, the miRmap score, a list of putative target genes could be identified. A higher miRmap score indicates higher repression strength. In this study, miRmap score  97.0 was used as the criteria for putative miRNA target selection.
DIANA-microT Analysis
DIANA-microT v5.0 is an online database that is customized for miRNA target prediction and functional analysis [33]. This new version of the microT server uses an enhanced target prediction algorithm, DIANA-microT-CDS, and has incorporated miRBase version 18 and Ensembl version 69. microT-CDS is the only algorithm online that is peculiarly designed to identify targets on a positive and a negative set of miRNA Recognition Elements (MREs), located in both the 3'-UTR and CDS regions.
TargetScan Database Analysis
TargetScan is web application that predicts the target of miRNA by searching for the presence of conserved 8, 7, and 6 mer sites matching the seed region of each miRNA [32]. Ranking of the prediction results are established on the predicted efficacy of targeting or the probability of conserved targeting.
DAVID Database Analysis
The Database for Annotation, Visualization and Integrated Discovery (DAVID) is a powerful gene functional annotation tool [26]. It merges Gene Ontology (GO) and Kyoto Encyclopedia of Genes and Genomes (KEGG) pathway, and a list of genes of interest can be categorized into clusters of related biological process, cellular components, and molecular functions by calculating the similarity of global annotation profiles with an agglomeration algorithm method. DAVID database provides an Expression Analysis Systematic Explorer (EASE) score, a modified Fisher's Exact p value for reference. The EASE score stands for how particularly the user genes are involved in the category, and we selected EASE score=0.1 as default in this study.
GSEA Database Analysis
The Gene Set Enrichment Analysis (GSEA) software interprets and analyzes gene expression data based on gene sets, in other words, groups of genes that have common biological function, chromosomal location, or regulation [27]. GSEA considers all genes in an experiment, not only appointed genes with significant differential expression. Furthermore, GSEA provides a more accurate null model by assessing the significance by permuting phenotypes, which preserves gene-gene correlations. In the present study, GSEA desktop version 3.0 was used for analysis.
Ingenuity Pathway Analysis (IPA)
The Ingenuity Pathway Analysis (IPA) (Qiagen Inc., Valencia, CA, USA) is a web-based bioinformatics application that provides a comprehensive interpretation of functional analysis, integration, and visualization from high-throughput experiments including RNA sequencing, small RNA sequencing, microarrays, metabolomics and proteomics [28]. Identification of predicted canonical pathways, associated diseases and function, key upstream regulators, and related signaling pathways can be obtained after the gene list of interest is uploaded to IPA for core analysis. IPA can also construct casual networks to generate mechanistic hypotheses, established from changes of expression in the dataset. The dysregulated genes from the scleral fibroblasts were uploaded to IPA (version 2.3) to identify the associated canonical pathways.
Metascape Analysis
Metascape is a web-based portal that engineers a knowledgebase synchronization pipeline to analyze and interpret large-scale datasets [29]. Metascape facilitates gene annotation integration, functional enrichment, interactome analysis, membership analysis, and multi-gene-list meta-analysis. It provides a convenient one-click Express Analysis interface to generate interpretable results. Metascape version 3.5 was used for analyzing the candidate genes in scleral fibroblasts for functional profiles. Graphical representations of functional relationships were visualized using Flourish (https://flourish.studio).
GEO Database Analysis
The GEO database provides public access to high-throughput gene expression data of microarrays, chips or NGS [30]. The database can be linked to GEO2R, a web-based tool, where users can carry out further analysis by acquiring the expression values of genes of interest. The arrays related to eye growth in human ocular tissues (GSE71743 and GSE18811) were used in this study to identify genes that expressed in opposing directions with our NGS results.
Results
Gene Expression Profiles and miRNA Changes in Scleral Fibroblasts
The mRNA and small RNA expression data of atropine-treated scleral fibroblasts and normal scleral fibroblasts were sequenced using an NGS platform. Gene expression analysis revealed 389 differentially expressed genes with at least a 2.0-fold change, inclusive of 215 upregulated and 174 downregulated genes. miRNA expression analysis yielded a total of 23 miRNAs with fold-change >2, which included 15 upregulated and 8 downregulated miRNAs.
Gene Ontology Analysis of Dysregulated genes in Scleral Fibroblasts Treated with Atropine
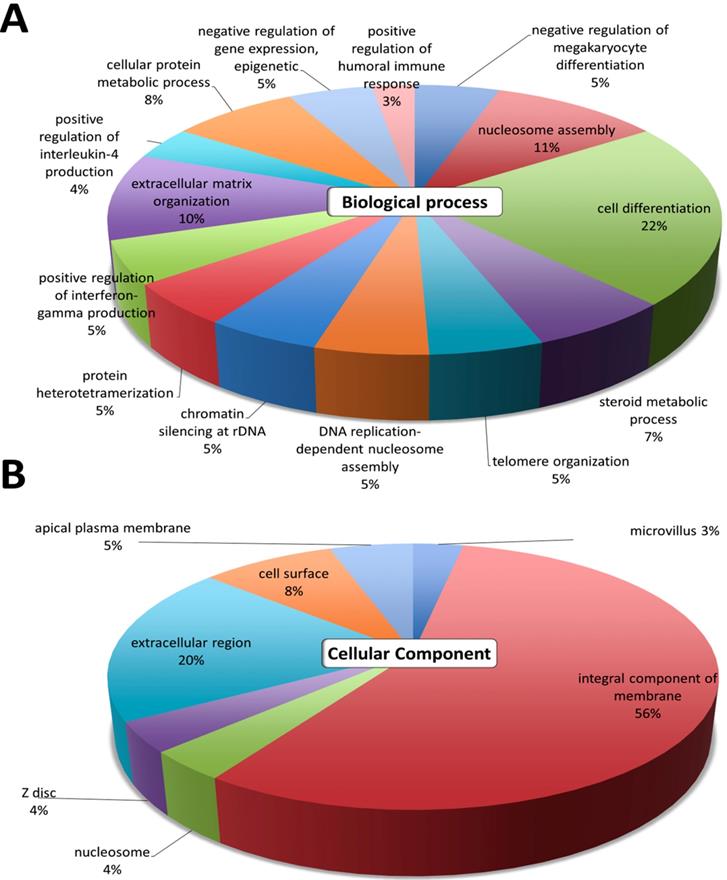
The gene ontology analyses of the 389 differentially expressed genes were first analyzed using DAVID. The top GO terms in the 'Biological Process' were cell differentiation, nucleosome assembly, extracellular matrix organization, cellular protein metabolic process, and steroid metabolic process (Figure 2A). The results in 'Cellular Component' indicated that the most significant function was involved in the integral component of membrane and the extracellular region (Figure 2B). These GO annotations indicated the involvement of dysregulated genes in metabolic pathways involving cell differentiation, and structural changes related to the extracellular matrix.
Differential expression analysis of genes in atropine-treated scleral fibroblasts. Gene ontology terms involved in the 389 differentially expressed genes of atropine treated scleral fibroblasts. The 389 genes were input into the DAVID database to determine related (A) biological functions and (B) cellular component domain. The selected criteria for functional annotation analysis were EASE score=0.1 and p value < 0.05. The area of each pathway reflected the number of genes involved.
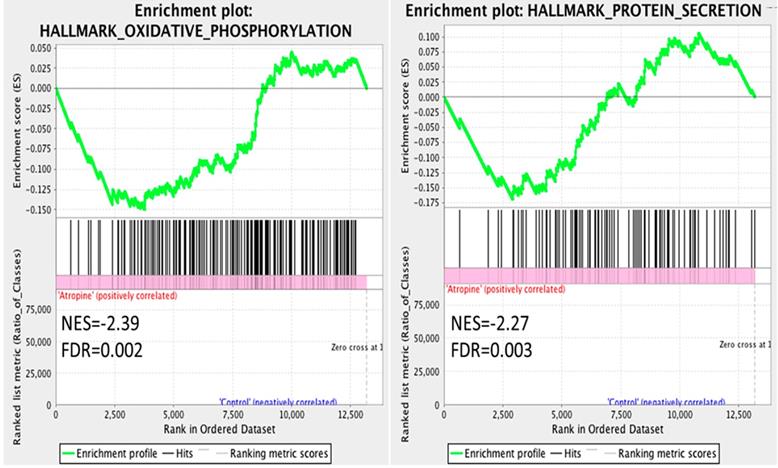
The dysregulated genes were systematically assessed for functional enrichment using the GSEA database. The expression values of the genes in atropine-treated scleral fibroblasts and normal scleral fibroblasts were all uploaded into GSEA software, and analyzed with the hallmark gene sets database. A more stringent false discovery rate (FDR) cutoff was used, with the cutoff for significant genes sets as FDR <5%. The gene sets enriched in normal scleral fibroblasts included oxidative phosphorylation and protein secretion (Figure 3). Notably, the results revealed that the functions of normal scleral fibroblasts were significantly enriched in both the metabolic and structural pathways.
Gene Set Enrichment Analysis (GSEA) of gene expression in scleral fibroblasts. All the expressed genes that were >0.3 FPKM in either normal or atropine-treated scleral fibroblasts were uploaded into GSEA for enrichment analysis. The h.all.v6.2.symbols.gmt [Hallmarks] gene set database was used as the gene set collection for analysis. GSEA performed 1000 permutations and gene_set permutation was used. The maximum and minimum size for gene sets were set at 500 and 15, respectively. Cutoff for significant genes sets was false discovery rate (FDR) <5%.
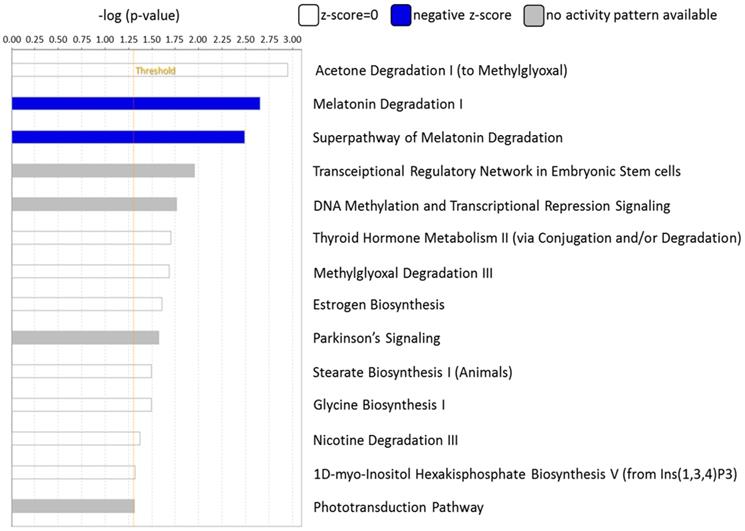
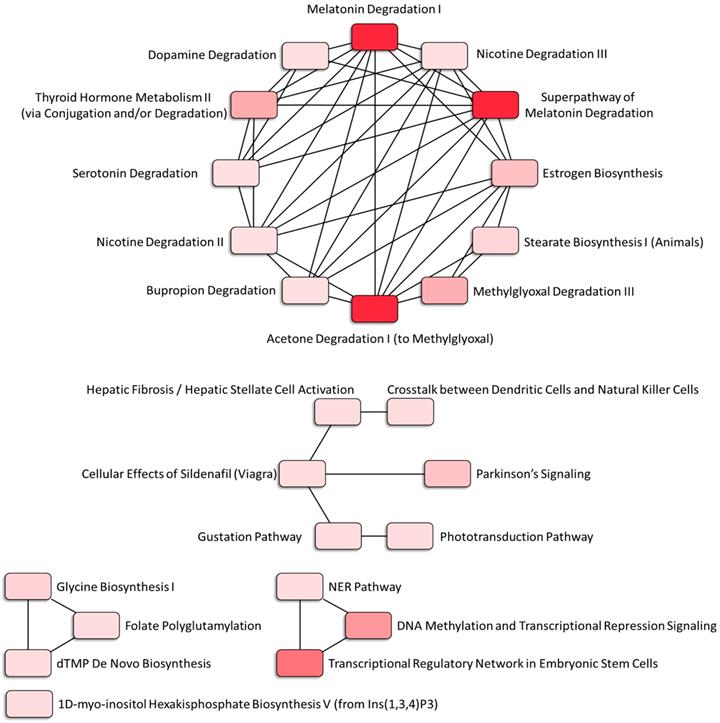
The canonical pathways associated with the 389 differentially expressed genes were explored using IPA. Pathway analysis showed that the dysregulated genes were enriched in 14 pathways, with two pathways showing a significant negative prediction pattern (Figure 4). Both pathways, melatonin degradation and superpathway of melatonin degradation, were significantly inhibited. Figure 5 showed the networks of the pathways that were in association. The metabolism of dopamine and hormones were also found to be involved in the dysregulated genes, and connected with melatonin degradation pathways. This implies that the gene expression and cell homeostasis changes in atropine-treated scleral fibroblasts may be potentially regulated by melatonin-related signaling pathways.
Functional analysis of differentially expressed genes identified in atropine-induced scleral fibroblasts by Ingenuity Pathway Analysis (IPA). Of the 14 enriched pathways, only two pathways showed a significant predicted pattern of activity. The two pathways, melatonin degradation and superpathway of melatonin degradation, were significantly inhibited.
Associated networks of pathways related to dysregulated genes in atropine-treated scleral fibroblasts. The networks of pathways that were in relation were analyzed by Ingenuity Pathway Analysis (IPA).
Identification and Functional Annotation Classification of Potential miRNA-mRNA Interactions in Atropine-Treated Scleral Fibroblasts
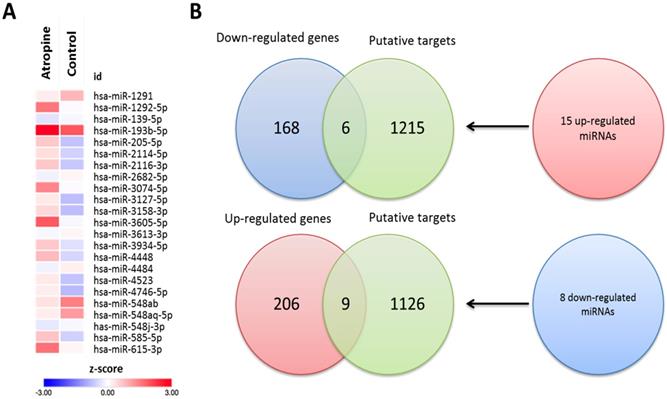
To determine the potential miRNA-mRNA interactions between normal and atropine-treated scleral fibroblasts, we first identified 23 differentially expressed miRNAs with >2.0-fold change, including 15 upregulated and 8 downregulated miRNAs. The heatmap of the dysregulated miRNAs is shown in Figure 6A. Subsequently, the putative targets of the 23 miRNAs were predicted using miRmap database, setting a selection criteria of miRmap score more than 97.0. The analytic results revealed 1221 targets of 15 upregulated miRNAs and 1135 targets of 8 downregulated miRNAs. Then, we matched these putative targets to the 389 dysregulated protein-coding genes. Using an online Venn diagram analysis, 6 downregulated and 9 upregulated genes were discovered in the intersection (Figure 6B). The 15 candidate genes with 16 potential miRNA-mRNA interactions that were identified in atropine-treated scleral fibroblasts are shown in Table 1.
Genes selected between putative targets of microRNA and differentially expressed genes from NGS database
| Up-regulated miRNA | Target down-regulated mRNA | Gene name | Fold change (Log2FC) |
|---|---|---|---|
| hsa-miR-193b-5p | PLXDC1 | plexin domain containing 1 | -1.38 |
| hsa-miR-2114-5p | SEMA6A | semaphorin 6A | -1.16 |
| hsa-miR-3074-5p | CSRNP3 | cysteine and serine rich nuclear protein 3 | -1.17 |
| hsa-miR-3127-5p | SOX6 | SRY-box 6 | -2.27 |
| hsa-miR-3158-3p | GATAD2B | GATA zinc finger domain containing 2B | -1.39 |
| hsa-miR-3934-5p | ZNF546 | zinc finger protein 546 | -3.64 |
| Down-regulated miRNA | Target up-regulated mRNA | Gene name | Fold change (Log2FC) |
| hsa-miR-1291 | FOXP3 | forkhead box P3 | 1.56 |
| RNF43 | ring finger protein 43 | 1.82 | |
| CDT1 | chromatin licensing and DNA replication factor 1 | 1.57 | |
| MAP3K9 | mitogen-activated protein kinase kinase kinase 9 | 1.71 | |
| hsa-miR-2682-5p | VPS53 | VPS53, GARP complex subunit | 1.70 |
| VIL1 | villin 1 | 1.47 | |
| PRLR | prolactin receptor | 1.29 | |
| PDE4B | phosphodiesterase 4B | 1.30 | |
| KCNJ5 | potassium voltage-gated channel subfamily J member 5 | 1.92 | |
| MAP3K9 | mitogen-activated protein kinase kinase kinase 9 | 1.71 |
Identification of differentially expressed miRNAs and potential miRNA-mRNA interactions in human primary scleral fibroblasts. (A) The heatmap analysis of differentially expressed miRNAs from atropine-treated and normal scleral fibroblasts with z-score values were shown. (B) The 15 up-regulated and 8 down-regulated miRNAs predicted 1221 and 1135 putative targets, respectively. Putative targets of differentially expressed miRNAs were predicted using miRmap database, setting the repression score at ≥ 97.0. The candidate genes were those overlapping with differentially expressed mRNAs in atropine-treated and control scleral fibroblasts. Fifteen genes (9 upregulated and 6 downregulated) with potential miRNA-mRNA interactions were identified.
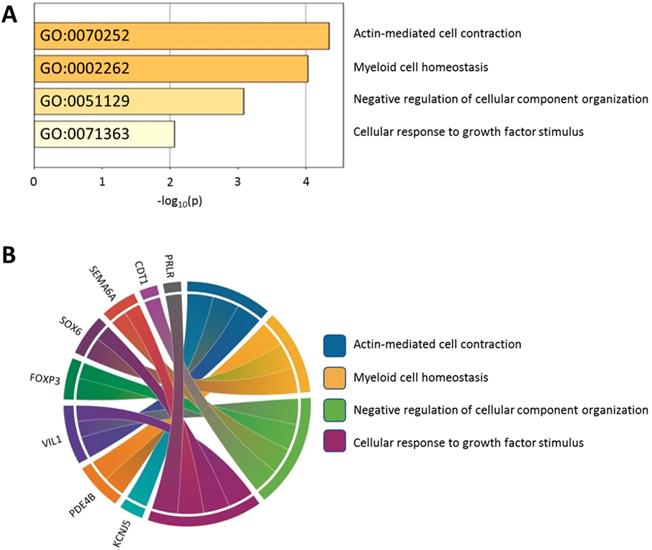
Using the Metascape database, the functional profiles of the 15 candidate genes between normal and atropine-treated scleral fibroblasts were analyzed. As shown in Figure 7A, the top four clusters were mostly involved in changes in cellular development, and regulation of structural organization. Functional annotation of the 15 candidate genes with their over-represented enriched terms are visualized graphically in Figure 7B.
Functionally enriched terms across candidate genes. (A) The 15 candidate genes identified in atropine-treated and control scleral fibroblasts were analyzed by Metascape. The process enrichment analysis had been carried out with the GO Biological Processes ontology source, and all genes in the genome were used as the enrichment background. Terms with a p-value < 0.01, a minimum count of 3, and an enrichment factor > 1.5 were collected and grouped into clusters based on their membership similarities. The p-values were calculated based on the accumulative hypergeometric distribution. (B) Chord diagram showing the top 4 clusters of the 15 candidate genes with their representative enriched terms.
Analysis of Candidate Genes Expression Pattern in Related Ocular Tissue Arrays from Gene Expression Omnibus (GEO) Database and Identification of Potential Molecular Signatures in Ocular Growth Microenvironment
To verify the 15 candidate genes in clinical samples from patients with ocular growth, the GEO database was explored for associated datasets. Since ocular growth is considered an event that involves various ocular tissues, especially in the posterior pole [41], we took datasets of the retina, choroid, retinal pigmented epithelium, and sclera into consideration. Under the criterion of Homo sapiens organism, there were two representative arrays comparing ocular tissues with eye growth (GSE71743 and GSE18811). One array compared scleral fibroblasts from the anterior and posterior pole of the sclera (GSE71743), and the other array compared retinal pigmented epithelium isolated from fetuses and adults (GSE18811). The expression patterns of the 15 candidate genes in the GSE18811 dataset are demonstrated in Figure 8.
Analysis of 15 candidate genes with potential miRNA-mRNA interactions in ocular growth-related dataset. Expression values of (A) nine upregulated genes and (B) six downregulated genes were validated in an ocular growth-related dataset comparing fetal and adult retinal pigmented epithelial tissues derived from GEO database (GSE 18811). The significantly upregulated expressions of VIL1, PRLR and KCNJ5 were in opposing directions with our atropine-induced scleral fibroblasts NGS result. * indicated p < 0.05, and n.s. indicated no statistical significance. (Probe ID reference: FOXP3, 221333_at; RNF43, 218704_at; VPS53, 221707_s_at; VIL1, 205506_at; CDT1, 228868_x_at; PRLR, 227629_at; PDE4B, 211302_s_at; KCNJ5, 208397_x_at; MAP3K9, 213927_at; ZNF546, 240429_at; CSRNP3, 235018_at; SEMA6A, 225660_at; SOX6, 235526_at; GATAD2B, 238076_at; PLXDC1, 214081_at).
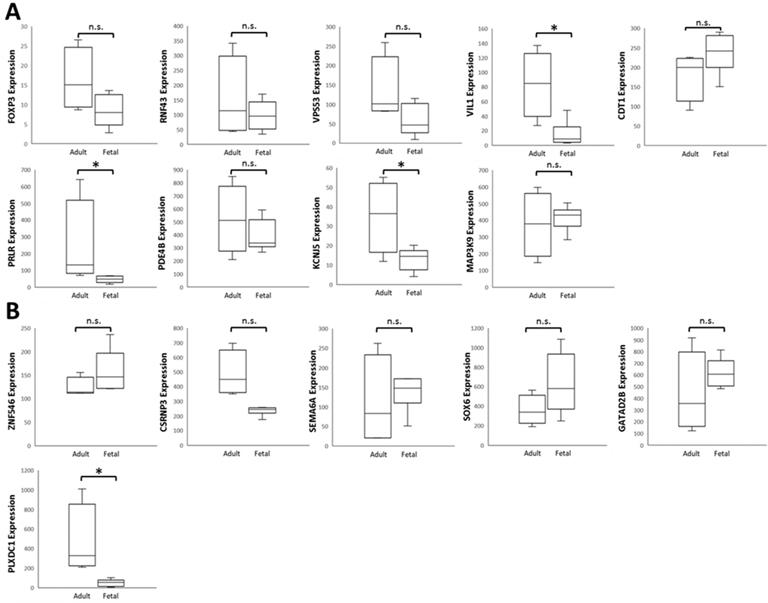
Dysregulated genes were considered verified if they exhibited opposing directions in gene expressions related to ocular growth in both GSE71743 and GSE18811 datasets, and the expression changes were significant in at least one dataset. The results are shown in Table 2. According to the GEO analysis, we verified the upregulated prolactin receptor (PRLR) and potassium voltage-gated channel subfamily J member 5 (KCNJ5) and downregulated semaphorin 6A (SEMA6A) as the target genes of interest.
Gene Expression Omnibus verification of dysregulated genes in scleral fibroblasts
| GEO Accession Number | GSE71743 | GSE18811 | ||
|---|---|---|---|---|
| Specimen | Human (infant) | Human | ||
| Tissue | Scleral fibroblast | Retinal pigmented epithelial cell | ||
| Posterior/anterior | Fetal/adult | |||
| Genes | Up/Downregulation | P-value | Up/Downregulation | P-value |
| Upregulated genes | ||||
| FOXP3 | DOWN | 0.855 | DOWN | 0.069 |
| RNF43 | UP | 0.190 | DOWN | 0.571 |
| VPS53 | DOWN | 0.356 | DOWN | 0.056 |
| VIL1 | UP | 0.189 | DOWN | 0.003 |
| CDT1 | UP | 0.127 | UP | 0.208 |
| PRLR | DOWN | 0.021 | DOWN | 0.008 |
| PDE4B | UP | 0.029 | DOWN | 0.481 |
| KCNJ5 | DOWN | 0.977 | DOWN | 0.029 |
| MAP3K9 | DOWN | 0.064 | UP | 0.465 |
| Downregulated genes | ||||
| ZNF546 | UP | 0.091 | UP | 0.279 |
| CSRNP3 | UP | 0.133 | DOWN | 0.05 |
| SEMA6A | UP | 0.013 | UP | 0.211 |
| SOX6 | UP | 0.119 | UP | 0.134 |
| GATAD2B | UP | 0.924 | UP | 0.118 |
| PLXDC1 | UP | 0.554 | DOWN | 0.001 |
The genes and their directions of expression marked in bold were those that were expressed in opposing directions in both datasets, and the expression changes were significant in at least one.
Identification of Potential miRNA-mRNA Interactions of PRLR, KCNJ5, and SEMA6A in Atropine-Treated Scleral Fibroblasts
The potential miRNA regulations of PRLR, KCNJ5, and SEMA6A with miRmap score  97.0 were chosen, and matched to the 23 differentially expressed miRNAs from our data. Subsequently, the 3 genes with potential miRNA-mRNA interactions were verified in two other miRNA prediction databases, TargetScan and DIANA-microT. Results yielded hsa-miR-2682-5p-PRLR and hsa-miR-2682-5p-KCNJ5 interactions were validated in all three miRNA prediction databases (Table 3).
Potential miRNA regulations of identified genes in atropine treated scleral fibroblasts
| Up-Regulated miRNA | Fold-Change | Predicted Target Down-regulated mRNA | miRmap Score | TargetScan Score | DIANA-microT |
|---|---|---|---|---|---|
| hsa-miR-2114-5p | 2.14 | SEMA6A | 99.08 | -0.04 | - |
| Down-Regulated miRNA | Fold-Change | Predicted Target Up-regulated mRNA | miRmap Score | TargetScan Score | microT-CDS |
| hsa-miR-2682-5p | -2.32 | PRLR | 99.87 | -0.28 | 0.908 |
| KCNJ5 | 98.93 | -0.1 | 0.761 |
- indicated no miRNA-mRNA interaction predicted in database.
Discussion
We report for the first time, utilizing NGS for human scleral miRNA and mRNA expression profiling upon treatment with atropine. As the sclera defines the final ocular shape and size, the sclera has become an appealing targeting tissue for myopia control [1,2]. Preventing the onset of myopia and setting back its progression in early life are vital steps in management of myopia. There is no cure for myopia at present, however, nightly atropine eye drops have been prescribed for controlling progressive axial myopia since the 1960s and is still the most effective pharmacological treatment in clinical practice for myopia [17-19,42]. In this study, we sought to identify differentially regulated miRNAs and gene expression in atropine-treated scleral fibroblasts and explore their potential to adjust the course of scleral remodeling as a treatment strategy to arrest ocular elongation.
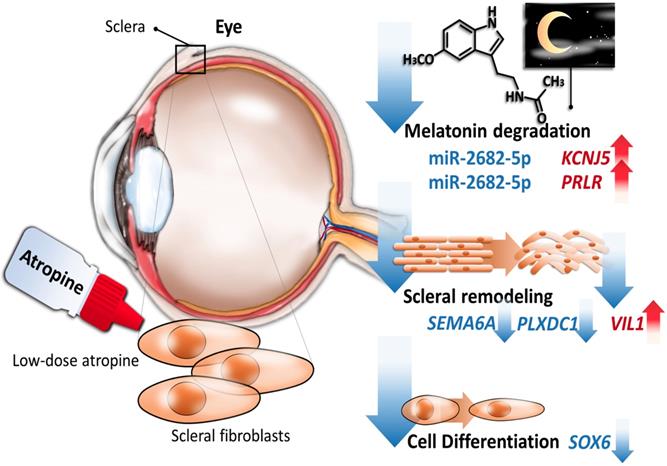
Accumulating evidence revealed that anticholinergics have anti-remodeling effects [14-16], and our results also showed that gene expression across atropine-treated scleral fibroblasts were associated with anti-remodeling effects via metabolic and structural pathways. We identified 389 differentially expressed genes in scleral fibroblasts treated with low dose atropine as compared with the control group. Gene ontology analysis revealed that genes were closely linked to metabolic regulation involving cell differentiation and oxidative phosphorylation, and structural changes comprising of ECM organization and protein secretion. In addition, canonical pathway analysis indicated that these alterations in scleral remodeling processes may be modulated by melatonin signaling pathways. Of the 23 differentially regulated miRNAs, we found two potential altered miRNA-mRNA interactions, including hsa-miR-2682-5p-PRLR and hsa-miR-2682-5p-KCNJ5, to be of importance in response to low dose atropine treatment in scleral fibroblasts. The graphic summary of these gene expression changes is presented in Figure 9.
Schematic summary of the proposed molecular signatures in scleral fibroblasts after atropine treatment.
Strong evidence demonstrated that the cycle of light and dark, and ocular circadian rhythms is essential in the maintenance of ocular axial elongation and eye growth [43-45]. Melatonin, which can be secreted by pinealocytes, retinal photoreceptors, and ciliary epithelial cells, plays an important part in the coordination of the circadian system [46-48]. The expression of two melatonin receptors, MT1 and MT2, have been identified in the sclera [44,49]. Activation of MT1 and MT2 lead to modulation of cyclic adenosine monophosphate (cAMP) and intracellular Ca2+ levels [50]. The circadian rhythmicity of melatonin synthesis and release was shown to control several biological rhythms in the eye, inclusive of circadian changes in intraocular pressure [51], modulation of dopamine release [52], phototransduction and photoreceptor renewal in retina [53], and as an antioxidant in lens [54]. In animal models, it was speculated in the sclera of chick eyes that rhythmic fluctuations in scleral proteoglycan synthesis with a period of approximately 24 hours contributed to the rhythm in axial elongation [55]. Regular intervals of light and dark periods are essential for eye growth regulation as shown in the reciprocal interaction between melatonin and dopamine. Constant light, constant dark, or a brief period of light exposure at night could result in ocular growth disruptions and subsequent refractive errors [44,56-58]. In the latter, the authors suggested that stimulation in eye growth was due to acute suppression of melatonin by light at night [58]. In our study, the results by z-score estimation from IPA implied the inhibited functions of melatonin degradation in atropine-treated scleral fibroblasts. Network analysis of associated canonical pathways further exhibited the correlation between melatonin regulation and dopamine metabolism. As atropine eye drops are instilled before bedtime at night, our results are concordant with findings from previous studies as inhibiting melatonin degradation in the sclera at night could potentially lead to eye growth retardation.
Our data identified potassium voltage-gated channel subfamily J member 5 (KCNJ5), a G protein-gated ion channel [59], to be a potential regulator after atropine treatment. The encoded protein had a greater tendency to allow potassium to flow into a cell rather than out of a cell, and its expression was abundant in the adrenal gland [59,60]. One of the KEGG pathways of KCNJ5 include circadian entrainment, where its orthology to Kir3, which is affected by the MT1 receptor via the Gi signaling-transduction proteins, was noted [61]. Research has mainly focused on its role with hyperaldosteronism [62,63]. Research has supported the associations between genetic variations of steroidogenesis enzyme genes and high myopia. The KCNJ5 gene is considered a candidate SNP variation for increased risk of pathological myopia in genome-wide association analysis studies [64]. Altogether, with these literature reviews, the upregulation of KCNJ5 in our NGS results implicates a novel finding in the effects of atropine on the sclera.
Prolactin receptor (PRLR) belongs to the type I cytokine receptor family, and is a receptor for prolactin (PRL). PRLR can be activated by three human hormones, prolactin, growth hormone, and placental lactogen, therefore is responsible for a wide variety of physiological actions [65]. The circadian rhythm of PRL secretion in humans had been described by Sassin and colleagues [66]. PRL secretion showed a nocturnal rise and a robust sleep-independent endogenous circadian rhythm [67]. PRLR expression in human breast cancer is correlated with good prognostic clinicopathological parameters, as expression of PRL pathway-based gene signature comprised of PRL, PRLR, Jak2 and Stat5a showed a notable association with more differentiated tumors [68]. In the regulatory role of the PRLR/PRL system in chondrocyte differentiation of the human synovial fluid, activation increased the expression of extrapituitary PRL and components of ECM including type II collagen and proteoglycans [69]. Together with this evidence, we propose the participation of PRLR in atropine-treated scleral fibroblasts, which has features associated with circadian rhythm and differentiation.
Scleral remodeling occurs as a consequence of increases in cell differentiation changes during myopia development [2,70]. This view is supported by in vivo studies that hypoxia-inducible factor-1α (HIF-1α) was upregulated in the myopic sclera, which promoted myopia through fibroblast-to-myofibroblast transdifferentiation. It was determined that sclera hypoxic stress is a common feature in myopia [70,71]. Aclidinium bromide, a long-acting muscarinic antagonist, was used in COPD patients not only because it reduces mucin hypersecretion, but also due to its inhibition of cigarette smoke-induced lung myofibroblast transdifferentiation. Our study demonstrated that the dysregulated genes were closely related to cell differentiation and functional enrichment showed a significant decrease in oxidative phosphorylation in scleral fibroblasts after atropine treatment. Additionally, chondrogenic differentiation in scleral fibroblasts and scleral stem/progenitor cells was found to play a role in myopia development [72-74]. One of the candidate genes, SRY-Box 6 (SOX6), is a transcriptional activator that is required for the central nervous system development and chondrocyte differentiation with the involvement of bone morphogenetic protein-2 (BMP-2) [74]. Furthermore, SOX6 is expressed at very low levels in the adult brain, but higher in fetal brain and gliomas. It was suggested that upregulation of SOX6 may induce transformation activity in the early stage in gliomas [75]. In contrast, our findings showed that atropine downregulated SOX6 expression in scleral fibroblasts, suggesting the reduced levels of SOX6 expression may contribute to scleral remodeling repression. Moreover, clock gene Period-1 (Per-1) suppresses chondrocytic differentiation through negative regulation of the SOX6 gene [76]. These results imply the association between SOX6 and the circadian rhythm.
The defining feature of the sclera in axial elongation is excessive degrees of thinning, involving both accelerated scleral matrix degradation and slowed production of new ECM [1,77]. The orchestrators of this complex process are the activation of MMPs and decreased activity of TIMPs [3,78]. Reduced production of new ECM is a result of decreased levels of collagen synthesis, particularly type I collagen, and diminished production of proteoglycans and their GAG side chains [12]. At a morphological level, high myopic eyes have collagen fibers of smaller diameter, and fewer collagen fiber bundles [2,79]. Atropine was shown to inhibit GAG synthesis in scleral fibroblasts via a nonmuscarinic mechanism [80]. Acildinium bromide could attenuate collagen type I in CSE-induced lung fibroblasts [15]. According to our NGS data, functional analysis pointed to ECM organization and decreased protein secretion as key contributors in scleral fibroblasts treated with atropine. Our current results revealed three candidate genes that were relevant to cellular structure and organization, including villin 1 (VIL1), semaphorin 6A (SEMA6A), and plexin domain containing 1 (PLXDC1). VIL1 is a member of a family of calcium regulated actin-binding proteins. Induction of cell stress alters the actin cytoskeleton in intestinal epithelial cells via down-regulation in the actin-binding protein VIL1 [81]. Our results are compatible with the changes on VIL1 as it was up-regulated in atropine-treated cells. The SEMA6A gene promotes reorganization of the actin cytoskeleton and act as an axon guidance cue in the developing central nervous system [82]. PLXDC1 is a protein that is highly expressed in the endothelial cells of tumors, and involved in angiogenesis and spinal cord development [83,84]. An in vivo study indicated that highly expressed PLXDC1 may be of consequence in the proliferation and maintenance in neovascular endothelial cells of fibrovascular membranes from patients with proliferative diabetic retinopathy [83]. Our data yielded the downregulation of SEMA6A and PLXDC1 gene, which may also have a hand in retarding the structural reorganization of scleral fibroblasts after atropine treatment. Although the roles of these genes in regulating the cell morphology of scleral fibroblasts remain largely unknown, these atropine-induced gene expression alterations might provide potential targets to reverse scleral remodeling and deserve further studies.
Although miR-2682-5p has no known function [85], it was predicted to target two of our candidate genes, KCNJ5 and PRLR. A recent study reported miR-2682-5p was one of the most abundant miRNAs (95th percentile) in the aqueous humor of exfoliation glaucoma (XFG) patients, but not primary open-angle glaucoma (POAG) patients [86]. The aqueous humor was the target of choice due to its function in maintaining intraocular pressure (IOP) levels in the anterior segment of the eye [87]. In addition, XFG was considered a more severe disease than PAOG, with XFG patients exhibiting higher IOP levels and more difficult to manage clinically [88]. However, the positive association between the expression level of miR-2682-5p and intraocular pressure in glaucoma patients remains inconclusive. Our findings of down-regulated miR-2682-5p in atropine-treated scleral fibroblasts suggested its potential role in ocular anti-remodeling as elevated IOP levels could cause ischemic effects and mechanical stress. Whether the regulation of miR-2682-5p in sclera is mediated by ocular growth and remodeling microenvironment merits further clarification.
The dose of 100μM of atropine was chosen with reference to most published in vitro studies [22,24,25]. As shown in our NGS data, 100μM of atropine did not cause a dramatic change of gene expression in human scleral fibroblasts. Atropine eye drops have long been used for myopia control in children and adolescents [42]. Recently, atropine eye drops at a lower-concentration of 0.01% has been found to be effective in preventing myopia progression as well. Subjects that received low concentration atropine had smaller accommodation amplitude reductions, and smaller pupil dilatations which could minimize the photophobia effects [17]. From a prevention perspective, atropine at a dose of 100 M, equivalent to 0.003%, could potentially induce alterations in the scleral remodeling process, fortunately, with slight changes in gene expression.
Conclusion
In summary, our exploratory study indicated differentially expressed genes were enriched in anti-remodeling effects of scleral fibroblasts, including cell differentiation and structural changes. As atropine for myopia control is typically instilled before bedtime, functionally enriched pathways in inhibiting melatonin-degradation during the night may be partly responsible for reducing scleral remodeling. A focus on the miR-2682-5p-KNCJ5 and miR-2682-5p-PRLR interactions presented a scientific basis to evaluate the participation of low-dose atropine treatment in scleral fibroblasts. The current findings may provide further insight into the benefits of atropine in preventing excessive ocular growth.
Acknowledgements
This study was supported in part by research grants from the Ministry of Science and Technology (MOST 107-2320-B-037-011-MY3; MOST 108-2628-B-037-003), Kaohsiung Medical University Hospital (KMUH10701; KMUH10712), and the Kaohsiung Medical University (KMU-DK108003; KMU-TC108A04). The authors gratefully acknowledge the assistance from the Center for Research and Development of Kaohsiung Medical University (Kaohsiung, Taiwan).
Author Contributions
Y.T.H., W.A.C., M.T.K., J.L., H.C.L., and P.L.K. conceived the study. Y.T.H., W.A.C., Y.J.C, and M.C.Y. analyzed and interpreted the data. Y.T.H. and P.L.K. drafted the manuscript. W.A.C. and P.L.K. revised and edited the manuscript. S.F.J. performed cell culture and laboratory works. All authors read and approved the final version of the manuscript.
Competing Interests
The authors have declared that no competing interest exists.
References
1. MetlapallyR Wildsoet CF. Scleral Mechanisms Underlying Ocular Growth and Myopia. Prog Mol Biol Transl Sci. 2015;134:241-8 doi:10.1016/bs.pmbts.2015.05.005
2. Backhouse S, Gentle A. Scleral remodelling in myopia and its manipulation: a review of recent advances in scleral strengthening and myopia control. Ann Eye Sci. 2018;3:5. doi: 10.21037/aes.2018.01.04
3. Siegwart JT Jr, Norton TT. Selective regulation of MMP and TIMP mRNA levels in tree shrew sclera during minus lens compensation and recovery. Invest Ophthalmol Vis Sci. 2005;46:3484-92 doi:10.1167/iovs.05-0194
4. Rada JA, Shelton S, Norton TT. The sclera and myopia. Exp Eye Res. 2006;82:185-200 doi:10.1016/j.exer.2005.08.009
5. Dolgin E. The myopia boom. Nature. 2015;519:276-8 doi:10.1038/519276a
6. Holden BA, Fricke TR, Wilson DA. et al. Global Prevalence of Myopia and High Myopia and Temporal Trends from 2000 through 2050. Ophthalmology. 2016;123:1036-42 doi:10.1016/j.ophtha.2016.01.006
7. Flitcroft DI, He M, Jonas JB. et al. IMI - Defining and Classifying Myopia: A Proposed Set of Standards for Clinical and Epidemiologic Studies. Invest Ophthalmol Vis Sci. 2019;60:M20-30 doi:10.1167/iovs.18-25957
8. Saw SM, Gazzard G, Shih-Yen EC. et al. Myopia and associated pathological complications. Ophthalmic Physiol Opt. 2005;25:381-91 doi:10.1111/j.1475-1313.2005.00298.x
9. Wakazono T, Yamashiro K, Miyake M. et al. Association between Eye Shape and Myopic Traction Maculopathy in High Myopia. Ophthalmology. 2016;123:919-21 doi:https://doi.org/10.1016/j.ophtha.2015.10.031
10. Srinivasalu N, McFadden SA, Medcalf C. et al. Gene Expression and Pathways Underlying Form Deprivation Myopia in the Guinea Pig Sclera. Invest Ophthalmol Vis Sci. 2018;59:1425-34 doi:10.1167/iovs.16-21278
11. Metlapally R, Park HN, Chakraborty R. et al. Genome-Wide Scleral Micro- and Messenger-RNA Regulation During Myopia Development in the Mouse. Invest Ophthalmol Vis Sci. 2016;57:6089-97 doi:10.1167/iovs.16-19563
12. McBrien NA, Lawlor P, Gentle A. Scleral remodeling during the development of and recovery from axial myopia in the tree shrew. Invest Ophthalmol Vis Sci. 2000;41:3713-9
13. Harper AR, Summers JA. The dynamic sclera: extracellular matrix remodeling in normal ocular growth and myopia development. Exp Eye Res. 2015;133:100-11 doi:10.1016/j.exer.2014.07.015
14. Kistemaker LE, Oenema TA, Meurs H. et al. Regulation of airway inflammation and remodeling by muscarinic receptors: perspectives on anticholinergic therapy in asthma and COPD. Life Sci. 2012;91:1126-33 doi:10.1016/j.lfs.2012.02.021
15. Milara J, Serrano A, Peiró T. et al. Aclidinium inhibits cigarette smoke-induced lung fibroblast-to-myofibroblast transition. Eur Respir J. 2013;41:1264-74 doi:10.1183/09031936.00017712
16. Liu Q, Luo D, Yang T. et al. Protective Effects of Antimuscarinics on the Bladder Remodeling After Bladder Outlet Obstruction. Cell Physiol Biochem. 2017;44:907-19 doi:10.1159/000485358
17. Yam JC, Jiang Y, Tang SM. et al. Low-Concentration Atropine for Myopia Progression (LAMP) Study: A Randomized, Double-Blinded, Placebo-Controlled Trial of 0.05%, 0.025%, and 0.01% Atropine Eye Drops in Myopia Control. Ophthalmology. 2019;126:113-24 doi:10.1016/j.ophtha.2018.05.029
18. Tan D, Tay SA, Loh KL. et al. Topical Atropine in the Control of Myopia. Asia Pac J Ophthalmol. 2016;5:424-8 doi:10.1097/apo.0000000000000232
19. Fang PC, Chung MY, Yu HJ. et al. Prevention of myopia onset with 0.025% atropine in premyopic children. J Ocul Pharmacol Ther. 2010;26:341-5 doi:10.1089/jop.2009.0135
20. Tigges M, Iuvone PM, Fernandes A. et al. Effects of Muscarinic Cholinergic Receptor Antagonists on Postnatal Eye Growth of Rhesus Monkeys. Optom Vis Sci. 1999;76:397-407
21. McBrien NA, Moghaddam HO, Reeder AP. Atropine reduces experimental myopia and eye enlargement via a nonaccommodative mechanism. Invest Ophthalmol Vis Sci. 1993;34:205-15
22. Lin HJ, Wei CC, Chang CY. et al. Role of Chronic Inflammation in Myopia Progression: Clinical Evidence and Experimental Validation. EBioMedicine. 2016;10:269-81 doi:https://doi.org/10.1016/j.ebiom.2016.07.021
23. Tian CL, Wen Q, Fan TJ. Cytotoxicity of atropine to human corneal epithelial cells by inducing cell cycle arrest and mitochondrion-dependent apoptosis. Exp Toxicol Pathol. 2015;67:517-24 doi:10.1016/j.etp.2015.07.006
24. Barathi VA, Kwan JL, Tan QS. et al. Muscarinic cholinergic receptor (M2) plays a crucial role in the development of myopia in mice. Dis Model Mech. 2013;6:1146-58 doi:10.1242/dmm.010967
25. Barathi VA, Weon SR, Beuerman RW. Expression of muscarinic receptors in human and mouse sclera and their role in the regulation of scleral fibroblasts proliferation. Mol Vis. 2009;15:1277-93
26. Huang da W, Sherman BT, Lempicki RA. Systematic and integrative analysis of large gene lists using DAVID bioinformatics resources. Nat Protoc. 2009;4:44-57 doi:10.1038/nprot.2008.211
27. Subramanian A, Tamayo P, Mootha VK. et al. Gene set enrichment analysis: A knowledge-based approach for interpreting genome-wide expression profiles. Proc Natl Acad Sci U S A. 2005;102:15545-50 doi:10.1073/pnas.0506580102
28. Kramer A, Green J, Pollard J Jr. et al. Causal analysis approaches in Ingenuity Pathway Analysis. Bioinformatics. 2014;30:523-30 doi:10.1093/bioinformatics/btt703
29. Zhou Y, Zhou B, Pache L. et al. Metascape provides a biologist-oriented resource for the analysis of systems-level datasets. Nat Commun. 2019;10:1523. doi:10.1038/s41467-019-09234-6
30. Barrett T, Wilhite SE, Ledoux P. et al. NCBI GEO: archive for functional genomics data sets—update. Nucleic Acids Res. 2013;41:D991-5 doi:10.1093/nar/gks1193
31. Vejnar CE, Zdobnov EM. miRmap: Comprehensive prediction of microRNA target repression strength. Nucleic Acids Res. 2012;40:11673-83 doi:10.1093/nar/gks901
32. Agarwal V, Bell G, Nam JW. et al. Predicting effective microRNA target sites in mammalian mRNAs. Elife. 2015;4:doi 10.7554/eLife.05005
33. Paraskevopoulou MD, Georgakilas G, Kostoulas N. et al. DIANA-microT web server v5.0: service integration into miRNA functional analysis workflows. Nucleic Acids Res. 2013;41:W169-73 doi:10.1093/nar/gkt393
34. Tsai MJ, Chang WA, Liao SH. et al. The Effects of Epigallocatechin Gallate (EGCG) on Pulmonary Fibroblasts of Idiopathic Pulmonary Fibrosis (IPF)-A Next-Generation Sequencing and Bioinformatic Approach. Int J Mol Sci. 2019:20 doi:10.3390/ijms20081958
35. Sheu CC, Chang WA, Tsai MJ. et al. Gene Expression Changes Associated with Nintedanib Treatment in Idiopathic Pulmonary Fibrosis Fibroblasts: A Next-Generation Sequencing and Bioinformatics Study. J Clin Med. 2019:8 doi:10.3390/jcm8030308
36. Chen YJ, Chang WA, Hsu YL. et al. Deduction of Novel Genes Potentially Involved in Osteoblasts of Rheumatoid Arthritis Using Next-Generation Sequencing and Bioinformatic Approaches. Int J Mol Sci. 2017:18 doi:10.3390/ijms18112396
37. Bolger AM, Lohse M, Usadel B. Trimmomatic: a flexible trimmer for Illumina sequence data. Bioinformatics. 2014;30:2114-20 doi:10.1093/bioinformatics/btu170
38. Friedländer MR, Mackowiak SD, Li N. et al. miRDeep2 accurately identifies known and hundreds of novel microRNA genes in seven animal clades. Nucleic Acids Res. 2012;40:37-52 doi:10.1093/nar/gkr688
39. Kent WJ, Sugnet CW, Furey TS. et al. The human genome browser at UCSC. Genome Res. 2002;12:996-1006 doi:10.1101/gr.229102
40. Kim D, Langmead B, Salzberg SL. HISAT: a fast spliced aligner with low memory requirements. Nat Methods. 2015;12:357-60 doi:10.1038/nmeth.3317
41. Seko Y, Azuma N, Yokoi T. et al. Anteroposterior Patterning of Gene Expression in the Human Infant Sclera: Chondrogenic Potential and Wnt Signaling. Curr Eye Res. 2017;42:145-54 doi:10.3109/02713683.2016.1143015
42. Kothari M, Rathod V. Efficacy of 1% atropine eye drops in retarding progressive axial myopia in Indian eyes. Indian J Ophthalmol. 2017;65:1178-81 doi:10.4103/ijo.IJO_418_17
43. Wiechmann AF, Summers JA. Circadian rhythms in the eye: the physiological significance of melatonin receptors in ocular tissues. Prog Retin Eye Res. 2008;27:137-60 doi:10.1016/j.preteyeres.2007.10.001
44. Ostrin LA. Ocular and systemic melatonin and the influence of light exposure. Clin Exp Optom. 2019;102:99-108 doi:10.1111/cxo.12824
45. Nickla DL. Ocular diurnal rhythms and eye growth regulation: where we are 50 years after Lauber. Exp Eye Res. 2013;114:25-34 doi:10.1016/j.exer.2012.12.013
46. Martin XD, Malina HZ, Brennan MC. et al. The ciliary body-the third organ found to synthesize indoleamines in humans. Eur J Ophthalmol. 1992;2:67-72
47. Moore RY, Klein DC. Visual pathways and the central neural control of a circadian rhythm in pineal serotonin N-acetyltransferase activity. Brain Res. 1974;71:17-33 doi:10.1016/0006-8993(74)90188-7
48. Alkozi HA, Wang X, Perez de Lara MJ. et al. Presence of melanopsin in human crystalline lens epithelial cells and its role in melatonin synthesis. Exp Eye Res. 2017;154:168-76 doi:10.1016/j.exer.2016.11.019
49. Wiechmann AF, Rada JA. Melatonin receptor expression in the cornea and sclera. Exp Eye Res. 2003;77:219-25
50. Pandi-Perumal SR, Trakht I, Srinivasan V. et al. Physiological effects of melatonin: role of melatonin receptors and signal transduction pathways. Prog Neurobiol. 2008;85:335-53 doi:10.1016/j.pneurobio.2008.04.001
51. Pintor J, Martin L, Pelaez T. et al. Involvement of melatonin MT(3) receptors in the regulation of intraocular pressure in rabbits. Eur J Pharmacol. 2001;416:251-4 doi:10.1016/s0014-2999(01)00864-0
52. Dubocovich ML. Melatonin is a potent modulator of dopamine release in the retina. Nature. 1983;306:782-4 doi:10.1038/306782a0
53. White MP, Fisher LJ. Effects of exogenous melatonin on circadian disc shedding in the albino rat retina. Vision Res. 1989;29:167-79
54. Bai J, Dong L, Song Z. et al. The role of melatonin as an antioxidant in human lens epithelial cells. Free Radic Res. 2013;47:635-42 doi:10.3109/10715762.2013.808743
55. Nickla DL, Rada JA, Wallman J. Isolated chick sclera shows a circadian rhythm in proteoglycan synthesis perhaps associated with the rhythm in ocular elongation. J Comp Physiol A. 1999;185:81-90
56. Lauber JK, Shutze Jv Mcginnis J. Effects of exposure to continuous light on the eye of the growing chick. Proc Soc Exp Biol Med. 1961;106:871-2 doi:10.3181/00379727-106-26505
57. Gottlieb MD, Fugate-Wentzek LA, Wallman J. Different visual deprivations produce different ametropias and different eye shapes. Invest Ophthalmol Vis Sci. 1987;28:1225-35
58. Nickla DL, Totonelly K. Brief light exposure at night disrupts the circadian rhythms in eye growth and choroidal thickness in chicks. Exp Eye Res. 2016;146:189-95 doi:10.1016/j.exer.2016.03.003
59. Corey S, Clapham DE. Identification of native atrial G-protein-regulated inwardly rectifying K+ (GIRK4) channel homomultimers. J Biol Chem. 1998;273:27499-504 doi:10.1074/jbc.273.42.27499
60. Fagerberg L, Hallström BM, Oksvold P. et al. Analysis of the human tissue-specific expression by genome-wide integration of transcriptomics and antibody-based proteomics. Mol Cell Proteomics. 2014;13:397-406 doi:10.1074/mcp.M113.035600
61. Spauschus A, Lentes KU, Wischmeyer E. et al. A G-protein-activated inwardly rectifying K+ channel (GIRK4) from human hippocampus associates with other GIRK channels. J Neurosci. 1996;16:930-8
62. Vouillarmet J, Fernandes-Rosa F, Graeppi-Dulac J. et al. Aldosterone-Producing Adenoma With a Somatic KCNJ5 Mutation Revealing APC-Dependent Familial Adenomatous Polyposis. J Clin Endocrinol Metab. 2016;101:3874-878 doi:10.1210/jc.2016-1874
63. Boulkroun S, Fernandes-Rosa FL, Zennaro MC. Molecular and Cellular Mechanisms of Aldosterone Producing Adenoma Development. Front Endocrinol. 2015;6:95. doi:10.3389/fendo.2015.00095
64. Chen ZT, Wang IJ, Liao YT. et al. Polymorphisms in steroidogenesis genes, sex steroid levels, and high myopia in the Taiwanese population. Mol Vis. 2011;17:2297-310
65. Bole-Feysot C, Goffin V, Edery M. et al. Prolactin (PRL) and Its Receptor: Actions, Signal Transduction Pathways and Phenotypes Observed in PRL Receptor Knockout Mice. Endocr Rev. 1998;19:225-68 doi:10.1210/edrv.19.3.0334
66. Sassin JF, Frantz AG, Weitzman ED. et al. Human prolactin: 24-hour pattern with increased release during sleep. Science. 1972;177:1205-7 doi:10.1126/science.177.4055.1205
67. Waldstreicher J, Duffy JF, Brown EN. et al. Gender differences in the temporal organization of proclactin (PRL) secretion: evidence for a sleep-independent circadian rhythm of circulating PRL levels- a clinical research center study. J Clin Endocrinol Metab. 1996;81:1483-7 doi:10.1210/jcem.81.4.8636355
68. Hachim IY, Shams A, Lebrun JJ. et al. A favorable role of prolactin in human breast cancer reveals novel pathway-based gene signatures indicative of tumor differentiation and favorable patient outcome. Hum Pathol. 2016;53:142-52 doi:10.1016/j.humpath.2016.02.010
69. Ogueta S, Munoz J, Obregon E. et al. Prolactin is a component of the human synovial liquid and modulates the growth and chondrogenic differentiation of bone marrow-derived mesenchymal stem cells. Mol Cell Endocrinol. 2002;190:51-63
70. Wu H, Chen W, Zhao F. et al. Scleral hypoxia is a target for myopia control. Proc Natl Acad Sci U S A. 2018;115:E7091-100 doi:10.1073/pnas.1721443115
71. Francisco BM, Salvador M, Amparo N. Oxidative stress in myopia. Oxid Med Cell Longev. 2015;2015:750637. doi:10.1155/2015/750637
72. Li HH, Huo LJ, Gao ZY. et al. Regulation of scleral fibroblast differentiation by bone morphogenetic protein-2. Int J Ophthalmol. 2014;7:152-6 doi:10.3980/j.issn.2222-3959.2014.01.28
73. Wu PC, Tsai CL, Gordon GM. et al. Chondrogenesis in scleral stem/progenitor cells and its association with form-deprived myopia in mice. Mol Vis. 2015;21:138-47
74. Li H, Cui D, Zhao F. et al. BMP-2 Is Involved in Scleral Remodeling in Myopia Development. PLoS One. 2015;10:e0125219. doi:10.1371/journal.pone.0125219
75. Ueda R, Yoshida K, Kawakami Y. et al. Expression of a transcriptional factor, SOX6, in human gliomas. Brain Tumor Pathol. 2004;21:35-8
76. Le NQ, Binh NT, Takarada T. et al. Negative correlation between Per1 and Sox6 expression during chondrogenic differentiation in pre-chondrocytic ATDC5 cells. J Pharmacol Sci. 2013;122:318-25
77. Gentle A, Liu Y, Martin JE. et al. Collagen gene expression and the altered accumulation of scleral collagen during the development of high myopia. J Biol Chem. 2003;278:16587-94 doi:10.1074/jbc.M300970200
78. Liu HH, Kenning MS, Jobling AI. et al. Reduced Scleral TIMP-2 Expression Is Associated With Myopia Development: TIMP-2 Supplementation Stabilizes Scleral Biomarkers of Myopia and Limits Myopia Development. Invest Ophthalmol Vis Sci. 2017;58:1971-81 doi:10.1167/iovs.16-21181
79. McBrien NA, Cornell LM, Gentle A. Structural and ultrastructural changes to the sclera in a mammalian model of high myopia. Invest Ophthalmol Vis Sci. 2001;42:2179-87
80. Lind GJ, Chew SJ, Marzani D. et al. Muscarinic acetylcholine receptor antagonists inhibit chick scleral chondrocytes. Invest Ophthalmol Vis Sci. 1998;39:2217-31
81. Roy S, Esmaeilniakooshkghazi A, Patnaik S. et al. Villin-1 and Gelsolin Regulate Changes in Actin Dynamics That Affect Cell Survival Signaling Pathways and Intestinal Inflammation. Gastroenterology. 2018;154:1405-20.e1402 doi:10.1053/j.gastro.2017.12.016
82. Prislei S, Mozzetti S, Filippetti F. et al. From plasma membrane to cytoskeleton: a novel function for semaphorin 6A. Mol Cancer Ther. 2008;7:233-41 doi:10.1158/1535-7163.mct-07-0390
83. Yamaji Y, Yoshida S, Ishikawa K. et al. TEM7 (PLXDC1) in neovascular endothelial cells of fibrovascular membranes from patients with proliferative diabetic retinopathy. Invest Ophthalmol Vis Sci. 2008;49:3151-7 doi:10.1167/iovs.07-1249
84. Nanda A, Buckhaults P, Seaman S. et al. Identification of a binding partner for the endothelial cell surface proteins TEM7 and TEM7R. Cancer Res. 2004;64:8507-11 doi:10.1158/0008-5472.can-04-2716
85. Duan J, Shi J, Fiorentino A. et al. A rare functional noncoding variant at the GWAS-implicated MIR137/MIR2682 locus might confer risk to schizophrenia and bipolar disorder. Am J Hum Genet. 2014;95:744-53 doi:10.1016/j.ajhg.2014.11.001
86. Drewry MD, Challa P, Kuchtey JG. et al. Differentially expressed microRNAs in the aqueous humor of patients with exfoliation glaucoma or primary open-angle glaucoma. Hum Mol Genet. 2018;27:1263-75 doi:10.1093/hmg/ddy040
87. Goel M, Picciani RG, Lee RK. et al. Aqueous humor dynamics: a review. Open Ophthalmol J. 2010;4:52-9 doi:10.2174/1874364101004010052
88. Ritch R. The management of exfoliative glaucoma. Prog Brain Res. 2008;173:211-24 doi:10.1016/s0079-6123(08)01115-1
Author contact
![]() Corresponding author: Yi-Jen Chen; chernkmucom; Tel.: +886-7-312-1101 ext. 5962. Po-Lin Kuo; kuopolinnet.tw; Tel.: +886-7-312-1101 ext. 2512-33
Corresponding author: Yi-Jen Chen; chernkmucom; Tel.: +886-7-312-1101 ext. 5962. Po-Lin Kuo; kuopolinnet.tw; Tel.: +886-7-312-1101 ext. 2512-33