Impact Factor ISSN: 1449-1907
- Issue 9; 2026
- Issue 8; 2026
- Issue 7; 2026
- Issue 6; 2026
- Issue 5; 2026
- Volume 23; 2026
- Past Issues
- Editorial Board
- Cover Images
- Index & Coverage
- Cover Suggestion
- Special Issues
Introduction
2. Results
3. Discussion
4. Materials and Methods
5. Conclusions
Acknowledgements
Abbreviations
References

 Global reach, higher impact
Int J Med Sci 2019; 16(12):1583-1592. doi:10.7150/ijms.39158 This issue Cite
Research Paper
Hypoalbuminemia differently affects the serum bone turnover markers in hemodialysis patients
Cai Mei Zheng1,3, Chia Chao Wu4, Chien Lin Lu1,5, Yi Chou Hou1,6, Mai Szu Wu1,3, Yung Ho Hsu1,3, Remy Chen7, Tian Jong Chang8,9, Jia Fwu Shyu1,10, Yuh Feng Lin1,3 ![]() *, Kuo Cheng Lu1,5
*, Kuo Cheng Lu1,5 ![]() *
*
1. Graduate Institute of Clinical Medicine, College of Medicine, Taipei Medical University, Taipei 11031, Taiwan
2. Division of Nephrology, Department of Internal Medicine, School of Medicine, College of Medicine, Taipei Medical University, Taipei 11103, Taiwan
3. Division of Nephrology, Department of Internal Medicine, Shuang Ho Hospital, Taipei Medical University, New Taipei City 235, Taiwan
4. Division of Nephrology, Department of Medicine, Tri-Service General Hospital, National Defense Medical Center, Taipei 114, Taiwan
5. Division of Nephrology, Department of Medicine, Fu Jen Catholic University Hospital, School of Medicine, Fu Jen Catholic University, New Taipei City 242, Taiwan
6. Division of Nephrology, Department of Medicine, Cardinal-Tien Hospital, School of Medicine, Fu Jen Catholic University, New Taipei City 23155, Taiwan
7. Chief, Kidney Dialysis Center, Hasuda Hospital, Negane, Hasuda City, Saitama, 3490131, Japan
8. Graduate Institute of Life Sciences, National Defense Medical Center, Taipei 114, Taiwan
9. Performance Appraisal Section, Secretary Office, Shuang Ho Hospital, Taipei Medical University, Taipei, Taiwan
10. Department of Biology and Anatomy, National Defense Medical Center, Taipei 114, Taiwan
*These authors contributed equally to this work.
Received 2019-8-8; Accepted 2019-10-3; Published 2019-10-21
Abstract
Renal osteodystrophy (ROD) represents bone disorders related to chronic kidney disease (CKD) and several bone biomarkers are used clinically to predict ROD in CKD and hemodialysis (HD) patients. Serum albumin associates with inflammation other than nutritional status in these patients. Chronic inflammation is proved to relate with bone loss, however, the influence of hypoalbuminemia on bone biomarkers is still unclear. In this study, we evaluated the pattern of bone biomarker changes and further studied the influence of hypoalbuminemia on these biomarkers. A total of 300 maintenance HD patients were evaluated and 223 HD patients were included in the study. The patients were grouped according to serum parathyroid hormone (PTH) levels (PTH ≤150 pg/mL, PTH 150-300 pg/mL, PTH 300-600 pg/mL and PTH >600 pg/mL). Bone biomarkers and inflammatory markers were measured and their relation with PTH levels was determined. Significantly increased interleukin-6 (IL-6) and lower albumin levels were noted among PTH>600 pg/mL group. Bone turnover markers were significantly higher in PTH >600 pg/mL group (p< 0.05). Hypoalbuminemia significantly increased the fibroblast growth factor-23 (FGF-23) and procollagen type 1N-terminal propeptide (P1NP) in PTH ≤150 pg/mL, PTH 150-300 pg/mL, PTH 300-600 pg/mL groups, whereas no such relation was noted among PTH> 600 ng/dL group. In conclusion, hypoalbuminemia represents a chronic inflammation which differently relates to bone turnover markers according to serum PTH levels in SHPT patients. Thus, serum albumin measurement should be considered in determining bone disorders among these patients.
Keywords: renal osteodystrophy, hypoalbuminemia, bone turnover markers, inflammation, hemodialysis patients
Introduction
Chronic kidney disease-mineral bone disorder (CKD-MBD) related renal bone disorder, also known as renal osteodystrophy (ROD), is a clinically unique bone disease of CKD and HD patients and distinct from normal aging-related osteoporosis in the general population. ROD relates with abnormalities of bone turnover, mineralization, volume, linear growth, and strength and results in both bone quantity and bone quality loss [1]. Bone biopsy is the gold standard for definitive diagnosis of ROD [2]. Due to its invasive nature, cost and overall complexity, it is rarely done nowadays in clinical practice. Clinically, the fracture risk assessment is done by the quantitative analysis of bone mineral density (BMD) by dual-energy X-ray absorptiometry (DXA). However, DXA only assesses the bone quantity and does not give the information about bone quality. The micro-architectural quality loss including micro-damage and remodeling rates are needed to be identified. Two-dimensional DXA discriminates cortical and cancellous bone by determining the bone geometry. Quantitative computed tomography (QCT) is recently known for more accurate assessment of bone quality [3, 4]. However, these imaging techniques have limited accessibility due to high cost and bulky device. Several bone related biomarkers have been used to determine the bone turnover status in CKD and HD patients. However, these bone turnover markers still lack evidence to represent the bone status in CKD-MBD, which limits these patients from necessary treatments.
Serum intact PTH (iPTH, PTH) has long been regarded as the principal biomarker for assessing the bone turnover in diagnosis and monitoring of ROD [5, 6]. Although PTH is a key player in pathogenesis for SHPT, the measurement of PTH is more reflective of parathyroid activity rather than of the bone status in CKD-MBD [7]. Some studies proved the relation between serum PTH and bone histomorphometric parameters especially the bone formation rate [7-10]. The nature of bone disorders in CKD changes from the predominant “high turnover”/high PTH osteitis fibrosa lesions in the 1960s to 1980s to adynamic bone lesions in 1990 to 2010s due to increased prevalence of aging, diabetes mellitus and increased use of calcium loading phosphate binders [11]. Such a paradigm shifts together with intrinsic low specificity, little relation was noted between serum PTH and bone formation rates except in those with extremes of PTH values (e.g., >600 ng/L and <100 ng/L)[12]. Thus, measuring the serum PTH alone has a higher sensitivity but a lower specificity in assessment of high bone turnover disorders [12, 13]. Many bone turnover markers are under consideration alone or with PTH to determine the turnover status more accurately without renal biopsy, which is painful, invasive and not feasible in clinical grounds.
However, most bone turnover markers are still not widely used due to lack of definitive sensitivity and/or specificity. Total alkaline phosphatase (ALP), bone-specific alkaline phosphatase (BALP),osteocalcin, and procollagen type 1N-terminal propeptide (P1NP) act as bone formation markers and measure osteoblast function [14, 15]. Bone resorption markers such as tartrate-resistant acid phosphatase 5b (TRAP-5b) and C-terminal telopeptides of type I collagen (CTX) represent osteoclast number and function [15]. However, CTX measurement is not recommended in CKD patients due to its abnormal accumulation related with impaired renal function [16]. Serum TRAP-5b concentration is not influenced by kidney function and is regarded as the best bone resorption marker among uremic patients [17, 18]. The receptor activator of nuclear factor NF-κB ligand (RANKL) and its membrane-bound receptor (RANK) in the osteoclast precursor cells [19] determine the osteoclast activation, differentiation and survival [20-22]. Osteoprotegerin (OPG) inhibits bone resorption by binding to RANKL [23, 24] and the balance between levels of OPG and RANKL regulates osteoclastic activity [25]. A disturbance in wingless (wnt) signaling is also noted among CKD patients. Wingless (wnt) signaling regulates the osteoblast differentiation during bone remodeling. Increased osteocytic sclerostin expression and repressed osteocytic wnt/β-catenin signaling associates with low turnover bone status since early CKD [26]. With progressively higher PTH levels, PTH overcomes the peripheral PTH resistance and wnt inhibitors. PTH suppresses skeletal sclerostin expression and generates a high bone turnover state [26]. PTH also mediates the interaction between wnt signaling and its inhibitors sclerostin and Dkk-1. PTH/PTH1R complex binds and phosphorylates the wnt co-receptor LDL-receptor-related protein (LRP-6) and stabilizes β-catenin without any wnt binding [7]. Activation of the PTH receptor down-regulates the sclerostin and Dkk-1 and activates intracellular wnt signal transduction [8-11]. Earlier works [12, 13] revealed that plasma sclerostin levels positively correlated with serum phosphate, FGF23 levels and negatively correlated with PTH levels in hemodialysis patients. Wnt3a and wnt10b, acting through canonical signaling; and wnt16, acting through both canonical and noncanonical signaling, to induce production of OPG in osteoblasts and further inhibits osteoclast differentiation.
Clinically, chronic inflammation plays an important role in development of osteopenia and osteoporosis. Various studies report an increased risk of osteoporosis and bone loss in various inflammatory conditions including gout, osteomyelitis, rheumatoid arthritis, ankylosing spondylitis, etc [27-31]. Inflammatory cytokines such as tumor necrosis factor (TNF)-α and interleukin (IL)-6 are elevated as a result of increased bone resorption [32, 33]. On the other hand, systemic inflammation and serum albumin concentration significantly relate with mortality among CKD and HD patients [34, 35]. HD patients experience the dialysis process associated inflammation [36, 37] in addition to those related with underlying disease conditions. Chronic inflammatory markers such as CRP, IL-6, and TNF-α were elevated in these patients [38]. Clinically, chronic IL-6 elevation is more predictive of inflammation among HD and pre-dialysis CKD populations [39] compared to CRP and TNF-α levels [39]. Hypoalbuminemia is also highly prevalent among HD patients (25-50%) and also associated with high morbidity and mortality [34], and a greater risk of mortality noted particularly when serum albumin <3.8 g/dL [40-42]. Many studies reveal that hypoalbuminemia represents a marker of systemic inflammatory response rather than poor nutrition among dialysis patients [34, 43, 44]. Many comorbid conditions commonly associate with hypoalbuminemia in dialysis patients [45] include diabetes mellitus [46], peripheral vascular disease, smoking, neoplasms, etc. Chronic inflammation and susceptibility to infection relates with increasing resting energy expenditure (REE) and results in body tissue mass wasting and hypoalbuminemia in dialysis patients [47, 48]. Metabolic acidosis suppress albumin synthesis [49] and increase skeletal muscle catabolism [50, 51] in these patients. Analysis of a national dataset find a significantly increased risk of osteoporosis among general population with hypoalbuminemia; with albumin <3.5g/dL patients has 5.37 fold at femoral neck, 12.46 fold at total femur, and 4.59 fold at lumbar spine higher risk of osteoporosis as compared to those with albumin >4 mg/dL [52].
However, how the hypoalbuminemia influences the levels of bone turnover markers in HD patients is still unknown. We studied the HD patients and grouped them according to serum PTH levels and different bone turnover biomarkers were measured. Then, we studied the relation between serum albumin and bone turnover markers. Finally, we hope to predict more accurately about the bone turnover status using these biomarkers in HD patients.
2. Results
2.1. Baseline Patient Characteristics
Table 1 shows the demographic characteristics of the study patients. All the patients were under HD for more than 3 months. Age, sex, dialysis duration and body mass index (BMI) were not significantly different. The patients were sub-grouped according to PTH levels (PTH ≤150 pg/mL, PTH 150-300 pg/mL, PTH 300-600 pg/mL and PTH >600 pg/mL), respectively. Serum albumin level was significantly decreased, whereas inflammatory mediator IL6 was significantly increased among PTH>600 pg/mL group than other PTH groups. Serum phosphate levels and FGF 23 were significantly increased among those with PTH 300-600 pg/mL and PTH >600 pg/mL groups. No significant differences were noted regarding the dialysis adequacy Kt/V and protein intake among different groups. Serum hematocrit, hemoglobin, calcium levels were also not significantly differ.
Demographic data of study patients according to PTH level (N=223).
| Characteristic | PTH ≤150 | PTH 150-300 | PTH 300-600 | PTH >600 | p-value* | |
|---|---|---|---|---|---|---|
| n=59 | n=36 | n=67 | n=61 | |||
| Age (y) | 69.9 ± 11.7 | 70.3 ± 11.2 | 66.6 ± 11.6 | 65.8 ± 13.9 | 0.1817 | |
| Male | 34 (57.6) | 17 (47.2) | 30 (44.7) | 24 (39.3) | 0.351 | |
| Dialysis duration (months) | 91.34±75.25 | 79.63±64.44 | 72.70±59.48 | 73.98±54.63 | 0.337 | |
| BMI (kg/cm) | 22.91±3.52 | 22.86±3.26 | 23.78±4.48 | 23.33±4.96 | 0.564 | |
| Kt/V | 1.48±0.27 | 1.51± 0.21 | 1.49± 0.22 | 1.49± 0.18 | 0.188 | |
| nPCR (g/Kg/day) | 1.27±0.31 | 1.30± 0.32 | 1.28±0.29 | 1.29± 0.33 | 0.254 | |
| Laboratory measurements | ||||||
| Albumin, g/L | 3.6±0.4 | 3.7±0.6 | 3.4±0.4 | 3.3± 0.3ab | <0.0001 | |
| Hematocrit, % | 30.9±4.0 | 31.8±3.7 | 31.9±4.9 | 31.4 ± 4.7 | 0.6127 | |
| Hemoglobin, g/dL | 10.1±1.2 | 10.5±1.2 | 10.6±1.7 | 10.3 ± 1.6 | 0.3662 | |
| Calcium, mg/dL | 8.7±0.7 | 8.9±0.6 | 8.7±0.8 | 8.8 ± 0.9 | 0.6559 | |
| Phosphate (P), mg/dL | 4.1±1.3 | 4.9±1.1a | 5.0±1.3a | 5.1 ± 1.3a | 0.0001 | |
| IL6 (pg/ml) | 4.02± 1.42 | 4.22± 1.48 | 4.52± 2.87 | 5.68± 3.21abc | <0.001 | |
| FGF23 (pg/ml) | 158.3±215.4 | 289.0±563.6 | 471.3±807.1a | 395.3±756.1a | 0.0158 | |
| Bone Turnover Biomarkers | ||||||
| PTH (pg/mL) | 81.9±46.2 | 237.0±42.5a | 412.7±83.2ab | 1086.2 ± 425.1abc | <0.0001 | |
| Alk-P (U/L) | 97.5 ± 72.5 | 90.2 ± 42.8 | 93.3 ± 33.7 | 183.6 ± 242.9abc | 0.0003 | |
| OPG (pmol/L) | 18.2±7.8 | 19.4±7.0 | 16.8±8.7 | 13.4±6.2ab | 0.0005 | |
| RANKL (pmol/L) | 0.083±0.076 | 0.083±0.065 | 0.1±0.1 | 0.080±0.074 | 0.3109 | |
| RANKL / OPG | 0.007±0.001 | 0.005±0.004 | 0.008±0.011 | 0.009±0.010 | 0.427 | |
| SOST (pg/mL) | 161.0±276.4 | 114.2±131.7 | 118.6±115.0 | 97.8±99.6 | 0.7358 | |
| DKK1 (pg/mL) | 296.4±780.0 | 270.6±560.9 | 131.7±184.4 | 161.4±354.9 | 0.283 | |
| Wnt10b (ng/mL) | 3.0±1.4 | 3.4±1.4 | 3.9±1.2a | 4.1±1.1ab | <0.0001 | |
| Wnt16 (pg/mL) | 30.2±29.5 | 29.9±38.9 | 56.9±68.0 | 43.3±58.6 | 0.0876 | |
| P1NP (pg/mL) | 127.9±131.2 | 110.3±150.3 | 153.494±154.886 | 186.0±179.0b | 0.0138 | |
| TRAP-5b (U/L) | 4.9±3.3 | 4.3±2.6 | 4.5±2.1 | 8.2±6.1bc | 0.0045 | |
*Categorical variables: chi-squared test; continuous variables: F test. a p<0.05 v.s iPTH<150; b p<0.05 v.s iPTH 150-300; c p<0.05 v.s iPTH 300-600. PTH, FGF23, RANKL, SOST, TRAP-5b, DKK1 have been log-transformed before analysis.
2.2. Changes in Bone turnover Markers among Different PTH Groups
The bone turnover markers were determined according to PTH levels among these patients (Table 1). Serum Alk-P, OPG, wnt 10b, P1NP and TRAP-5b levels were significantly higher in PTH >600 pg/mL group (p< 0.05) compared to other groups. Other bone markers including wnt 16, sclerostin and DKK1 levels did not differ significantly among various PTH groups (Table 1).
2.3. Relation between Serum Albumin and Inflammatory Markers in Different PTH Groups
A significant negative correlation was noted between IL-6 and serum albumin levels among PTH ≤150 pg/mL, PTH 300-600 pg/mL and PTH >600 pg/mL groups and no relation or a non-significant positive relation was noted in PTH 150-300 pg/mL group(Table 2).
Correlation between Serum Albumin and Bone Turnover Markers.
| Variables | PTH≤150 | PTH 150-300 | PTH 300-600 | PTH >600 | |
|---|---|---|---|---|---|
| IL-6 | -0.231* | 0.084 | -0.217* | -0.316* | |
| FGF23 | -0.445** | -0.320 | -0.421** | 0.073 | |
| Phosphate (P) | 0.125 | 0.022 | -0.057 | -0.142 | |
| Alk-P | -0.220 | -0.358* | -0.143 | -0.073 | |
| P1NP | -0.6*** | -0.282 | -0.241 | 0.013 | |
| TRAP5-b | -0.189 | -0.367 | -0.148 | -0.311 | |
| OPG | 0.344** | 0.41* | 0.257* | 0.006 | |
| RANKL/OPG | -0.301* | -0.337 | -0.205 | 0.18 | |
| Wnt10b | -0.261* | -0.321 | -0.372** | 0.128 | |
| SOST | -0.191 | 0.039 | 0.013 | 0.311* | |
| DKK1 | 0.246 | 0.23 | 0.263* | -0.258 |
Spearman correlation test *p<0.05, **p<0.01, ***p<0.001.
2.4. Relation between Serum Albumin levels and Bone Turnover Markers in Different PTH Groups
Relation between serum albumin levels and bone turnover markers was also evaluated among different PTH groups (Table 2). Bone formation marker total alkaline phosphatase (ALP) was negatively correlated with albumin levels in different PTH groups, however, only significant in PTH 150-300 group. Procollagen type 1 N-terminal propeptide (P1NP) level had a significant negative relation with albumin in PTH<150 group and no significant relation was noted in other groups. No significant relation was noted between bone resorption marker tartrate-resistant acid phosphatase 5b (TRAP-5b) with albumin levels. Osteoclast regulator OPG had a significant positive relation with albumin levels in all PTH groups except PTH>600 group. Similarly, Wnt signaling mediator such as wnt 10b was negatively correlated with albumin in PTH≤ 600 pg/mL groups though significant only in those with PTH <150 and 300-600 groups. Plasma sclerostin levels positively correlated with serum albumin levels in those with PTH>600 pg/mL group alone (Table 2).
We determined the influence of hypoalbuminemia (albumin≤3.5 g/dL) and normoalbuminemia (albumin>3.5 g/dL) on the bone formation and resorption markers in different PTH groups (Table 3). Serum FGF23 levels were significantly increased in hypoalbuminemia PTH 150-300 and 300-600 groups than normoalbuminemia patients. Although not significant, an increased in FGF23 levels were also noted in PTH≤150 pg/mL group. However, no such relation was noted between albumin and FGF23 levels and even became reverse in those with PTH>600 group. Similarly, P1NP levels were found to be significantly increased among those with PTH ≤150 pg/mL, 150-300, 300-600 groups, whereas no significant increase was noted and even lower among those with PTH >600 pg/mL groups. No significant relation was noted between hypoalbuminemia and other bone turnover markers.
Bone Turnover Markers Changes in Hypo- and Normoalbuminemia HD Patients among Different Parathyroid Hormone Levels.
| Variable | PTH≤150 (n=59) | p value* | PTH 150-300 (n=36) | p value* | PTH 300-600 (n=67) | p value* | PTH >600 (n=61) | p value* | ||||||||||||
|---|---|---|---|---|---|---|---|---|---|---|---|---|---|---|---|---|---|---|---|---|
| Albumin≤3.5 (n=27) | Albumin>3.5 (n=32) | Albumin≤3.5 (n=15) | Albumin>3.5 (n=21) | Albumin≤3.5 (n=40) | Albumin>3.5 (n=27) | Albumin≤3.5 (n=48) | Albumin>3.5 (n=13) | |||||||||||||
| mean | ±SD | mean | ±SD | mean | ±SD | mean | ±SD | mean | ±SD | mean | ±SD | mean | ±SD | mean | ±SD | |||||
| Alk-P | 97.7 | ±54.2 | 97.3 | ±85.8 | 0.980 | 109.4 | ±54.1 | 76.4 | ±26.2 | 0.042 | 94.2 | ±37.3 | 92.0 | ±28.1 | 0.794 | 198.2 | ±270.3 | 129.6 | ±69.8 | 0.371 |
| FGF23 | 266.0 | ±271.9 | 67.4 | ±78.7 | 0.001 | 572.3 | ±781.6 | 86.6 | ±158.2 | 0.032 | 657.3 | ±906.4 | 202.8 | ±548.6 | 0.014 | 390.1 | ±839.8 | 414.3 | ±309.1 | 0.920 |
| OPG | 16.3 | ±9.1 | 19.8 | ±6.3 | 0.082 | 16.3 | ±3.8 | 21.6 | ±8.0 | 0.013 | 14.6 | ±7.8 | 20.0 | ±9.2 | 0.017 | 13.1 | ±6.1 | 14.6 | ±6.6 | 0.443 |
| RANKL/OPG | 0.008 | ±0.010 | 0.006 | ±0.008 | 0.277 | 0.005 | ±0.003 | 0.005 | ±0.005 | 0.977 | 0.009 | ±0.014 | 0.006 | ±0.006 | 0.236 | 0.009 | ±0.011 | 0.005 | ±0.006 | 0.229 |
| SOST | 115.1 | ±80.4 | 218.4 | ±404.7 | 0.330 | 102.9 | ±89.2 | 131.7 | ±185.0 | 0.620 | 133.2 | ±129.6 | 91.9 | ±77.7 | 0.210 | 98.5 | ±108.3 | 95.7 | ±67.5 | 0.940 |
| DKK1 | 142.9 | ±210.8 | 241.82 | ±255.10 | 0.266 | 220.1 | ±554.9 | 303.4 | ±576.7 | 0.684 | 604.7 | ±2863.2 | 152.0 | ±127.2 | 0.364 | 187.2 | ±389.6 | 73.3 | ±178.9 | 0.354 |
| Wnt10b | 3.4 | ±1.3 | 2.7 | ±1.4 | 0.066 | 4.0 | ±0.9 | 2.9 | ±1.5 | 0.007 | 4.3 | ±0.8 | 3.2 | ±1.4 | 0.001 | 4.1 | ±1.1 | 4.4 | ±1.2 | 0.293 |
| P1NP | 185.5 | ±139.6 | 53.3 | ±69.4 | 0.001 | 162.3 | ±176.3 | 54.6 | ±93.3 | 0.05 | 183.5 | 164.7 | 96.3 | ±117.5 | 0.021 | 174.2 | ±178.5 | 229.6 | ±181.1 | 0.326 |
| TRAP-5b | 5.0 | ±3.7 | 4.7 | ±0.6 | 0.922 | 4.6 | ±2.6 | 4.3 | ±2.3 | 0.366 | 4.6 | ±1.7 | 4.3 | ±2.7 | 0.768 | 8.5 | ±6.3 | 6.5 | ±5.4 | 0.559 |
* ANCOVA test 2.5. Changes in Bone Turnover Markers According to Serum Albumin levels in Different PTH Groups
3. Discussion
As described, bone turnover disorders are major causes of bone quantity and quality loss among dialysis patients [1]. Serum albumin is a marker of systemic inflammatory status among dialysis patients; and it is well known that hypoalbuminemia independently associated with bone loss among general population [53, 54]. To our knowledge, there is no previous study regarding the influence of hypoalbuminemia on these bone turnover markers among dialysis patients. The present study demonstrated that significant hypoalbuminemia and inflammation occurred among PTH>600 pg/mL group compared to other PTH groups. Bone turnover markers including Alk-P, Wnt 10b, P1NP and TRAP-5b levels were significantly higher in PTH >600 pg/mL group (p< 0.05) as compared to other groups (Table 1). Interestingly, a differential correlation was noted between serum albumin and P1NP levels with a negative relation in PTH≤150 pg/mL, 150-300, 300-600 pg/mL groups, and was reversed in those with PTH>600 pg/mL group (Tables 2 &3). Similar relation was noted between serum albumin and FGF 23 levels (Tables 2 &3). Although PTH>600 pg/mL group had significantly higher FGF23 and P1NP, their levels not relate with serum albumin levels. These findings proved that in patients with PTH≤150 pg/mL, 150-300, 300-600 pg/mL groups, hypoalbuminemia might influence the measurement of FGF23 and P1NP levels. In severe hyperparathyroidism (SHPT) (PTH>600 pg/mL) patients, these levels were elevated regardless of serum albumin levels.
We found that the serum albumin level was significantly decreased and inflammatory mediator IL6 was significantly increased among PTH>600 pg/mL group than other PTH groups. No significant differences were noted regarding the dialysis adequacy Kt/V and protein intake among different groups (Table 1). Thus, protein malnutrition alone can't explain the cause of hypoalbuminemia in dialysis patients. Previous studies revealed that hypoalbuminemia prevalent in ESRD patients resulted from multiple processes including protein energy wasting (PEW) , inflammation and/or plasma volume expansion. Albumin serves as a negative acute-phase reactive protein [55], and its concentration is reduced during inflammation even in the absence of malnutrition [56, 57]. A significant negative association was noted between serum albumin and IL-6 levels in PTH≤150 pg/mL, 300-600 pg/mL and >600 pg/mL groups, whereas no relation or non-significant positive relation in 150-300 pg/mL group (Table 2). Whether other conditions including malnutrition and uremic toxins interplay together in this relation is still unclear. Similar association was also found in a previous study on hemodialysis patients [58] and we deduce that inflammation plays an important role in hypoalbuminemia among our patients.
In consistent with previous studies [59, 60], significantly higher levels of FGF 23 and phosphate are noted in our cohort especially among those with higher PTH levels (Table 1). Increased FGF 23 level in CKD patients is related with stimulation of FGF23 gene expression by PTH [61], loss of FGF 23 transcriptional inhibitors [62] and chronic phosphate load [63]. Normally, FGF23 decrease PTH gene expression and parathyroid cell proliferation [64, 65], however, hyperplastic parathyroid glands in uremia patients resist to FGF23 inhibitory action due to low expression of both klotho and FGF 23-receptor complex [66-68]. A persistently elevated FGF-23 is also responsible for deterioration of bone mineralization [69-71]. Higher PTH groups also revealed higher mean levels of bone formation markers P1NP, Alk-P and bone resorption marker TRAP-5b as a result of increased bone turnover. Progressively higher PTH levels upregulate RANKL m-RNA and inhibit OPG gene expression in bone marrow stromal osteoblasts [72]. Previous studies also noted a significantly increased serum OPG level among predialysis and dialysis patients [73]. An OPG increment in uremic patients might protect against intensive bone loss by inhibiting osteoclastic activity and reducing the RANKL level [74]. We found that the OPG levels significantly lower and RANKL/OPG complex non-significantly higher among PTH>600 group, which explained the resistance for PTH and decreased protection from OPG among those with PTH >600 group. PTH also mediates the interaction between Wnt signaling and its inhibitors sclerostin and Dickkopf-1 (Dkk-1). PTH/PTH1R complex binds and phosphorylates the Wnt co-receptor LDL-receptor-related protein (LRP-6) and stabilizes β-catenin without any Wnt binding [75]. Activation of the PTH receptor down-regulates sclerostin and Dkk-1 and activates intracellular wnt signal transduction [76-79]. Serum sclerostin and DKK1 levels were reduced with increasing PTH levels. Interestingly, we found that Wnt10b levels are proportionately increased with PTH levels. This suggests that a possible compensatory Wnt 10b release in response to PTH occurs among these patients despite previous studies [80, 81] revealed that only intermittent PTH increases Wnt 10b expression. Though metabolomics studies revealed that Wnt 10b was reduced in CKD patients [74], herein, we proved that it was associated with PTH levels. Another bone anabolic Wnt 16 level was reduced among all patients regardless of serum PTH levels. A previous study revealed osteoblast-derived Wnt 16 increased OPG and inhibits osteoclastogenesis [82]. This was not occurred among our hemodialysis patients since we found discordance between Wnt 16 and OPG levels.
Later, we found that serum FGF 23 and P1NP levels were differentially affected by serum albumin levels in various PTH groups (Tables 2 & 3). In patients with ≤150, PTH 150-300, PTH 300-600 groups, a significantly higher FGF23 was noted among hypoalbuminemic patients compared to those with normal albumin levels. This finding might be due to the influence of hypoalbuminemia in disturbance of bone deterioration by increasing FGF23. This was not found in PTH>600 groups which might explain the bone effects related with severely high PTH overcome the hypoalbuminemia. A significant lower OPG level was noted among hypoalbuminemic patients compared with normoalbuminemia in PTH 150-300 and 300-600 groups (Table 3). This explained that the protective actions of OPG on osteoclast inhibition were reduced and osteoclast activity was increased in hypoalbuminemia. It was also evident by increased pro-osteoclastic inflammatory marker IL-6 among our patients. Hypoalbuminemia, a mediator of chronic inflammation, directly activates the osteoclasts and suppress osteogenesis by activating NF-κB signaling pathway [74, 83, 84] together with other inflammatory cytokines. An increase in the RANKL/OPG ratio represents an imbalance between osteoclastic and osteoblastic activity and responsible for increased bone resorption [85]. Characteristically, these patients revealed a significantly higher bone formation marker P1NP than normoalbuminemic ones in all PTH groups except PTH>600 group. Since P1NP representative of osteoblast activity, and it was deduced that higher osteoblastic activities related with hypoalbuminemia among these PTH groups (Table 3). These findings might be explained by the occurrence of osteoblast activation among hypoalbuminemia and related chronic inflammation. This is consistent with a previous study [86], which also proved that elevated inflammatory IL-6 related with osteoblast activation independently and in opposition to PTH actions. With severely high PTH levels (PTH>600), the influence of hypoalbuminemia on P1NP was no longer detected and overwhelmed by influence of PTH and uremic toxins on bone cells.
The study had several limitations. We did not evaluate bone biopsy in our study due to technical feasibility which became major limitation. The results were not applicable to whole HD population due to small sample size.All our patients were Taiwanese HD patients, which also difficult to generalize in other population. However, we found the significant impact of serum albumin levels on hyperparathyroidism bone metabolism. Patients were grouped according to serum PTH levels, which had high sensitivity and low specificity. We measured intact PTH levels (iPTH) which is recently proved to be related more with oxidative stress other than biological PTH activity instead of measuring non-oxidized PTH [7, 87]. However, a discrepancy was noted in our patients with severe PTH>600 group compared to other PTH groups, and this might be explained by a different mechanism other than serum PTH levels. Bone mineral density was also not measured in study; however, our aim was to evaluate the relation between serum albumin and bone markers among these patients, which also did not correctly determine by bone mineral density. The study was a cross-sectional study and not evaluates the progressive changes in bone turnover markers among individual patients. Future studies are required to validate the relation of hypoalbuminemia, inflammation and bone turnover markers among CKD and dialysis patients.
4. Materials and Methods
4.1. Study Patients
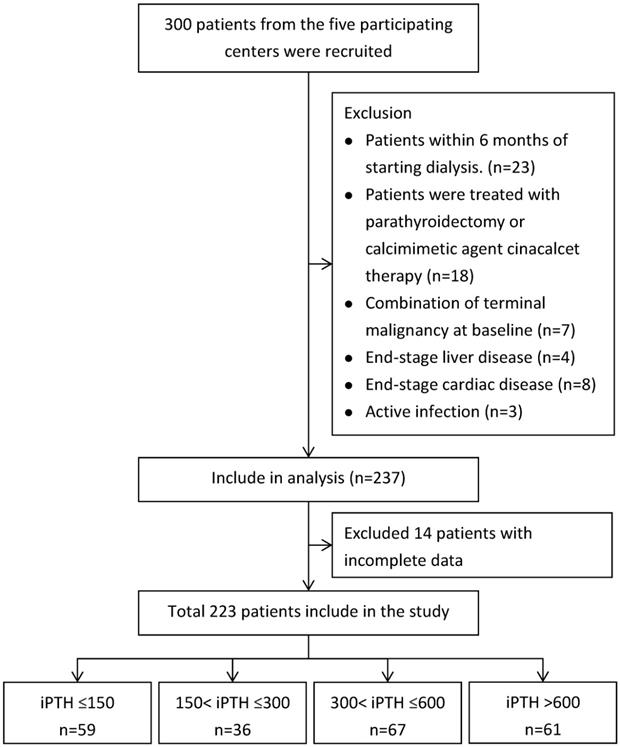
A total of 300 patients undergoing maintenance hemodialysis in Cardinal Tien Hospital, Fu-Jen Catholic University and Shuang-Ho Hospital-Taipei Medical University Hemodialysis Unit were included in the study. 23 patients were excluded because they were within 6 months of starting hemodialysis. A further 18 patients treated with parathyroidectomy or calcimimetic agent cinacalcet therapy were excluded. 22 patients had a limited life expectancy due to one, or a combination of terminal malignancy at baseline (n=7), end-stage liver disease (n=4), end-stage cardiac disease (n=8), active infection (n=3) and 14 patients with missing information about starting dates of dialysis were also excluded. A total of 223 patients met our inclusion criteria and included in the study after informed consent.
The patients were grouped according to PTH levels (PTH≦150, PTH 150-300, PTH 300-600 and PTH>600) (Figure 1). Baseline data and clinical parameters were listed in Table 1. Bone biomarkers including total alkaline phosphatase (Alk-P), Fibroblast growth factor 23 (FGF 23), procollagen type 1 amino-terminal propeptide (P1NP), tartrate-resistant acid phosphatase 5b (TRAP 5b), wingless 10b (wnt 10b), wnt 16, osteoprotegerin (OPG), RANK-L, beta-catenin, DKK-1, sclerostin (SOST) and routine biochemical parameters albumin, hemoglobin, Calcium (Ca), Phosphate (P) and total alkaline phosphatase (Alk-P) were measured and compared the changes according to PTH levels among four groups (Tables 1 & 2). Clinical data including values for urea Kt/V were determined. Dietary protein intake was also determined by calculating protein catabolic rate (PCR) by urea kinetics modeling [88]. Single-pool model urea kinetics was used to estimate the normalized PCR (nPCR). This study was approved by the Human Ethical Committees of Cardinal Tien Hospital, Fu-Jen Catholic University and Shuang Ho Hospital, Taipei Medical University. Written informed consent was obtained from all participants.
Flowchart of Patients Selection.
4.2. Sample collection and biochemical parameters
Clinical characteristics of the patients, including age, gender and dialysis duration were obtained from medical records. Blood samples were collected into EDTA containing tubes and were processed within 1 h after venipuncture. Samples were subsequently centrifuged for 7 min at 1600 g. Concentrations of plasma calcium, phosphate, albumin, alkaline phosphatase (Alk-P) and other biochemistry parameters were measured by standard laboratory techniques with an automatic chemistry analyser (Synchron LXi-725; Beckman Coulter Inc., Brea, CA, USA). White blood cells, haemoglobin, and haematocrit were measured by automated hematology analysers XN 9000 (SYSMEX, KOBE, Japan).
4.3. Cytokines enzyme-linked immunosorbent assay
Plasma cytokine IL-6 was determined Human Instant Enzyme-Linked Immunosorbent Assay (ELISA) kit (eBioscience, San Diego, CA, USA) according to manufacturer's instructions. Serum was also separated to test the bone biomarkers such as wnt 10b, wnt 16, sclerostin (SOST), Dickkopf-related protein 1(DKK-1), Tartrate-resistant acid phosphatase 5b ( TRAP5b), Procollagen 1 N-terminal Propeptide (P1NP) and Fibroblast growth factor 23 (FGF-23) using commercially available ELISAs. (USCN: wnt 10b, P1NP; Cusabio: wnt 16; sclerostin, DKK-1, FGF-23; Quiedl: Trap5b; Biomedica: OPG).
4.4. Statistical analysis
Consistent with the study hypothesis, all analyses were stratified according to PTH. We examined PTH as quartiles: ≤150, 150-300, 300-600, and >600 pg/mL. The characteristics of different PTH groups were compared using the chi-squared test for categorical variables and Student t test or ANOVA test for continuous variables, and using the Spearman correlation test analysis relation between serum albumin and bone turnover markers. The differences between groups were analyzed with the analysis of covariance (ANCOVA) test after adjusting for age and sex. The mean and standard deviation (SD) of each value were calculated for each group. The SPSS 18.0 statistical package was used for all statistical tests. Results with P < 0.05 were considered statistically significant.
5. Conclusions
Hypoalbuminemia, as a marker of chronic inflammation, differentially influences the bone markers OPG and P1NP in hemodialysis patients among different PTH groups. This might be related with inflammation related bone cells activation independent of PTH actions. Interestingly, this association was not seen in those with severely high PTH levels (PTH>600), which might be due to overwhelming effects of PTH and uremic toxins on bone cells. Future studies need to evaluate the validity of serum albumin in determining bone status among CKD and dialysis patients.
Acknowledgements
This study was supported by grants from MOST 1032314-B-567-001-MY3, TMU-IIT-107-010, and 108TMU-SHH-04.
Abbreviations
BMI (kg/cm): body mass index (kilogram/centimeter); Kt/V: dialyzer clearance of urea x dialysis time/volume of distribution of urea; nPCR(g/kg/day) : normalized protein catabolic rate (gram/kilogram/day); IL-6: interleukin-6; FGF-23: Fibroblast Growth Factor 23; PTH: parathyroid hormone; Alk-P: alkaline phosphatase-P; OPG: osteoprotegerin; RANKL: receptor activator of NF-kB ligand; SOST: sclerostin; DKK1: dickkopf-1; Wnt10b: wingless 10b; Wnt16: wingless 16; P1NP: procollagen type 1 N-terminal propeptide; TRAP-5b: tartrate-resistant acid phosphatase 5b.
Competing Interests
The authors have declared that no competing interest exists.
References
1. Zheng CM, Zheng JQ, Wu CC, Lu CL, Shyu JF, Yung-Ho H. et al. Bone loss in chronic kidney disease: Quantity or quality? Bone. 2016;87:57-70
2. Moe S, Drueke T, Cunningham J, Goodman W, Martin K, Olgaard K. et al. Definition, evaluation, and classification of renal osteodystrophy: a position statement from Kidney Disease: Improving Global Outcomes (KDIGO). Kidney international. 2006;69:1945-53
3. Adams JE. Radiogrammetry and radiographic absorptiometry. Radiologic clinics of North America. 2010;48:531-40
4. Lang TF, Guglielmi G, van Kuijk C, De Serio A, Cammisa M, Genant HK. Measurement of bone mineral density at the spine and proximal femur by volumetric quantitative computed tomography and dual-energy X-ray absorptiometry in elderly women with and without vertebral fractures. Bone. 2002;30:247-50
5. Martin KJ, Olgaard K, Coburn JW, Coen GM, Fukagawa M, Langman C. et al. Diagnosis, assessment, and treatment of bone turnover abnormalities in renal osteodystrophy. American journal of kidney diseases: the official journal of the National Kidney Foundation. 2004;43:558-65
6. Coen G, Ballanti P, Bonucci E, Calabria S, Costantini S, Ferrannini M. et al. Renal osteodystrophy in predialysis and hemodialysis patients: comparison of histologic patterns and diagnostic predictivity of intact PTH. Nephron. 2002;91:103-11
7. Qi Q, Monier-Faugere MC, Geng Z, Malluche HH. Predictive value of serum parathyroid hormone levels for bone turnover in patients on chronic maintenance dialysis. American journal of kidney diseases: the official journal of the National Kidney Foundation. 1995;26:622-31
8. Andress DL, Endres DB, Maloney NA, Kopp JB, Coburn JW, Sherrard DJ. Comparison of parathyroid hormone assays with bone histomorphometry in renal osteodystrophy. J Clin Endocrinol Metab. 1986;63:1163-9
9. Solal ME, Sebert JL, Boudailliez B, Marie A, Moriniere P, Gueris J. et al. Comparison of intact, midregion, and carboxy terminal assays of parathyroid hormone for the diagnosis of bone disease in hemodialyzed patients. J Clin Endocrinol Metab. 1991;73:516-24
10. Torres A, Lorenzo V, Hernandez D, Rodriguez JC, Concepcion MT, Rodriguez AP. et al. Bone disease in predialysis, hemodialysis, and CAPD patients: evidence of a better bone response to PTH. Kidney international. 1995;47:1434-42
11. Frazao JM, Martins P. Adynamic bone disease: clinical and therapeutic implications. Curr Opin Nephrol Hypertens. 2009;18:303-7
12. Garrett G, Sardiwal S, Lamb EJ, Goldsmith DJ. PTH-a particularly tricky hormone: why measure it at all in kidney patients? Clin J Am Soc Nephrol. 2013;8:299-312
13. Fletcher S, Jones RG, Rayner HC, Harnden P, Hordon LD, Aaron JE. et al. Assessment of renal osteodystrophy in dialysis patients: use of bone alkaline phosphatase, bone mineral density and parathyroid ultrasound in comparison with bone histology. Nephron. 1997;75:412-9
14. Seibel MJ. Molecular markers of bone turnover: biochemical, technical and analytical aspects. Osteoporos Int. 2000;11(Suppl 6):S18-29
15. Eastell R, Hannon RA. Biomarkers of bone health and osteoporosis risk. Proc Nutr Soc. 2008;67:157-62
16. Reichel H, Roth HJ, Schmidt-Gayk H. Evaluation of serum beta-carboxy-terminal cross-linking telopeptide of type I collagen as marker of bone resorption in chronic hemodialysis patients. Nephron Clin Pract. 2004;98:c112-8
17. Halleen JM, Ylipahkala H, Alatalo SL, Janckila AJ, Heikkinen JE, Suominen H. et al. Serum tartrate-resistant acid phosphatase 5b, but not 5a, correlates with other markers of bone turnover and bone mineral density. Calcif Tissue Int. 2002;71:20-5
18. Malyszko J, Malyszko JS, Pawlak K, Wolczynski S, Mysliwiec M. Tartrate-resistant acid phosphatase 5b and its correlations with other markers of bone metabolism in kidney transplant recipients and dialyzed patients. Adv Med Sci. 2006;51:69-72
19. Asagiri M, Takayanagi H. The molecular understanding of osteoclast differentiation. Bone. 2007;40:251-64
20. Komori T. Functions of the osteocyte network in the regulation of bone mass. Cell Tissue Res. 2013;352:191-8
21. Li J, Sarosi I, Yan XQ, Morony S, Capparelli C, Tan HL. et al. RANK is the intrinsic hematopoietic cell surface receptor that controls osteoclastogenesis and regulation of bone mass and calcium metabolism. Proc Natl Acad Sci U S A. 2000;97:1566-71
22. Teitelbaum SL, Ross FP. Genetic regulation of osteoclast development and function. Nat Rev Genet. 2003;4:638-49
23. Khosla S. Minireview: the OPG/RANKL/RANK system. Endocrinology. 2001;142:5050-5
24. Theoleyre S, Wittrant Y, Tat SK, Fortun Y, Redini F, Heymann D. The molecular triad OPG/RANK/RANKL: involvement in the orchestration of pathophysiological bone remodeling. Cytokine Growth Factor Rev. 2004;15:457-75
25. Hofbauer LC, Khosla S, Dunstan CR, Lacey DL, Boyle WJ, Riggs BL. The roles of osteoprotegerin and osteoprotegerin ligand in the paracrine regulation of bone resorption. J Bone Miner Res. 2000;15:2-12
26. Sabbagh Y, Graciolli FG, O'Brien S, Tang W, dos Reis LM, Ryan S. et al. Repression of osteocyte Wnt/beta-catenin signaling is an early event in the progression of renal osteodystrophy. J Bone Miner Res. 2012;27:1757-72
27. Ginaldi L, Di Benedetto MC, De Martinis M. Osteoporosis, inflammation and ageing. Immunity & ageing: I & A. 2005;2:14
28. Bultink IE, Lems WF, Kostense PJ, Dijkmans BA, Voskuyl AE. Prevalence of and risk factors for low bone mineral density and vertebral fractures in patients with systemic lupus erythematosus. Arthritis and rheumatism. 2005;52:2044-50
29. Cramarossa G, Urowitz MB, Su J, Gladman D, Touma Z. Prevalence and associated factors of low bone mass in adults with systemic lupus erythematosus. Lupus. 2017;26:365-72
30. Mitra D, Elvins DM, Speden DJ, Collins AJ. The prevalence of vertebral fractures in mild ankylosing spondylitis and their relationship to bone mineral density. Rheumatology. 2000;39:85-9
31. Mikuls TR, Saag KG, Curtis J, Bridges SL Jr, Alarcon GS, Westfall AO. et al. Prevalence of osteoporosis and osteopenia among African Americans with early rheumatoid arthritis: the impact of ethnic-specific normative data. Journal of the National Medical Association. 2005;97:1155-60
32. Moschen AR, Kaser A, Enrich B, Ludwiczek O, Gabriel M, Obrist P. et al. The RANKL/OPG system is activated in inflammatory bowel disease and relates to the state of bone loss. Gut. 2005;54:479-87
33. Ishihara K, Hirano T. IL-6 in autoimmune disease and chronic inflammatory proliferative disease. Cytokine & growth factor reviews. 2002;13:357-68
34. Cueto Manzano AM. [Hypoalbuminemia in dialysis. Is it a marker for malnutrition or inflammation?]. Revista de investigacion clinica; organo del Hospital de Enfermedades de la Nutricion. 2001;53:152-8
35. Kalantar-Zadeh K, Block G, McAllister CJ, Humphreys MH, Kopple JD. Appetite and inflammation, nutrition, anemia, and clinical outcome in hemodialysis patients. The American journal of clinical nutrition. 2004;80:299-307
36. Schouten WE, Grooteman MP, van Houte AJ, Schoorl M, van Limbeek J, Nube MJ. Effects of dialyser and dialysate on the acute phase reaction in clinical bicarbonate dialysis. Nephrology, dialysis, transplantation: official publication of the European Dialysis and Transplant Association - European Renal Association. 2000;15:379-84
37. Zaoui P, Hakim RM. The effects of the dialysis membrane on cytokine release. Journal of the American Society of Nephrology: JASN. 1994;4:1711-8
38. Cheung WW, Paik KH, Mak RH. Inflammation and cachexia in chronic kidney disease. Pediatric nephrology. 2010;25:711-24
39. Barreto DV, Barreto FC, Liabeuf S, Temmar M, Lemke HD, Tribouilloy C. et al. Plasma interleukin-6 is independently associated with mortality in both hemodialysis and pre-dialysis patients with chronic kidney disease. Kidney international. 2010;77:550-6
40. Combe C, McCullough KP, Asano Y, Ginsberg N, Maroni BJ, Pifer TB. Kidney Disease Outcomes Quality Initiative (K/DOQI) and the Dialysis Outcomes and Practice Patterns Study (DOPPS): nutrition guidelines, indicators, and practices. Am J Kidney Dis. 2004;44:39-46
41. Pifer TB, McCullough KP, Port FK, Goodkin DA, Maroni BJ, Held PJ. et al. Mortality risk in hemodialysis patients and changes in nutritional indicators: DOPPS. Kidney Int. 2002;62:2238-45
42. Lowrie EG, Lew NL. Death risk in hemodialysis patients: the predictive value of commonly measured variables and an evaluation of death rate differences between facilities. Am J Kidney Dis. 1990;15:458-82
43. Cooper BA, Penne EL, Bartlett LH, Pollock CA. Protein malnutrition and hypoalbuminemia as predictors of vascular events and mortality in ESRD. American journal of kidney diseases: the official journal of the National Kidney Foundation. 2004;43:61-6
44. de Mutsert R, Grootendorst DC, Indemans F, Boeschoten EW, Krediet RT, Dekker FW. et al. Association between serum albumin and mortality in dialysis patients is partly explained by inflammation, and not by malnutrition. Journal of renal nutrition: the official journal of the Council on Renal Nutrition of the National Kidney Foundation. 2009;19:127-35
45. Wang AY, Sanderson J, Sea MM, Wang M, Lam CW, Li PK. et al. Important factors other than dialysis adequacy associated with inadequate dietary protein and energy intakes in patients receiving maintenance peritoneal dialysis. Am J Clin Nutr. 2003;77:834-41
46. Cano NJ, Roth H, Aparicio M, Azar R, Canaud B, Chauveau P. et al. Malnutrition in hemodialysis diabetic patients: evaluation and prognostic influence. Kidney Int. 2002;62:593-601
47. Neyra R, Chen KY, Sun M, Shyr Y, Hakim RM, Ikizler TA. Increased resting energy expenditure in patients with end-stage renal disease. JPEN J Parenter Enteral Nutr. 2003;27:36-42
48. Guarnieri G, Antonione R, Biolo G. Mechanisms of malnutrition in uremia. J Ren Nutr. 2003;13:153-7
49. Ballmer PE, McNurlan MA, Hulter HN, Anderson SE, Garlick PJ, Krapf R. Chronic metabolic acidosis decreases albumin synthesis and induces negative nitrogen balance in humans. J Clin Invest. 1995;95:39-45
50. Hara Y, May RC, Kelly RA, Mitch WE. Acidosis, not azotemia, stimulates branched-chain, amino acid catabolism in uremic rats. Kidney Int. 1987;32:808-14
51. Mitch WE, Maroni BJ. Factors causing malnutrition in patients with chronic uremia. Am J Kidney Dis. 1999;33:176-9
52. Afshinnia F, Pennathur S. Association of Hypoalbuminemia With Osteoporosis: Analysis of the National Health and Nutrition Examination Survey. J Clin Endocrinol Metab. 2016;101:2468-74
53. Afshinnia F, Wong KK, Sundaram B, Ackermann RJ, Pennathur S. Hypoalbuminemia and Osteoporosis: Reappraisal of a Controversy. J Clin Endocrinol Metab. 2016;101:167-75
54. Fisher A, Srikusalanukul W, Fisher L, Smith PN. Lower serum P1NP/betaCTX ratio and hypoalbuminemia are independently associated with osteoporotic nonvertebral fractures in older adults. Clin Interv Aging. 2017;12:1131-40
55. Moshage HJ, Janssen JA, Franssen JH, Hafkenscheid JC, Yap SH. Study of the molecular mechanism of decreased liver synthesis of albumin in inflammation. J Clin Invest. 1987;79:1635-41
56. Jamieson JC, Kaplan HA, Woloski BM, Hellman M, Ham K. Glycoprotein biosynthesis during the acute-phase response to inflammation. Can J Biochem Cell Biol. 1983;61:1041-8
57. Perlmutter DH, Dinarello CA, Punsal PI, Colten HR. Cachectin/tumor necrosis factor regulates hepatic acute-phase gene expression. J Clin Invest. 1986;78:1349-54
58. Kaysen GA, Dubin JA, Muller HG, Rosales L, Levin NW, Mitch WE. et al. Inflammation and reduced albumin synthesis associated with stable decline in serum albumin in hemodialysis patients. Kidney international. 2004;65:1408-15
59. Schneider A, Schneider MP, Krieter DH, Genser B, Scharnagl H, Stojakovic T. et al. Effect of High-Flux Dialysis on Circulating FGF-23 Levels in End-Stage Renal Disease Patients: Results from a Randomized Trial. PLoS One. 2015;10:e0128079
60. Imanishi Y, Inaba M, Nakatsuka K, Nagasue K, Okuno S, Yoshihara A. et al. FGF-23 in patients with end-stage renal disease on hemodialysis. Kidney Int. 2004;65:1943-6
61. Lavi-Moshayoff V, Wasserman G, Meir T, Silver J, Naveh-Many T. PTH increases FGF23 gene expression and mediates the high-FGF23 levels of experimental kidney failure: a bone parathyroid feedback loop. Am J Physiol Renal Physiol. 2010;299:F882-9
62. Quarles LD. Endocrine functions of bone in mineral metabolism regulation. J Clin Invest. 2008;118:3820-8
63. Huitema LF, Apschner A, Logister I, Spoorendonk KM, Bussmann J, Hammond CL. et al. Entpd5 is essential for skeletal mineralization and regulates phosphate homeostasis in zebrafish. Proc Natl Acad Sci U S A. 2012;109:21372-7
64. Krajisnik T, Bjorklund P, Marsell R, Ljunggren O, Akerstrom G, Jonsson KB. et al. Fibroblast growth factor-23 regulates parathyroid hormone and 1alpha-hydroxylase expression in cultured bovine parathyroid cells. J Endocrinol. 2007;195:125-31
65. Ben-Dov IZ, Galitzer H, Lavi-Moshayoff V, Goetz R, Kuro-o M, Mohammadi M. et al. The parathyroid is a target organ for FGF23 in rats. J Clin Invest. 2007;117:4003-8
66. Kumata C, Mizobuchi M, Ogata H, Koiwa F, Nakazawa A, Kondo F. et al. Involvement of alpha-klotho and fibroblast growth factor receptor in the development of secondary hyperparathyroidism. Am J Nephrol. 2010;31:230-8
67. Krajisnik T, Olauson H, Mirza MA, Hellman P, Akerstrom G, Westin G. et al. Parathyroid Klotho and FGF-receptor 1 expression decline with renal function in hyperparathyroid patients with chronic kidney disease and kidney transplant recipients. Kidney Int. 2010;78:1024-32
68. Komaba H, Goto S, Fujii H, Hamada Y, Kobayashi A, Shibuya K. et al. Depressed expression of Klotho and FGF receptor 1 in hyperplastic parathyroid glands from uremic patients. Kidney Int. 2010;77:232-8
69. Wang H, Yoshiko Y, Yamamoto R, Minamizaki T, Kozai K, Tanne K. et al. Overexpression of fibroblast growth factor 23 suppresses osteoblast differentiation and matrix mineralization in vitro. J Bone Miner Res. 2008;23:939-48
70. Sitara D, Kim S, Razzaque MS, Bergwitz C, Taguchi T, Schuler C. et al. Genetic evidence of serum phosphate-independent functions of FGF-23 on bone. PLoS Genet. 2008;4:e1000154
71. Shalhoub V, Ward SC, Sun B, Stevens J, Renshaw L, Hawkins N. et al. Fibroblast growth factor 23 (FGF23) and alpha-klotho stimulate osteoblastic MC3T3.E1 cell proliferation and inhibit mineralization. Calcif Tissue Int. 2011;89:140-50
72. Huang JC, Sakata T, Pfleger LL, Bencsik M, Halloran BP, Bikle DD. et al. PTH differentially regulates expression of RANKL and OPG. J Bone Miner Res. 2004;19:235-44
73. Doumouchtsis K, Perrea D, Doumouchtsis S, Tziamalis M, Poulakou M, Vlachos I. et al. Regulatory effect of parathyroid hormone on sRANKL-osteoprotegerin in hemodialysis patients with renal bone disease. Ther Apher Dial. 2009;13:49-55
74. Cao X, Lin W, Liang C, Zhang D, Yang F, Zhang Y. et al. Naringin rescued the TNF-alpha-induced inhibition of osteogenesis of bone marrow-derived mesenchymal stem cells by depressing the activation of NF-small ka, CyrillicB signaling pathway. Immunol Res. 2015;62:357-67
75. Wan M, Yang C, Li J, Wu X, Yuan H, Ma H. et al. Parathyroid hormone signaling through low-density lipoprotein-related protein 6. Genes Dev. 2008;22:2968-79
76. Kulkarni NH, Halladay DL, Miles RR, Gilbert LM, Frolik CA, Galvin RJ. et al. Effects of parathyroid hormone on Wnt signaling pathway in bone. J Cell Biochem. 2005;95:1178-90
77. Bellido T, Ali AA, Gubrij I, Plotkin LI, Fu Q, O'Brien CA. et al. Chronic elevation of parathyroid hormone in mice reduces expression of sclerostin by osteocytes: a novel mechanism for hormonal control of osteoblastogenesis. Endocrinology. 2005;146:4577-83
78. O'Brien CA, Plotkin LI, Galli C, Goellner JJ, Gortazar AR, Allen MR. et al. Control of bone mass and remodeling by PTH receptor signaling in osteocytes. PLoS One. 2008;3:e2942
79. Keller H, Kneissel M. SOST is a target gene for PTH in bone. Bone. 2005;37:148-58
80. D'Amelio P, Sassi F, Buondonno I, Fornelli G, Spertino E, D'Amico L. et al. Treatment with intermittent PTH increases Wnt10b production by T cells in osteoporotic patients. Osteoporos Int. 2015;26:2785-91
81. Li JY, Walker LD, Tyagi AM, Adams J, Weitzmann MN, Pacifici R. The sclerostin-independent bone anabolic activity of intermittent PTH treatment is mediated by T-cell-produced Wnt10b. J Bone Miner Res. 2014;29:43-54
82. Moverare-Skrtic S, Henning P, Liu X, Nagano K, Saito H, Borjesson AE. et al. Osteoblast-derived WNT16 represses osteoclastogenesis and prevents cortical bone fragility fractures. Nat Med. 2014;20:1279-88
83. Abu-Amer Y. NF-kappaB signaling and bone resorption. Osteoporos Int. 2013;24:2377-86
84. Jimi E, Aoki K, Saito H, D'Acquisto F, May MJ, Nakamura I. et al. Selective inhibition of NF-kappa B blocks osteoclastogenesis and prevents inflammatory bone destruction in vivo. Nat Med. 2004;10:617-24
85. Boyce BF, Xing L. Functions of RANKL/RANK/OPG in bone modeling and remodeling. Arch Biochem Biophys. 2008;473:139-46
86. Eleftheriadis T, Kartsios C, Antoniadi G, Kazila P, Dimitriadou M, Sotiriadou E. et al. The impact of chronic inflammation on bone turnover in hemodialysis patients. Ren Fail. 2008;30:431-7
87. Hocher B, Yin L. Why Current PTH Assays Mislead Clinical Decision Making in Patients with Secondary Hyperparathyroidism. Nephron. 2017;136:137-42
88. Depner TA, Daugirdas JT. Equations for normalized protein catabolic rate based on two-point modeling of hemodialysis urea kinetics. Journal of the American Society of Nephrology: JASN. 1996;7:780-5
Author contact
![]() Corresponding author: linyforg.tw (Y.-F.L.); kuochenglucom (K.-C.L.)
Corresponding author: linyforg.tw (Y.-F.L.); kuochenglucom (K.-C.L.)