Impact Factor ISSN: 1449-1907
- Issue 9; 2026
- Issue 8; 2026
- Issue 7; 2026
- Issue 6; 2026
- Issue 5; 2026
- Volume 23; 2026
- Past Issues
- Editorial Board
- Cover Images
- Index & Coverage
- Cover Suggestion
- Special Issues
Introduction
Materials and Methods
Results
Discussion
Supplementary Material
Acknowledgements
References

 Global reach, higher impact
Int J Med Sci 2019; 16(6):793-799. doi:10.7150/ijms.33967 This issue Cite
Research Paper
A Prediction Model of Essential Hypertension Based on Genetic and Environmental Risk Factors in Northern Han Chinese
Chuang Li1,2, Dongdong Sun1,2, Jielin Liu1,2, Mei Li1,2, Bei Zhang1,2, Ya Liu1,2, Zuoguang Wang1,2, Shaojun Wen1,2, ![]() , Jiapeng Zhou3,4
, Jiapeng Zhou3,4 ![]()
1. Department of Hypertension Research, Beijing Anzhen Hospital, Capital Medical University and Beijing Institute of Herat Lung and Blood Vessel Diseases, Beijing, People's Republic of China
2. Beijing Lab for Cardiovascular Precision Medicine, Beijing, People's Republic of China
3. College of Life Sciences, Hunan Normal University, Changsha, People's Republic of China
4. Beijing Mygenostics Co., Ltd., Beijing, People's Republic of China
Received 2019-2-11; Accepted 2019-4-22; Published 2019-6-2
Abstract
Background: Essential hypertension (EH) is a chronic disease of universal high prevalence and a well-established independent risk factor for cardiovascular and cerebrovascular events. The regulation of blood pressure is crucial for improving life quality and prognoses in patients with EH. Therefore, it is of important clinical significance to develop prediction models to recognize individuals with high risk for EH.
Methods: In total, 965 subjects were recruited. Clinical parameters and genetic information, namely EH related SNPs were collected for each individual. Traditional statistic methods such as t-test, chi-square test and multi-variable logistic regression were applied to analyze baseline information. A machine learning method, mainly support vector machine (SVM), was adopted for the development of the present prediction models for EH.
Results: Two models were constructed for prediction of systolic blood pressure (SBP) and diastolic blood pressure (DBP), respectively. The model for SBP consists of 6 environmental factors (age, BMI, waist circumference, exercise [times per week], parental history of hypertension [either or both]) and 1 SNP (rs7305099); model for DBP consists of 6 environmental factors (weight, drinking, exercise [times per week], TG, parental history of hypertension [either and both]) and 3 SNPs (rs5193, rs7305099, rs3889728). AUC are 0.673 and 0.817 for SBP and DBP model, respectively.
Conclusions: The present study identified environmental and genetic risk factors for EH in northern Han Chinese population and constructed prediction models for SBP and DBP.
Keywords: essential hypertension, prediction model, single nucleotide polymorphism, northern Han Chinese population
Introduction
Essential hypertension (EH), the most common condition seen in primary care, is associated with cardiovascular events, renal failure, and even death if not detected early and treated appropriately [1]. EH has been a serious social and economic burden on a global context for decades due to its incurability and potential risk for causing a variety of complications through end-organ damage in the long run. In China, the incidence and prevalence of EH escalates with each passing year [2]. The adverse impact of hypertension usually takes years or even longer to be observed, and the increased blood pressure (BP) can be undetected for a long time before that. Accumulating evidence has shown that the onset of hypertension can be delayed or even prevented through early lifestyle modifications as well as early medical interventions in normotensive individuals. In this regard, it is crucial to develop a practical and precise risk prediction model to help health care providers to identify individuals with high risk for hypertension and then take preventive strategies to delay or prevent the onset of hypertension, thus to delay or prevent the progression of a number of complications.
Thus far, several risk prediction models for hypertension have been developed in Caucasian, African and Asian population [3-12]. Most of these models take anthropometric indexes and lifestyle-related factors into account. However, studies that include genetic risk factors (mostly single nucleotide polymorphisms [SNPs] of suspected EH related genes) are relatively scarce [9, 10, 12]. And models combine environmental factors with genetic factors are even lesser. It has been well established that EH is a multi-pathogenesis disease, both environmental and genetic factors play critical roles in its pathogenesis. We intend to build a prediction model that consists of not only environmental factors, but also relatively comprehensive genetic factors that are suspected of playing crucial roles in the development of hypertension. And to our knowledge, it is the first prediction model of EH which targets on northern Han Chinese population.
Materials and Methods
Study population
A total of 965 subjects (hypertensive patients [EH group], n = 376; normotensive controls [NT group], n = 589) aged 18 to 70 were screened at the hypertension clinic and physical examination center at Beijing Anzhen Hospital, Capital Medical University, Beijing, China. Written informed consent forms were signed by all participants. BP was measured according to The Seventh Report of the Joint National Committee on Prevention, Detection, Evaluation, and Treatment of High Blood Pressure (JNC-7) [13]. BP was measured for three times by an experienced physician on left arm of seated participants, with feet on the floor, and arm supported at heart level for 5 minutes using a mercury sphygmomanometer. The average of three properly measured BP readings was then calculated as the examination BP. Normotension was defined as systolic blood pressure (SBP) < 120 mm Hg and diastolic blood pressure (DBP) < 80 mm Hg; hypertension was defined as SBP ≥ 140 mm Hg and/or DBP ≥ 90 mm Hg or use of antihypertensive medication. Patients with secondary hypertension, diabetes mellitus and history of severe cardiovascular and cerebrovascular events, renal dysfunction, and other medical conditions that may affect BP in 3 years were excluded.
Measurement of variables
Anthropometry data such as height, weight, waist circumference (WC) and hip circumference (HC) were measured by well-trained staff for all subjects. Body mass index (BMI) was calculated as weight in kilograms divided by the square of height in meters.
Personal information such as sex, age, education status and profession, and lifestyle related information which consists of cigarette smoking, alcohol consumption and exercise habits were collected through a self-reported questionnaire. Personal history of dyslipidemia, stroke and coronary artery disease (CAD), as well as parental history of hypertension, stroke and CAD were also included in the questionnaire. Current smoking was defined as cigarette consumption more than once daily at the time of the examination. Alcohol intake was categorized by frequency, type of drink and the amount of intake. Parental hypertension was defined as documented physician diagnosed hypertension or use of antihypertensive medications on a regular basis. Regular exercise was defined as at least three times per week with an intensity to break into a sweat.
Vein blood samples were obtained in all subjects to measure biochemistry indexes including plasma glucose, serum triglycerides (TG), total cholesterol (TC), high-density lipoprotein cholesterol (HDL-C), low-density lipoprotein cholesterol (LDL-C), uric acid, creatinine and electrolyte levels. A fasting plasma glucose level ≥ 7.0 mmol/L (126 mg/dL) and or use of hypoglycemic drugs defined diabetes mellitus. Dyslipidemia was defined as a TC level ≥5.2 mmol/L, a HDL-C level<1.04 mmol/L, a LDL level ≥3.12 mmol/L, a TG level ≥1.7 mmol/L, or use of anti-dyslipidemia medication.
SNP identification and genotyping
A total of 102 target SNPs with potential association to the pathogenesis of EH was detected in all study participants. These SNPs were selected through screening of Tag SNPs (n = 79); results of genome-wide association studies (GWAS) in East Asians [14] (n = 18); and results of Low-coverage Sequencing performed by our research team in 150 subjects with extreme hypertensive phenotype which defined as the onset of EH at the age of less than 40, no parental EH history, non-smoker, no regular alcohol consumption, with a BMI less than 24 kg/m2 (n = 5). For the screening of tag SNPs, candidate gene approach or related-pathway strategies were used. Candidate genes and EH related pathway genes such as ion channel genes/transport protein genes, and sympathetic nervous system, renin-angiotensin-aldosterone system and endothelial system related genes were identified first. The common SNPs (minor allele frequency [MAF] > 10%) of these suspected genes were subsequently searched from the Han Chinese data sets of the International HapMap Project SNP database (http://www.hapmap.org/, HapMap Genome Browser release #27). The tag SNPs were selected to predict the remaining common SNPs with a r2≥0.80 using Haploview 4.2 software (http://www.broad.mit.edu/mpg/haploview). According to the aforementioned criteria, 79 tag SNPs in these suspected genes were eventually selected. Detailed information of all target SNPs included in present study is reported in Table S1.
Peripheral venous blood sample was collected for all participants after 12-hour overnight fasting and drawn into EDTA-containing receptacles. Genomic DNA was extracted according to a standard phenol-chloroform method and stored at -80℃ for further genotyping. All target SNPs were genotyped for each individual using the TaqMan assay according to the manufacturer's standard protocols.
Statistical analyses
All normally distributed continuous variables are presented as mean ± SD, non-normally distributed continuous variates are presented as median (25 percentile, 75 percentile), and categorical variables are expressed as percentages. Data analyses were performed using SPSS statistical software (version 20.0; SPSS Inc, Chicago, IL). Between groups, categorical variables were compared with chi-square test (Pearson), normally distributed continuous variables were compared with T test and non-normally distributed continuous variables with rank sum test. All suspected potential risk factors were included in a multivariate logistic regression analysis with hypertension status as the dependent variable after adjustment for potential confounding factors. All tests were performed 2-tailed, and P-values less than 0.05 were considered as statistically significant.
As for the prediction models, a machine learning method, mainly support vector machine (SVM) was used for the estimation of EH events and the effect of the risk factors. The “caret” package of R software was used for the construction of the present models. Details for R code and documentation can be found online (https://github.com/topepo/caret/). First of all, univariable analysis was performed for each environmental and genetic variable with SBP and DBP as dependent variable, respectively. Variables with a p value equal to or less than 0.05 were then taken into multivariable regression with SBP and DBP as dependent variable, respectively. During multivariable regression, all data was divided into training set and testing set to repeatedly optimize and verify the prediction model.
Improvement in discrimination was assessed by comparing the area under the receiver operator characteristic curves (AUC) after genetic risk factors were adopted into the present prediction models.
Results
Characteristics of the study population
Several baseline demographic, anthropometric and clinical characteristics of the participants are presented in Table 1. In total, 965 participants (41.8% women) were included in present study, 376 in EH group and 589 in NT group. Mean age is 52.79 ± 8.79 in EH group and 51.55 ± 7.95 in NT group. Male accounts for 59.6% in EH group and 56.9% in NT group. Missing data in each continuous variable account for less than 5% and was filled with mean value in normally distributed continuous variables and with median in non-normally distributed continuous variables.
Baseline Characteristics of the Participants
| Characteristics | EH group (n =376) | NT group (n =589) | Statistics | P value |
|---|---|---|---|---|
| Age, yrs. | 52.79±8.79 | 51.55±7.95 | 1.79 | .151 |
| Sex, Male (n, %) | 224, 59.6% | 335, 56.9% | .69 | .408 |
| BMI, kg/m2 | 26.36±3.67 | 24.82±5.19 | -5.01 | .000 |
| WC, cm | 92.22±8.87 | 86.92±34.26 | -2.93 | .003 |
| SBP, mm Hg | 134.69±17.34 | 116.58±12.81 | -17.41 | .000 |
| DBP, mm Hg | 88.83±38.12 | 73.88±10.07 | -7.41 | .000 |
| FPG, mmol/L | 5.52±2.67 | 5.22±0.7 | -2.16 | .032 |
| TG, mmol/L | 1.57 (1.11, 2.19) | 1.3 (0.89, 1.91) | -4.14 | .000 |
| HDL-C, mmol/L | 1.11±0.54 | 1.2±0.45 | 2.93 | .004 |
| TC, mmol/L | 5.05±1.8 | 5.19±0.96 | 1.53 | .126 |
| LDL-C, mmol/L | 3.25±1.41 | 3.02±0.9 | 2.86 | .004 |
| UA, μmmol/L | 342.45±99.08 | 316.3±78.79 | -4.32 | .000 |
| Creatinine, μmol/L | 75.08±34.99 | 71.39±13.64 | -1.95 | .052 |
| Current smoking (n, %) | 109, 29.0% | 166, 28.2% | .07 | .787 |
| Drinking (n, %) | ||||
| No | 217, 57.7% | 320, 54.3% | 22.79 | .000 |
| Occasional | 62, 16.5% | 168, 28.5% | ||
| Frequent | 97, 25.8% | 101, 17.1% | ||
| Parental history (n, %) | ||||
| Hypertension | ||||
| None | 103, 27.4% | 333, 56.5% | 83.11 | .000 |
| Either | 178, 47.3% | 188, 31.9% | ||
| Both | 95, 25.3% | 68, 11.5% | ||
| DM | 49, 13.0% | 119, 20.2% | 8.21 | .004 |
| CAD | 75, 19.9% | 109, 18.5% | .31 | .578 |
| Stroke | 71, 18.9% | 65, 11.0% | 11.67 | .001 |
| Personal history (n, %) | ||||
| Dyslipidemia | 259, 68.9% | 237, 40.2% | 73.39 | .000 |
| AMI | 7, 1.9% | 5, 0.8% | 1.92 | .166 |
| Stroke | 13, 3.5% | 1, 0.2% | 17.35 | .000 |
| Exercise ≥ 20 minutes (times per week) (n, %) | ||||
| 0 | 31, 8.2% | 92, 15.6% | 77.68 | .000 |
| 1 | 45, 11.9% | 84, 14.3% | ||
| 2 | 22, 5.9% | 69, 11.7% | ||
| 3 | 31, 8.2% | 56, 9.5% | ||
| 4 | 6, 1.6% | 38, 6.5% | ||
| 5 | 24, 6.4% | 68, 11.5% | ||
| 6 | 9, 2.4% | 7, 1.2% | ||
| 7 | 208, 55.3% | 175, 29.7% | ||
| Education status (n, %) | ||||
| Primary school | 10, 3.4% | 8, 1.4% | 51.42 | .000 |
| Middle school | 47, 15.8% | 41, 7.0% | ||
| High school | 69, 23.2% | 66, 11.3% | ||
| Bachelor or above | 171, 57.6% | 469, 80.3% |
Normally distributed continuous variables presented as mean ± SD, non-normally distributed continuous variables presented as median (25 percentile, 75 percentile). BMI: body mass index; WC: waist circumference; SBP: systolic blood pressure; DBP: diastolic blood pressure; FPG: fasting plasma glucose; TG: triglyceride; HDL-C: high-density lipoprotein cholesterol; TC: total cholesterol; LDL-C: low-density lipoprotein cholesterol; UA: uric acid; DM: diabetes mellitus; CAD: coronary artery disease; AMI: acute myocardial infarction.
χ2/t
Comparisons were made using t-test/χ2-test between EH and NT group. As shown in Table 1, there were no statistically significant differences (p > 0.05) between the two groups in terms of age and sex distribution; statistically significant differences (p < 0.05)were found in BMI, SBP, DBP, TG, UA, drinking, parental history of hypertension, personal history of dyslipidemia and stroke between the two study groups. WC (p = .003), Glu (p = .032), HDL-C (p = .004), LDL-C (p = .004), parental history of diabetes mellitus (p=.004) and stroke (p=.001) were also significantly different between two groups.
Multiple logistic regression analysis
Multiple logistic regressions adjusted for confounding factors was performed and the result is presented in Table 2. Occasional drinking which is defined as intake no more than 50 ml of wine per drink for less than 3 times per week turned out to be a protective factor for EH (OR, 0.496[95% CI, 0.328-0.751], p=.001). Parental history of hypertension is a risk factor for EH. In addition, individuals with both parents suffered from hypertension have higher risk for EH (OR, 6.009, [95% CI, 3.782-9.546], p=.000) than that of only one parent had hypertension (OR, 4.051, [95% CI, 2.822-5.814], p=.000). Besides, age, BMI, fasting glucose level, serum uric acid, serum urea, ALT and parental history of DM are significantly associated with hypertension.
Logistic Regression
| COVARIATE | Odds Ratio95% CI | P Value | |
|---|---|---|---|
| Age | 1.060 (1.040 - 1.081) | 0.000 | |
| BMI | 1.083 (1.032 - 1.136) | 0.001 | |
| FPG | 1.339 (1.084 - 1.654) | 0.007 | |
| TG | 1.133 (0.993 - 1.294) | 0.064 | |
| HDL-C | 0.671 (0.441 - 1.021) | 0.062 | |
| LDL-C | 0.744 (0.623 - 0.888) | 0.001 | |
| UA | 1.003 (1.001 - 1.005) | 0.002 | |
| Creatinine | 1.006 (0.999 - 1.012) | 0.108 | |
| CRP | 0.998 (0.956 - 1.042) | 0.931 | |
| ALT | 0.987 (0.976 - 0.997) | 0.015 | |
| Current Smoker | 0.948 (0.649 - 1.387) | 0.784 | |
| Drinking | |||
| Occasional | 0.496 (0.328 - 0.751) | 0.001 | |
| Frequent | 1.113 (0.728 - 1.700) | 0.622 | |
| Parental History | |||
| Hypertension | |||
| Either | 4.051 (2.822 - 5.814) | 0.000 | |
| Both | 6.009 (3.782 - 9.546) | 0.000 | |
| CAD | 0.788 (0.525 - 1.182) | 0.249 | |
| Stroke | 1.278 (0.825 - 1.980) | 0.272 |
OR: odds ratio; CI: confidence interval; BMI: body mass index; FPG: fasting plasma glucose; TG: triglyceride; HDL-C: high-density lipoprotein cholesterol; LDL-C: low-density lipoprotein cholesterol; UA: uric acid; CRP: c-reactive protein; ALT: alanine transaminase; CAD: coronary artery disease.
Association analyses
After univariable analyses, 14 SNPs from 9 genes and 13 SNPs from 7 genes were identified as significantly associated with SBP and DBP, respectively. Among them, there are 6 SNPs (rs1902859, rs212544, rs3827750, rs5193, rs5370, and rs7305099) identified as significantly correlated with both SBP and DBP. Detailed information of these SNPs was presented in Table 3.
Association Analyses
| SNP | CHR | Gene | Functional Consequence | |
|---|---|---|---|---|
| SBP | rs1630736 | 6 | EDN1 | intron variant |
| rs1902859 | 4 | FGF5 (nearby) | n/a | |
| rs2076283 | 1 | ECE1 | intron variant | |
| rs212544 | 1 | ECE1 | intron variant | |
| rs2236847 | 1 | ECE1 | intron variant | |
| rs2336384 | 1 | MFN2 | intron variant | |
| rs2774028 | 1 | ECE1 | intron variant | |
| rs3827750 | 1 | AGT | intron variant | |
| rs4409766 | 10 | BORCS7 | intron variant | |
| rs4980974 | 3 | AGTR1 | intron variant | |
| rs5193 | X | AGTR2 | utr variant 3 prime | |
| rs5370 | 6 | EDN1 | missense | |
| rs6632677 | X | ACE2 | intron variant | |
| rs7305099 | 12 | WNK1 | intron variant | |
| DBP | rs11122575 | 1 | AGT | intron variant |
| rs11608756 | 12 | WNK1 | intron variant | |
| rs1902859 | 4 | FGF5 (nearby) | n/a | |
| rs2074192 | X | ACE2 | intron variant | |
| rs2106809 | X | ACE2 | intron variant | |
| rs212544 | 1 | ECE1 | intron variant | |
| rs2493132 | 1 | AGT | intron variant | |
| rs3827750 | 1 | AGT | intron variant | |
| rs3889728 | 1 | AGT | intron variant | |
| rs4340 | 17 | ACE | 287 bp pathogenic indel | |
| rs5193 | X | AGTR2 | utr variant 3 prime | |
| rs5370 | 6 | EDN1 | missense | |
| rs7305099 | 12 | WNK1 | intron variant |
SNP: single nucleotide polymorphism; CHR: chromosome; SBP: systolic blood pressure; DBP: diastolic blood pressure.
Environmental and genetic risk prediction model for EH
After multivariable analyses, risk prediction models for SBP and DBP were constructed. Prediction model for SBP consists of 6 environmental factors (age, BMI, waist circumference, exercise [times per week], parental history of hypertension [either], parental history of hypertension [both]) and 1 SNP (rs7305099), model for DBP consists of 6 environmental factors (weight, drinking, exercise [times per week], TG, parental history of hypertension [either], parental history of hypertension [both]) and 3 SNPs (rs5193, rs7305099, rs3889728). Detailed information of the models was presented in Table 4.
Prediction model for Essential Hypertension
| Estimate | Std. Error | t value | P value | ||
|---|---|---|---|---|---|
| SBP | Age | 0.696 | 0.114 | 6.104 | 2.04*10-9 |
| BMI | 0.489 | 0.167 | 2.937 | 0.003 | |
| WC | 0.830 | 0.133 | 6.261 | 8.04*10-10 | |
| Exercise (times per week) | -1.163 | 0.311 | 3.740 | 0.000 | |
| Parental history of hypertension (either) | -3.966 | 2.462 | -1.611 | 0.108 | |
| Parental history of hypertension (both) | -12.270 | 2.352 | -5.217 | 2.64*10-7 | |
| rs7305099 (GT) | 3.152 | 1.767 | 1.784 | 0.075 | |
| rs7305099 (TT) | -8.588 | 3.319 | -2.587 | 0.009 | |
| DBP | Weight | 0.309 | 0.082 | 3.768 | 0.000 |
| Drinking | 1.353 | 0.397 | 3.405 | 0.000 | |
| Exercise (times per week) | -0.705 | 0.325 | 2.168 | 0.031 | |
| TG | 1.753 | 0.551 | 3.179 | 0.002 | |
| Parental history of hypertension (either) | -5.652 | 2.806 | -2.014 | 0.045 | |
| Parental history of hypertension (both) | -7.844 | 2.711 | -2.894 | 0.004 | |
| rs5193 (GT) | -8.063 | 4.351 | -1.853 | 0.065 | |
| rs5193 (TT) | 6.707 | 3.272 | 2.050 | 0.041 | |
| rs7305099 (GT) | 4.013 | 1.995 | 2.012 | 0.045 | |
| rs7305099 (TT) | -7.183 | 3.389 | -2.120 | 0.035 | |
| rs3889728 (AG) | -5.219 | 2.196 | -2.377 | 0.018 | |
| rs3889728 (GG) | 0.905 | 2.687 | 0.337 | 0.736 |
SBP: systolic blood pressure; DBP: diastolic blood pressure; BMI: body mass index; WC: waist circumference; TG: triglyceride.
Discrimination
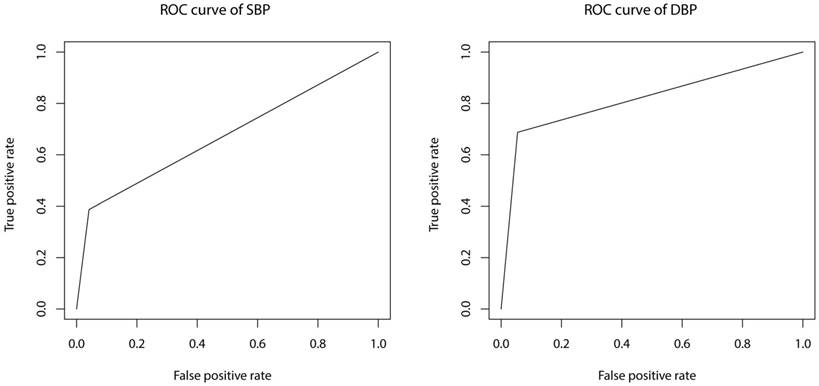
Prediction model constructed with SBP as dependent variable has an accuracy of 84.21% and an adjusted R-square of 0.274. Sensitivity and specificity are 38.71% and 95.87%, respectively. Prediction model constructed with DBP as dependent variable has an accuracy of 88.73% and an adjusted R-square of 0.225. Sensitivity and specificity are 68.75% and 94.55%, respectively. Receiver operator characteristic (ROC) curves of the present models are shown in Figure 1. AUC (area under the curve) are 0.673 and 0.817 for SBP and DBP model, respectively.
ROC curves of SBP and DBP prediction models. ROC: receiver operator characteristic; SBP: systolic blood pressure; DBP: diastolic blood pressure.
Discussion
We constructed prediction models for EH, predictors included in the present models consist of not only genetic risk factors, namely EH-related SNPs, but also nongenetic factors such as anthropometric indexes, personal and family history, and biochemistry indicators.
It is well established that as a multiple pathogenic factors disease, both environmental and genetic factors play critical roles in the onset and progression of EH. It is reasonable and necessary to combine environmental factors with genetic factors to interpret the pathogenesis of EH. To date, it is still under exploration that to what extent genetics can predict the onset of EH [15, 16]. As a polygenetic disease, the onset of EH can hardly be interpreted by individual SNP or SNPs from single gene. Given this, we selected a total of 102 SNPs from 40 suspected genes. We selected SNPs not only from results of GWAS in East Asians, but also from tag SNPs screening using candidate gene approach and related-pathway strategies, as well as the results of our previous research [17-19]. After univariable association analyses of each SNP, 21 SNPs from 10 genes in total were identified as associated with EH in Northern Han Chinese population. Among which, 14 SNPs from 9 genes and 13 SNPs from 7 genes were identified as associated with SBP and DBP, respectively. After the identification of statistically significant genetic and nongenetic covariates, multivariable analyses with the method of SVM, one of the core methods in machine learning was used to construct the present risk prediction models of EH.
China is a multi-nationality country with a heterogeneous genetic background. It has been shown that genetic information varies a lot even between southern and northern Han Chinese populations. We targeted only northern Han Chinese population, which makes the genetic factors of a higher predictive value and thus can interpret the onset of EH more persuasively due to the relative homogeneity among the research groups.
In the present study, through the method of traditional logistic regression, we identified occasional drinking as a protective factor for EH. To our knowledge, several clinical trials have explored the association between alcohol intake and BP. However, the outcomes of these trials are controversial. Meta-analyses showed that alcohol intake is a risk factor for hypertension [20]. However, other clinical trials have shown that the relationship of alcohol consumption and BP appeared J curve. Light-drinkers have lower BP than non-drinkers. The inconsistent results are probably due to the types of drinkers that these studies included are diverse, ranging from social drinkers to alcoholics. And ethnic difference may also play some role in this situation.
As a retrospective cross-sectional study, SBP and DBP were set as dependent variables, then environmental and genetic risk factors were examined through machine learning method with the “caret” package of R software. The main advantage of machine learning for the present study is its ability to compensate the shortness of relatively small sample size. For a machine learning method, it divided all data into training sets and testing sets then training sets were used for the development of the prediction model and testing sets were used to test the accuracy, sensitivity and specificity of the model. As the training and testing accumulated, the model was optimized little by little. Each time the calculation was carried out, weight for each risk factor will be modified and optimized. Hence, instead of putting one fixed weight for each risk factor, our models have ever-changing weights for all variables and will keep optimizing itself through time and the importation of new data.
Our study found that in terms of parental history of hypertension, individuals with both parents who are hypertensive has higher risk for EH than those of single parent who has hypertension (OR, 4.019 vs. 5.714, respectively), and the risk of the latter is still higher than those with no parental history of hypertension. This is in line with the fact that genetic factor plays a critical role in the onset of EH, and this result makes it more necessary to combine environmental and genetic risk factors in the research of EH. Being consistent with results from the traditional statistical method, the final prediction model generated through machine learning method also identified parental history of hypertension as key risk factor and showed the exact same trend in terms of either of or both of the parents suffered from hypertension.
SNPs included in the final model were rs7305099, rs5193, and rs3889728. Among them, rs7305099 is a SNP from WNK1 gene which encodes a member of the WNK subfamily of serine/threonine protein kinases. The encoded protein may be a key regulator of blood pressure by controlling the transport of sodium and chloride ions [21, 22]. rs3889728 is a SNP from AGT gene, a well-established hypertension related gene encodes angiotensinogen. And rs5193, a SNP from AGTR2 gene which encodes angiotensin II type 2 receptor [23].
Major limitation of the present study is that not all the covariates included in the model are of absolute predictive values. SNPs of EH-related genes are inherent and unchangeable, and family histories can also reveal one's genetic background. Thus, to some extent, SNPs and family history can be deemed as factors of absolute predictive value. On the contrary, the causal relationship between some biochemistry indicators and the onset of EH can't be concluded so predictively. Take serum creatinine as an example, it is well established that renal impairment is one of the complications of hypertension which can lead to increased serum creatinine level. However, renal impairment per se can also elevate blood pressure. They can serve as both cause and effect to each other. In terms of these covariates, it is more justified and accurate to regard them as correlated factors of EH rather than as definite predictive factors. In addition, the present included SNPs are definitely not comprehensive to cover all the causative genes of EH. In the long run, with more and more new EH related SNPs being identified, they could be implemented in a better-suited genetic predictive model, improving its predictive value.
Another issue about using SNPs as predictive factors is that none of any SNPs that have been identified so far has a definite relation with the onset of EH. They are more like a bunch of interactive factors working together to create the environment for EH. Hence, in real world situation, we cannot use SNPs alone as an operable method to predict EH among population because no individual carries all pathogenic SNPs at the same time and no single SNP can create an absolute risk for EH. In that case, we still have a long way to go before we can use only genetic background to predict the onset of EH among population.
Lacking external validation is also a limitation of the present study. However, machine learning can be deemed as internal validation to some extent since it consists of multiple data-oriented analyses through randomly splitting the data repeatedly. Even so, the validation and optimization of current model need to be performed in future study. Sample size will be expanded in both study groups to repeat the technological process of the present study to optimize the performance of present predictive models. A cohort consists of baseline normal participants is now being recruited. Current models will be applied to each research subject to get a risk value of EH and then the cohort will be followed up to determine whether they will finally develop into hypertension. Along with the optimization and validation of the current predictive model, the performance of the models will be improved over time.
Supplementary Material
Supplementary table.
Acknowledgements
This work was supported by grants from Natural Science Foundation of Beijing Municipality (7120001).
Competing Interests
The authors have declared that no competing interest exists.
References
1. James PA, Oparil S, Carter BL. et al. 2014 evidence-based guideline for the management of high blood pressure in adults: report from the panel members appointed to the Eighth Joint National Committee (JNC 8). JAMA. 2014;311:507-520
2. Fan G, Wang Z, Zhang L. et al. [Prevalence, awareness, treatment and control of hypertension in rural areas in North China in 2013]. Zhonghua Yi Xue Za Zhi. 2015;95:616-620
3. Parikh NI, Pencina MJ, Wang TJ. et al. A risk score for predicting near-term incidence of hypertension: the Framingham Heart Study. Ann Intern Med. 2008;148:102-110
4. Bozorgmanesh M, Hadaegh F, Mehrabi Y. et al. A point-score system superior to blood pressure measures alone for predicting incident hypertension. J Hypertens. 2011;29:1486-1493
5. Chien KL, Hsu HC, Su TC. et al. Prediction models for the risk of new-onset hypertension in ethnic Chinese in Taiwan. J Hum Hypertens. 2011;25:294-303
6. Fava C, Sjogren M, Montagnana M. et al. Prediction of Blood Pressure Changes Over Time and Incidence of Hypertension by a Genetic Risk Score in Swedes. Hypertension. 2013;61:319-326
7. Lim N, Son K, Lee K. et al. Predicting the Risk of Incident Hypertension in a Korean Middle-Aged Population: Korean Genome and Epidemiology Study. J Clin Hypertens (Greenwich). 2013;15:344-349
8. Choi YH, Chowdhury R, Swaminathan B. Prediction of hypertension based on the genetic analysis of longitudinal phenotypes: a comparison of different modeling approaches for the binary trait of hypertension. BMC Proc. 2014;8(Suppl 1):S78
9. Lim NK, Lee JY, Lee JY. et al. The Role of Genetic Risk Score in Predicting the Risk of Hypertension in the Korean population: Korean Genome and Epidemiology Study. PLoS One. 2015;10:e131603
10. Lu X, Huang J, Wang L. et al. Genetic predisposition to higher blood pressure increases risk of incident hypertension and cardiovascular diseases in Chinese. Hypertension. 2015;66:786-792
11. Otsuka T, Kachi Y, Takada H. et al. Development of a risk prediction model for incident hypertension in a working-age Japanese male population. Hypertens Res. 2015;38:419-425
12. Niiranen TJ, Havulinna AS, Langen VL. et al. Prediction of Blood Pressure and Blood Pressure Change With a Genetic Risk Score. J Clin Hypertens (Greenwich). 2016;18:181-186
13. Chobanian AV, Bakris GL, Black HR. et al. Seventh report of the Joint National Committee on Prevention, Detection, Evaluation, and Treatment of High Blood Pressure. Hypertension. 2003;42:1206-1252
14. Kato N, Takeuchi F, Tabara Y. et al. Meta-analysis of genome-wide association studies identifies common variants associated with blood pressure variation in east Asians. Nat Genet. 2011;43:531-538
15. Padmanabhan S. Prospects for genetic risk prediction in hypertension. Hypertension. 2013;61:961-963
16. Thanassoulis G, Vasan RS. Genetic cardiovascular risk prediction: will we get there? Circulation. 2010;122:2323-2334
17. Wang L, Zhang B, Li M. et al. Association between single-nucleotide polymorphisms in six hypertensive candidate genes and hypertension among northern Han Chinese individuals. Hypertens Res. 2014;37:1068-1074
18. Li M, Zhang B, Li C. et al. The Association of Mitofusion-2 Gene Polymorphisms with Susceptibility of Essential Hypertension in Northern Han Chinese Population. Int J Med Sci. 2016;13:39-47
19. Zhang B, Li M, Wang L. et al. The Association between the Polymorphisms in a Sodium Channel GeneSCN7A and Essential Hypertension: A Case-Control Study in the Northern Han Chinese. Ann Hum Genet. 2015;79:28-36
20. McFadden CB, Brensinger CM, Berlin JA. et al. Systematic review of the effect of daily alcohol intake on blood pressure. Am J Hypertens. 2005;18:276-286
21. Nguyen KH, Pihur V, Ganesh SK. et al. Effects of Rare and Common Blood Pressure Gene Variants on Essential Hypertension. Circ Res. 2013;112:318-326
22. Bergaya S, Faure S, Baudrie S. et al. WNK1 Regulates Vasoconstriction and Blood Pressure Response to α 1 -Adrenergic Stimulation in Mice. Hypertension. 2011;58:439-445
23. Ji LD, Li JY, Yao BB. et al. Are genetic polymorphisms in the renin-angiotensin-aldosterone system associated with essential hypertension? Evidence from genome-wide association studies. J Hum Hypertens. 2017;31:695-698
Author contact
![]() Corresponding authors: Shaojun Wen, Department of Hypertension Research, Beijing Anzhen Hospital, Capital Medical University and Beijing Institute of Heart Lung and Blood vessel Diseases, 2 Anzhen Road, Chaoyang District, Beijing 100029, PR China. Tel: +86-10-64456268; Fax: +86-10-64416527; E-mail: wenshaojunedu.cn. Jiapeng Zhou, College of Life Sciences, Hunan Normal University, Changsha 410006, and Beijing Mygenostics Co., Ltd., Beijing 101318, E-mail: zhoujp111com.
Corresponding authors: Shaojun Wen, Department of Hypertension Research, Beijing Anzhen Hospital, Capital Medical University and Beijing Institute of Heart Lung and Blood vessel Diseases, 2 Anzhen Road, Chaoyang District, Beijing 100029, PR China. Tel: +86-10-64456268; Fax: +86-10-64416527; E-mail: wenshaojunedu.cn. Jiapeng Zhou, College of Life Sciences, Hunan Normal University, Changsha 410006, and Beijing Mygenostics Co., Ltd., Beijing 101318, E-mail: zhoujp111com.