Impact Factor ISSN: 1449-1907
- Issue 8; 2026
- Issue 7; 2026
- Issue 6; 2026
- Issue 5; 2026
- Issue 4; 2026
- Volume 23; 2026
- Past Issues
- Editorial Board
- Cover Images
- Index & Coverage
- Cover Suggestion
- Special Issues
Introduction
Materials and Method
Results
Discussion
Supplementary Material
Abbreviation
Acknowledgements
References

 Global reach, higher impact
Int J Med Sci 2019; 16(3):477-485. doi:10.7150/ijms.29433 This issue Cite
Research Paper
Airway Microbiome in Different Inflammatory Phenotypes of Asthma: A Cross-Sectional Study in Northeast China
Zhiqiang Pang1, Guoqiang Wang1, Peter Gibson2, Xuewa Guan1, Weijie Zhang3, Ruipeng Zheng1,4, Fang Chen1, Ziyan Wang1, Fang Wang1 ![]()
1. Department of Pathogen Biology, College of Basic Medical Sciences, Jilin University, Changchun, China;
2. Department of Respiratory and Sleep Medicine, John Hunter Hospital, Newcastle, Australia;
3. Third Department of Respiratory Disease, Jilin Provincial People's Hospital, Changchun, China;
4. Department of Interventional Therapy, Bethune First Hospital, Jilin University, Changchun, China.
Received 2018-8-23; Accepted 2019-2-14; Published 2019-3-9
Abstract
Background and Objective: Asthma is a common respiratory disease with a high prevalence and morbidity that can seriously affect quality of life. Microbial colonization of the airway may participate in the pathogenesis of asthma, however the mechanisms involved have not been established. In the present study, we aimed to determine the composition of the microbiota in different asthmatic phenotypes from Northeast China.
Methods: 24 mild-to-moderate asthmatics (10 eosinophilic asthma and 14 non-eosinophilic asthma) and 12 healthy volunteers participated in this cross-sectional study. DNA was extracted from their induced sputum and amplified for 16s rRNA gene sequencing on Illumina Miseq platform. Bioinformatic analysis on the microbiome was performed.
Results: Alpha-diversity analysis showed that the asthmatics had a decreased richness, evenness and diversity. Non-eosinophilic asthmatics showed a decreased richness, evenness and diversity compared with eosinophilic patients. A different taxonomy of 1 phylum and 6 genera taxa between the phenotypes was identified. Compared with heathy controls, asthmatics existed a larger taxonomic difference (P<0.05 for both EA and NEA vs. HC). 5 genera as the dominance in the microbial co-occurrence network correlated with the spirometry and disease progression of asthma. The function of microbiota genes was predicted to be related with infectious, immune and metabolic diseases.
Conclusion: The diversity and composition of the airway microbiome was associated with the pathogenesis of asthma in different phenotypes. The diverse composition has been identified in the present study.
Keywords: asthma, microbiota, eosinophils, neutrophils, phenotype
Introduction
Asthma is a chronic heterogeneous disease that manifests as an inflammatory disorder and hyper-responsiveness [1] in the airway. As an immunological disease affecting about 200 million people worldwide [2], asthma has been classified as mild, moderate, and severe according to the Global Initiative for Asthma (GINA) guidelines [3]. Different asthmatics show a distinct, sometimes even completely refractory response to standard therapy and require a large amount of resources for management [4]. Two typical asthmatic phenotypes are eosinophilic asthma (EA) and non-eosinophilic asthma (NEA) [5], consisting of nearly 50% in adult asthmatics for each [6]. EA manifests as an increase of eosinophils in the peripheral blood and sputum [7, 8]. EA also has more severe airway hyperresponsiveness and a higher risk of exacerbation [7]. However, NEA, mainly neutrophilic asthma, usually manifests a poorly controlled status [9]. Environmental factors, such as allergens, bacteria and viruses have been considered as critical inducing factors for asthma [10, 11].
The hygiene hypothesis reported that high microbial exposure could reduce the risk of asthma and is confirmed by more and more evidence [12]. The microbiota in the asthmatic airway is tightly associated with the response to inhaled corticosteroid (ICS) [13, 14]. The composition of the bacterial community is also related to key clinical characteristics of asthma such as worsening Asthma Control Questionnaire 6 (ACQ6) scores and level of protein associated with steroid responsiveness [15]. In addition, some genera such as Moraxella catarrhalis or the Haemophilus genera were also associated with a longer asthma disease duration, worse post-bronchodilator forced expiratory volume in 1 s (FEV1) and higher sputum neutrophil counts [16]. The total abundance of these organisms positively correlates with sputum IL-8 concentration and neutrophil count [16]. Therefore, identifying the etiological role of microorganisms in asthma is critical for understanding the related mechanism and providing a potential therapeutic strategy.
The way in which different microbiota participate in the pathogenesis of asthma, especially in different asthmatic inflammatory phenotypes is still poorly understood. Herein, we investigated the profile of bacterial flora in the lower airway of the characteristic asthmatic phenotypes, analysed their diversity at a taxonomic level, and investigated the interaction of the dominant flora. We tested the hypothesis that the characteristics of the airway microbiome would be different between inflammatory phenotypes of asthma.
Materials and Method
Study Population and Sample Collection
All asthmatic and heathy volunteers were recruited from the Northeast China Severe Asthma Network Centre. All patients were diagnosed as mild to moderate asthma according to the American Thoracic Society guidelines [17] and GINA guidelines [3], based on current respiratory symptoms and evidence from spirometry. The reversibility of FEV1 to salbutamol was more than 12% and 250mL. Current smokers, ex-smokers who had ceased smoking in previous year, and those with a recent respiratory tract infection were excluded. Asthmatics with ACQ6 scores < 1.5 were included. Healthy control (HC) volunteers were not diagnosed with any diseases or any history of chronic lung diseases.
Sputum induction, pre-treatment and sample processing for microbial analysis was performed as described previously [18, 19]. ICS and long acting beta agonists were ceased for 24 hours, then spirometry before and after bronchodilator treatment with salbutamol (2 puffs, 100mcg/puff) was performed according to our standard protocol [19]. Fasting peripheral whole blood and plasma were obtained in morning for full blood count and total IgE quantification. Asthmatic patients were classified as EA and NEA phenotypes according to a previously reported discriminant calculation formula based on the blood cell parameters [20].
The study was approved by the Jilin Province People's Hospital Ethics Committee and registered in the International Clinical Trials Registry Platform and Chinese Clinical Trial Registry (NO. ChiCTR-ROC-16010115). All participants provided written informed consent.
DNA extraction and 16s rRNA gene sequencing
Total DNA was extracted from 100μL sputum aliquots with Omega mag-bind soil DNA kit (Cat.5635). The V3+V4 variable region of 16s rRNA gene was amplified by PCR with a forward primer: ACTCCTACGGGAGGCAGCA and Reverse primer: GGACTACHVGGGTWTCTAAT. PCR products were quantified and mixed using Quant-iT PicoGreen dsDNA kit. Sequencing library was established with Truseq Nano DNA LT Library Prep Kit according to the manufacturer's protocol. After purifying the library system with BECKMAN AMPure XP beads, the quality of the library was assessed with agarose gel electrophoresis. Library with 2nM was sequenced with Illumina Miseq PE250. About 30,000 tags were read for every sample.
Bioinformatical and statistical analysis
All sequencing raw data was deposited into the NCBI Sequence Read Archive database under the BioProject ID number PRJNA412738. The sequencing quality has been filtered by sliding window to ensure the average quality of the base was more than Q20. All demultiplexed paired-end sequencing data were spliced with FLASH (v1.2.7) according to their barcoding indexes. Chimera sequence was removed with USEARCH (v10.0.240). QIIME (v1.8.0) was used to exclude error tags and cluster sequences into operational taxonomic units (OTUs) at 97% threshold. The clustered OTUs were classified against Greengenes Databases (Release 13.8).
After filtering the rare OTUs, which were lower than 0.001%, alpha diversity and beta diversity analysis including Principal component analysis (PCA) was finished with QIIME and R mixOmics package respectively. Metastats analysis of bacterial taxonomy was performed with Mothur (v1.39.5) followed by false discovery rate correction and displayed with Krona (v2.7). Moreover, Partial Least Squares Discriminant Analysis (PLS-DA) has been used to discriminate the clustering effect of different phenotypes. Redundancy Analysis (RDA) was also performed based on different critical clinical factors using R vegan package. In addition, the symbiotic relationship between the microbiota was displayed using Cytoscape (v3.4.0) according to the Spearman's rank correlation coefficient. Metabolic function was predicated with Phylogenetic Investigation of Communities by Reconstruction of Unobserved States (PICRUSt) based on the high-quality tags of the microbiota [21].
Statistical significance of the difference was firstly estimated using the F-test, followed by the Student's or Welch's t-test in two-group analysis according to the homogeneity of variance. Normality was ensured by Kolmogorov-Smirnov test. Mann- Whitney-Wilcoxon test was performed for the dataset, which does not follow the normality. Moreover, a one-way ANOVA test was performed in the analysis among multiple groups. Results with P< 0.05 were considered significant. The statistical analysis was completed with R and statistical figures were prepared with the ggplot2 (v2.2.1) packages. The version of R software used was 3.3.3.
Results
Subjects characteristics
A total of 24 asthmatic patients and 12 healthy subjects were recruited. 10 of the asthmatics were classified as EA and the other patients were NEA according to the clustering formula. The clinical data of the patients are summarized and reported in Table 1. Patients with EA had higher serum total IgE levels. Both EA and NEA showed reduced spirometry and FEV1/FVC ratio compared with HC. Eosinophil counts and ratio in blood displayed a significant systematic eosinophilia accompanied with a lower neutrophil count compared to NEA.
Characteristics of all Subjects
| Phenotypes | Eosinophilic asthma | Non-eosinophilic asthma | Healthy Control |
|---|---|---|---|
| Number of subjects | 10 | 14 | 12 |
| Sex (female/male) | 4/6 | 9/5 | 5/7 |
| Age/years† | 37.30 (30.25, 46.50) | 37.86 (33.00, 46.75) | 41.00 (31.00, 49.75) |
| BMI/(kg·m-2) † | 23.76 (20.18, 26.08) | 24.99 (21.16, 28.03) | 22.93 (22.04, 25.25) |
| Duration of asthma/years† | 3.75 (2.68,5.00) * | 4.10 (2.85, 5.75) * | 0 |
| Serum IgE/(ng·mL-1) † | 202.1 (125.3, 275.5) ** # | 142.2 (62.02, 209.3) | 124.5 (75.89. 133.3) |
| ACQ6† | 0.9520 (0.6700, 1.170) ** | 1.048 (0.7100, 1.290) ** | N/A |
| ICS/(μg·day-1) † ‡ | 570.0 (425.0, 675.0) ** # | 728.6 (600.0, 800.0) ** | 0 (0, 0) |
| FEV1/FVC (%)† | 65.20 (60.25, 70.50) ** | 65.36 (64.00, 69.75) ** | 79.33 (76.48, 83.02) |
| FEV1/FVC (% post) † | 71.60 (64.50, 77.75) | 72.43 (70.00, 78.50) | N/A |
| FEV1 Reversibility (L) † | 0.3880 (0.3375, 0.4225) | 0.4179 (0.3375, 0.4475) | N/A |
| FEV1 Reversibility (%)† | 24.90 (16.50, 31.50) | 30.07 (18.25, 36.00) | N/A |
| White blood cell counts †§ | 7.127 (5.880, 8.482) | 8.299 (5.865, 9.818) | 7.285 (5.888, 8.175) |
| Eosinophil counts†§ | 0.5630 (0.3500, 0.6975) ** ## | 0.1136 (0.0550, 0.1225) | 0.1120 (0.04750, 0.1700) |
| Eosinophil (%)† | 7.990 (59.25, 9.500) ** ## | 1.293 (0.7750, 2.00) | 1.600 (1.000, 2.000) |
| Lymphocyte (%)† | 28.93 (22.32, 35.28) | 25.33 (20.52. 28.97) * | 33.30 (28.00, 39.50) |
| Neutrophil counts†§ | 4.112 (3.320, 5.025) # | 5.689 (3.285, 7.220) * | 4.277 (3.245, 5.042) |
| Neutrophil (%)† | 56.79 (50.82, 59.60) # | 66.64 (62.00, 71.15) * | 58.00 (53.50, 63.75) |
| Score1† | 19.35 (11.50, 21.12) | 9.850 (8.442, 10.26) | N/A |
| Score2† | 24.03 (12.27, 26.85) | 7.214 (5.535, 9.030) | N/A |
† Data are shown as mean (Q1, Q3). ‡ Dosage of inhaled corticosteroid (ICS) was expressed as beclomethasone propionate equivalent dosage. § Unit for cell count is10^9/L. * P < 0.05 vs Healthy control group, **P < 0.01 vs Healthy control group, # P < 0.05 vs Non-eosinophilic asthma group, ##P < 0.01 vs Non-eosinophilic asthma group. BMI, body mass index; ACQ6, asthma control questionnaire 6; FEV1, forced expiratory volume in one second; FVC, forced vital capacity; Both Score1 and Score2 are calculating results of the clustering formula. If Score1 is less than Socre2, clustering the sample as eosinophilic asthma, otherwise as non-eosinophilic asthma.
Alpha-diversity and beta-diversity
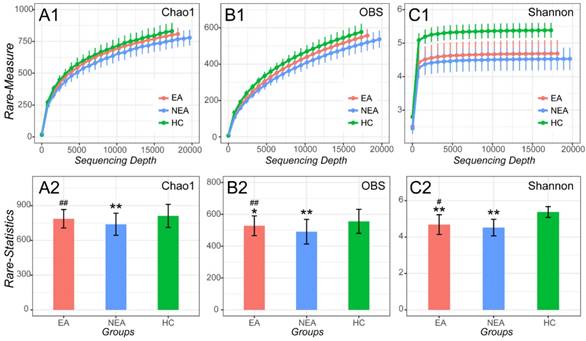
After filtrating the low-quality sequences and chimera, a total of 1,836 OTUs were classified to different taxonomic level (Figure S1). As indicated by the plateau stage of Rarefaction curve (Figure 1) and Species accumulation curve (Figure S2), nearly all taxa have been discovered in present sequencing depth and an appropriate sample size was included in present study. At the sequencing depth of 15,750, we discovered that both EA and NEA showed a significant difference on Chao1, Observed species and Shannon indexes among the three groups. Compared with HC, the asthmatics showed a significant decreased diversity (Observed species index, P<0.05), richness (Chao1 and Shannon indexes, P<0.01) and evenness (Pielou evenness index, P <0.01, Figure S3 and Table S1). As for the asthmatics, NEA showed a significant decreased diversity (P<0.01), richness and evenness (P<0.05) compared with EA.
Alpha-diversity analysis of microbiome in eosinophilic asthma (EA) group, non-eosinophilic asthma (NEA) group and healthy control (HC) group. Rarefaction measure of Chao1 index (A1), Observed species index (OBS, B1) and Shannon index (C1) from sequencing matrix in different sequencing depth. Chao1 index statistics (EA vs NEA P<0.01, NEA vs HC P<0.01) (A2), Observed species index statistics (EA vs NEA P<0.01, EA vs HC P<0.05, NEA vs HC P<0.01) (B2) and Shannon index statistics (EA vs NEA P<0.05, EA vs HC P<0.01, NEA vs HC P<0.01) (C2) from matrix sequencing at the depth of 15,750. **, P<0.01 vs HC. #, P<0.05 vs NEA. ##, P<0.01 vs NEA.
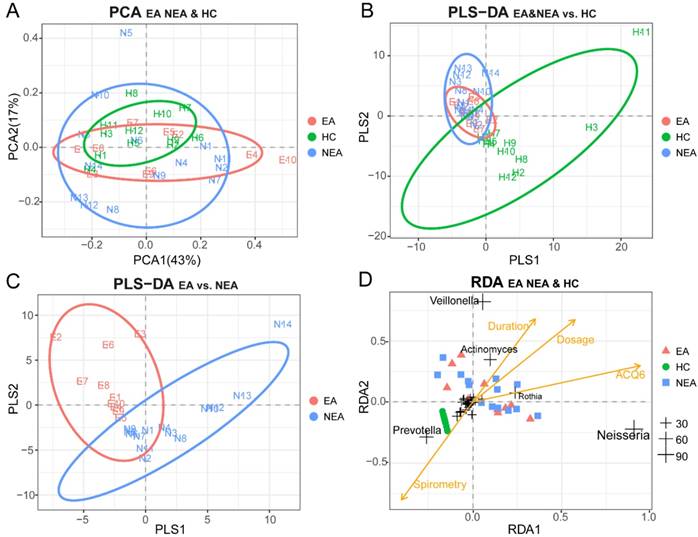
PCA was used as a mathematic method to lower the OTU matrix dimension, intuitively showed us the similarity of the dominant microbiota in all groups (Figure 2A). But PLS-DA visually displayed the reliability of the supervised clustering model and indicated that there existed the microbial difference between asthmatics and healthy controls (Figure 2B) and between the inflammatory phenotypes (Figure 2C). Adonis/PERMANOVA also claimed a significant difference among the three groups (P=0.003, Table S2). RDA reported that the dose of ICS, ACQ6 and the duration of asthma showed an obvious positive correlation between themselves and a significant negative correlation with spirometry. The nearly random distribution of the asthmatics indicted that, in present study, what influenced the difference of the microbiota between the inflammatory groups was not clinical characteristics of the patients but the phenotypes. In addition, it is also obvious that Prevotella is positively correlated with spirometry, but Veillonella, Actinomyces, Rothia and Neisseria seem to be associated tightly with the disease progression of asthma (Figure 2D).
Beta-diversity analysis of microbiome in eosinophilic asthma (EA) group, non-eosinophilic asthma (NEA) group and healthy control (HC) group. (A) Display of Principal Component Analysis (PCA) of the samples in two-dimension (PC1=43%, PC2=17%). Partial Least Squares Discriminant Analysis (PLS-DA) of all samples under the supervision of (B) the three groups and (C) the different inflammatory phenotypes. (D) Redundancy Analysis (RDA) of all samples and all microbial genera with four potential environment factors (Dose represents the dose of ICS, ACQ6 represents the score of Asthma Control Questionnaire 6 system, Duration of asthma means the duration of asthma history, Spirometry was the ratio of FEV1 and FVC). The genera located at the centre of the RDA are not labelled for their non-obvious associations with the clinical characteristics. EA, NEA and HC are further abbreviated as E, N, H in the panels respectively. The numeric values of the genera in RDA are the sum of RDA1 and RDA2 (%).
Distribution of taxa in different taxonomic level
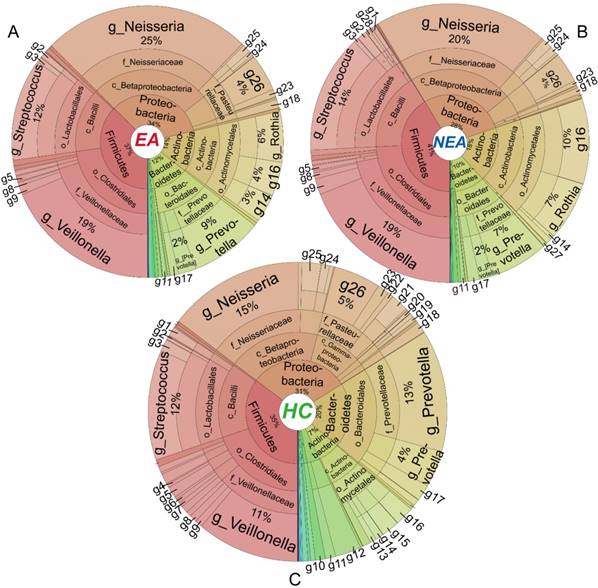
Metastats' analysis identified a different distribution of 1 phylum and 6 genera taxa between EA and NEA. Besides, compared with HC, EA showed 5 different phyla and 30 genera, while NEA showed 7 different phyla and 43 genera. All statistically different taxa are displayed in Figure S4-S5 with their content levels in Table S3-S4. The entire bacterial taxonomic composition of all groups is displayed in Figure 3. In general, Proteobacteria, Firmicutes, Actinobacteria and Bacteroidetes phyla exceeded over 98% in all groups. The first 50 dominant genera of all groups were clustered in a Heatmap (Figure S6). The 6 genera that varied between EA and NEA composed about 0.04% for both groups. Glaciecola and Helicobacter were more abundant, but Deinococcus, Scardovia, Bifidobacterium and Desulfobulbus were less abundant in EA.
Taxa distribution of the whole microbiota. Krona projections of the microbiome in different taxonomic level of eosinophilic asthma (EA) group (A), non-eosinophilic asthma (NEA) group (B) and healthy control (HC) group (C). As shown in this figure visually, asthmatics displayed a significant decreased diversity, richness and evenness. The angle of the sector represents the percent of each taxonomic level. It is phylum (p), class (c), order (o), family(f), genus(g) respectively from centre to border respectively. Different symbol in every panel was interpreted as follows. g1: Geobacillus, g2: Granulicatella, g3: Lactococcus, g4: Filifactor, g5: Peptostreptococcus, g6: Catonella, g7: Oribacterium, g8: Megasphaera, g9: Selenomonas, g10: TG5, g11: Leptotrichia, g12: Fusobacterium, g13: Rhodococcus, g14: Corynebacterium, g15: Rothia, g16: Actinomyces, g17: Porphyromonas, g18: Campylobacter, g19: Ochrobactrum, g20: Rhodanobacter, g21: Moraxella, g22: Actinobacillus, g23: Aggregatibacter, g24: Lautropia, g25: Ralstonia, g26: Haemophilus, g27: Atopobium, g28: Lactobacillus.
Network and KEGG metabolite analysis
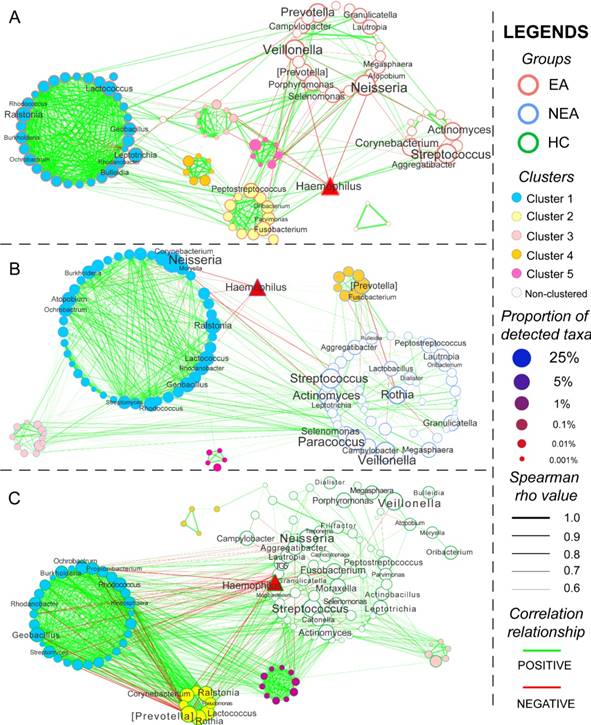
The co-occurrence network of every group was constructed based on Spearman's rank correlation coefficient of all genera, whose rho values were more than 0.6 and P < 0.05 (Figure 4). Several genera were differentially abundant. In total, 564 pairs of correlated symbiotic relationships in EA, 601 pairs in NEA and 1,009 pairs in HC composed the networking patterns. Besides, 5 clusters in EA, 4 clusters in NEA and 5 clusters in HC were identified within the networks. Some potential or opportunistic pathogenic bacteria such as Haemophilus, Prevotella, Actinomyces, Streptococcus, Rothia and Neisseria also showed different networking relationship in different groups.
Network analysis and the metabolic prediction of microbiome. The networking pattern of all genera in eosinophilic asthma (EA) group (A), non-eosinophilic asthma (NEA) group (B) and healthy control (HC) group (C) under the criteria of rho > 0.6 and P < 0.05. (Green line represents the positive correlation and red line represents the negative correlation. The size of the point in the network represents the relative abundance of different genera in every groups. All clusters are coloured and displayed with circular layout in the three groups. The red triangle represents a critical genus reported extensively.)
The microbiota function analysis revealed that genes of the microbial flora with the changed composition might be related with many diseases, such as infectious diseases (NEA vs HC, P=0.06), immune system diseases (NEA vs HC, P=0.07), and metabolic diseases (EA vs HC, P=0.054 and NEA vs HC, P=0.06). It seems to be significantly associated with the regulation of immune system (EA vs HC and NEA vs HC, P<0.01) and digestive system (NEA vs HC, P=0.014). Besides, genes of the floras may also be related with many other cellular and genetic signalling processes (Table S5).
Discussion
This study reports the airway microbiome changes in asthmatic patients from Northeast China. We characterised asthmatics into inflammatory phenotypes and demonstrated that the NEA phenotype had decreased microbiome diversity, richness and evenness when compared to EA. We also found general structural differences of the microbiota between the EA, NEA and HC groups in different taxonomic levels. 5 genera were tightly associated with spirometry and diseases progression of asthmatics. These potential pathogens coordinated differentially with other genera in the symbiotic patterns indicating their unique roles in asthmatic phenotypes.
The heterogeneity of asthma is responsible for the failure of asthma therapy. Increasing research has shown that the microbiota in the lower airway plays a critical role in the complex pathological process of asthma [18, 22, 23]. In this study, we have focused on the typical asthma phenotypes, including eosinophilic asthma and non-eosinophilic asthma, which is usually refractory to standard therapy [24]. The significantly higher average ICS dosage in NEA confirmed the refractory nature of this phenotype. Besides the significant eosinophilia, the higher total IgE level also indicated an atopic status in EA. While the different clinical outcomes can be attributed to many factors, the aim of present study was to evaluate the characteristics of microbiome in different inflammatory phenotypes of asthma.
Statistic Content level of the distinct genera between the phenotypes
| Genera | Levels | Fold (EA/NEA/HC) § | P values† |
|---|---|---|---|
| Bifidobacterium | N>E≈H | 0.89/1.2/1.0 | <0.05 |
| Desulfobulbus | N>E≈H | 0.57/1.3/1.0 | <0.001 |
| Scardovia | H≈N>E | 0.44/0.96/1.0 | <0.05 |
| Deinococcus | H≈N>E | 0.067/0.89/1.0 | <0.05 |
| Glaciecola | E>N≈H | 16/1.0/1.0 | <0.001 |
| Helicobacter | E>H>N | 1.5/0.091/1.0 | <0.01 |
† P values were calculated statistically and followed by False Discovery Rate (FDR) for comparison between the phenotypes. § The changed fold values of distinct phyla were the ratios of the logarithmic transformation on the respective OTU ratios.
Different from sputum cell counts, the method in present study for phenotyping was based on the morning fasting blood inflammatory cell counts, which reflected systemic inflammation and avoided the instability and low quality of sputum cell counts. Similar researches in this field have mainly concentrated on the microbial distinction in severe asthmatics with different inflammatory phenotypes or asthmatics with different severity [15, 18, 25, 26]. However, in present study we paid our attention to the microbiota in mild to moderate asthmatics with different inflammatory phenotypes. Our results showed a lower diversity, richness and evenness of microbiota in asthmatics, that is consistent with the previous report [19]. It has also been reported that airway microbiota was significantly less diverse in neutrophilic participants and different from other inflammatory phenotypes, especially EA [18]. Moreover, patients with poorly controlled asthma showed a reduced bacterial diversity [19]. Herein, we also demonstrated that NEA seemed to have a greater decrease in not only diversity but also richness and evenness than EA. A significant general structure difference of the microbiota in EA, NEA and HC groups has also been identified.
As for the different taxonomic distribution, consistent with previous reports [26], we discovered that Bacteroidetes and Fusobacteria were reduced in asthmatic groups. However, an increase of Proteobacteria had not been observed [23]. Besides, compared with the severe or poorly controlled asthma reported previously [18, 19], we were first to report that Glaciecola, Helicobacter, Bifidobacterium, Deinococcus, Scardovia and Desulfobulbus showed a differentiated distribution level between the inflammatory phenotypes indicating a different microbial composition structure in mild-to-moderate asthma. Despite various studies have identified the potential protection from the gastrointestinal H. pylori on the allergy of asthma [27], the research on the immunomodulation of airway epithelium is limited. Colonized H. pylori may participate in the pathogenesis of young asthma by inducing the activation of MAPK p38 protein and the increased production of IL-8, which is tightly associated with the recruitment of neutrophil [28, 29]. But H. pylori may play a different role in adults' asthma, especially in the different inflammatory phenotypes and needs further investigation. Bifidobacterium, has been observed with a lower level in the airway of EA in present study. This genus could suppress the Th2 type immune response within the lungs of allergic asthma and reduce the recruitment of eosinophil into the lungs by producing exopolysaccharide [30], a high-molecular compound with various potent immunomodulatory activities [31, 32]. Therefore, the differential level of Bifidobacterium may contribute to the formation of inflammatory phenotypes. However, the roles of other differentiated genera identified in the pathogenesis of asthma have not been reported. Moreover, Haemophilus influenzae as an important species exerts a critical effect on pulmonary neutrophilic inflammation and poor response to ICS [33, 34]. Herein, we also found a rich abundance of the Haemophilus genus (6%), but no significant difference was observed. Besides, we discovered the 5 genera correlated with spirometry and disease progression of asthma for the first time. All of them and Haemophilus are critical abundant points in the co-occurrence networks. However, the detailed pathogenic species in every genus and their biological effects behind the co-existing patterns need future investigation.
PICRUSt explored the potential functions of respiratory microbiota in this study. Our results showed that the microbial genes might participate in the pathogenesis of immune and infectious diseases, especially in NEA. Microbial genes could also modulate immune and digestive system directly in some extent. In fact, microbiota has already been reported to participate in the pathogenesis of asthma especially neutrophilic phenotypes via TIR-domain containing adapter-inducing interferon-beta and MYD88 molecules and induce the activation of Th17 [35]. Normal colonizing microbiota could mitigate the inflammation by decreasing the accumulation of natural killer T cells in airway [36]. But the absence of microbiota in murine model or the dysbiosis in human airway could cause an allergic status and airway hyperresponsiveness [37, 38]. Besides, the colonization of pathogenic bacteria leads to an activation of corticosteroid-resistance associated signalling pathway and show a strong induction of inflammatory cytokines [13, 39, 40]. Given that the prediction of the microbial function was made based on the conserved genetic sequence, the RNA sequencing and the transcriptomics techniques should be applied for confirmation. Besides, the regulation of metabolism processing also needs to be demonstrated by further metabolomic research.
In conclusion, this study performed in Northeast China showed a significantly decreased diversity, richness and evenness in mild to moderate asthmatics, especially in NEA. Different asthmatic phenotypes displayed a distinct taxonomic composition of microbiota. Understanding the detailed role of airway microbiota may contribute to the development of therapeutic strategies to modulate asthma.
Supplementary Material
Supplementary figures and tables.
Abbreviation
GINA: Global Initiative for Asthma; EA: eosinophilic asthma; NEA: non-eosinophilic asthma; ICS: Inhaled corticosteroid; BMI: Body Mass Index; ACQ6: Asthma Control Questionnaire 6; FEV1: forced expiratory volume in 1 s; FVC: forced vital capacity; HC: healthy control; OTUs: Operational Taxonomic Units; OBS: observed species; PCA: Principal Component Analysis; PLS-DA: Partial Least Squares Discriminant Analysis; RDA: Redundancy Analysis; PICRUSt: Phylogenetic Investigation of Communities by Reconstruction of Unobserved States.
Acknowledgements
The Authors would like to thank to the support from Personal Biotechnology company, Shanghai, China for sequencing. This research is funded by Fundamental Research Funds for the General Universities (Grant no. 451170306058), Graduate Innovation Fund of Jilin University (Grant no. 2017139), Key Laboratory of Health and Family Planning Commission of Jilin Province of China (Grant no. 3D5172303426) and Provincial School Co-construction Industrialization Demonstration Project of Jilin Province (Grant no. SXGJSF2017-1-1(01)).
Data Availability
The raw sequencing data used to support the findings of this study has been deposited in the NCBI Sequence Read Archive database under the BioProject ID number PRJNA412738.
Competing Interests
The authors have declared that no competing interest exists.
References
1. Kim HY, Umetsu DT, Dekruyff RH. Innate lymphoid cells in asthma: Will they take your breath away? Eur J Immunol. 2016;46:795-806
2. Zeki AA, Yeganeh B, Kenyon NJ. et al. Autophagy in airway diseases: a new frontier in human asthma? Allergy. 2016;71:5-14
3. Global Initiative for Asthma. Global Strategy for Asthma Management and Prevention, GINA, Fontana, WI, USA, 2017. http://ginasthma.org/ download/317/.
4. Wenzel SE. Emergence of Biomolecular Pathways to Define Novel Asthma Phenotypes. Type-2 Immunity and Beyond. Am J Respir Cell Mol Biol. 2016;55:1-4
5. Gibson PG. Inflammatory phenotypes in adult asthma: clinical applications. Clin Respir J. 2009;3:198-206
6. Simpson JL, Gibson PG, Yang IA. et al. Impaired macrophage phagocytosis in non-eosinophilic asthma. Clin Exp Allergy. 2013;43:29-35
7. Inoue H, Ito I, Niimi A. et al. CT-assessed large airway involvement and lung function decline in eosinophilic asthma: The association between induced sputum eosinophil differential counts and airway remodeling. J Asthma. 2016;53:914-21
8. Simpson JL, Yang IA, Upham JW. et al. Periostin levels and eosinophilic inflammation in poorly-controlled asthma. BMC Pulm Med. 2016;16:67
9. Simpson JL, Gibson PG, Yang IA. et al. Altered sputum granzyme B and granzyme B/proteinase inhibitor-9 in patients with non-eosinophilic asthma. Respirology. 2014;19:280-7
10. Troy NM, Hollams EM, Holt PG. et al. Differential gene network analysis for the identification of asthma-associated therapeutic targets in allergen-specific T-helper memory responses. BMC Med Genomics. 2016;9:9
11. Singh AM, Busse WW. Asthma exacerbations. 2: aetiology. Thorax. 2006;61:809-16
12. Stein MM, Hrusch CL, Gozdz J. et al. Innate Immunity and Asthma Risk in Amish and Hutterite Farm Children. N Engl J Med. 2016;375:411-21
13. Goleva E, Jackson LP, Harris JK. et al. The effects of airway microbiome on corticosteroid responsiveness in asthma. Am J Respir Crit Care Med. 2013;188:1193-201
14. Goleva E, Harris JK, Robertson CE. et al. Airway microbiome and responses to corticosteroids in corticosteroid-resistant asthma patients treated with acid suppression medications. J Allergy Clin Immunol. 2017;140:860-2
15. Huang YJ, Nariya S, Harris JM. et al. The airway microbiome in patients with severe asthma: Associations with disease features and severity. J Allergy Clin Immunol. 2015;136:874-84
16. Green BJ, Wiriyachaiporn S, Grainge C. et al. Potentially pathogenic airway bacteria and neutrophilic inflammation in treatment resistant severe asthma. PLoS One. 2014;9:e100645
17. Standards for the diagnosis and care of patients with chronic obstructive pulmonary disease (COPD) and asthma. This official statement of the American Thoracic Society was adopted by the ATS Board of Directors, November 1986. Am Rev Respir Dis. 1987;136:225-44
18. Taylor SL, Leong LEX, Choo JM. et al. Inflammatory phenotypes in patients with severe asthma are associated with distinct airway microbiology. J Allergy Clin Immunol. 2018;141:94-103
19. Simpson JL, Daly J, Baines KJ. et al. Airway dysbiosis: Haemophilus influenzae and Tropheryma in poorly controlled asthma. Eur Respir J. 2016;47:792-800
20. Khatry DB, Gossage DL, Geba GP. et al. Discriminating sputum-eosinophilic asthma: Accuracy of cutoffs in blood eosinophil measurements versus a composite index, ELEN. J Allergy Clin Immunol. 2015;136:812-4 e2
21. Langille MG, Zaneveld J, Caporaso JG. et al. Predictive functional profiling of microbial communities using 16S rRNA marker gene sequences. Nat Biotechnol. 2013;31:814-21
22. Sverrild A, Kiilerich P, Brejnrod A. et al. Eosinophilic airway inflammation in asthmatic patients is associated with an altered airway microbiome. J Allergy Clin Immunol. 2017;140:407-417
23. Marri PR, Stern DA, Wright AL. et al. Asthma-associated differences in microbial composition of induced sputum. J Allergy Clin Immunol. 2013;131:346-52
24. Busse WW, Lemanske RF Jr. Asthma. N Engl J Med. 2001;344:350-62
25. Li N, Qiu R, Yang Z. et al. Sputum microbiota in severe asthma patients: Relationship to eosinophilic inflammation. Respir Med. 2017;131:192-8
26. Zhang Q, Cox M, Liang Z. et al. Airway Microbiota in Severe Asthma and Relationship to Asthma Severity and Phenotypes. PLoS One. 2016;11:e0152724
27. Miftahussurur M, Nusi IA, Graham DY. et al. Helicobacter, Hygiene, Atopy, and Asthma. Front Microbiol. 2017;8:1034
28. Dela Pena-Ponce MG, Jimenez MT, Hansen LM. et al. The Helicobacter pylori type IV secretion system promotes IL-8 synthesis in a model of pediatric airway epithelium via p38 MAP kinase. PLoS One. 2017;12:e0183324
29. Oliveira S de, Reyes-Aldasoro CC, Candel S. et al. Cxcl8 (IL-8) mediates neutrophil recruitment and behavior in the zebrafish inflammatory response. Journal of immunology. 2013;190:4349-59
30. Schiavi E, Plattner S, Rodriguez-Perez N. et al. Exopolysaccharide from Bifidobacterium longum subsp. longum 35624 modulates murine allergic airway responses. Benef Microbes. 2018;9:761-73
31. Geisinger E, Isberg RR. Antibiotic modulation of capsular exopolysaccharide and virulence in Acinetobacter baumannii. PLoS Pathog. 2015;11:e1004691
32. Caggianiello G, Kleerebezem M, Spano G. Exopolysaccharides produced by lactic acid bacteria: from health-promoting benefits to stress tolerance mechanisms. Appl Microbiol Biotechnol. 2016;100:3877-86
33. Huang YJ, Boushey HA. The microbiome in asthma. J Allergy Clin Immunol. 2015;135:25-30
34. Essilfie AT, Simpson JL, Dunkley ML. et al. Combined Haemophilus influenzae respiratory infection and allergic airways disease drives chronic infection and features of neutrophilic asthma. Thorax. 2012;67:588-99
35. Liu J, Pang Z, Wang G. et al. Advanced Role of Neutrophils in Common Respiratory Diseases. J Immunol Res. 2017;2017:6710278
36. Olszak T, An D, Zeissig S. et al. Microbial exposure during early life has persistent effects on natural killer T cell function. Science. 2012;336:489-93
37. Herbst T, Sichelstiel A, Schar C. et al. Dysregulation of allergic airway inflammation in the absence of microbial colonization. Am J Respir Crit Care Med. 2011;184:198-205
38. Huang YJ, Nelson CE, Brodie EL. et al. Airway microbiota and bronchial hyperresponsiveness in patients with suboptimally controlled asthma. J Allergy Clin Immunol. 2011;127:372-81
39. N'Guessan PD, Haarmann H, Steiner T. et al. The Moraxella catarrhalis-induced pro-inflammatory immune response is enhanced by the activation of the epidermal growth factor receptor in human pulmonary epithelial cells. Biochem Biophys Res Commun. 2014;450:1038-44
40. Vissing NH, Chawes BL, Bisgaard H. Increased risk of pneumonia and bronchiolitis after bacterial colonization of the airways as neonates. Am J Respir Crit Care Med. 2013;188:1246-52
Author contact
![]() Corresponding author: Fang Wang, Department of Pathogen Biology, College of Basic Medical Sciences, Jilin University, NO. 828 of Xinmin Street, Changchun, China, Email: wfedu.cn
Corresponding author: Fang Wang, Department of Pathogen Biology, College of Basic Medical Sciences, Jilin University, NO. 828 of Xinmin Street, Changchun, China, Email: wfedu.cn