Impact Factor ISSN: 1449-1907

 Global reach, higher impact
Int J Med Sci 2018; 15(11):1235-1240. doi:10.7150/ijms.24451 This issue Cite
Research Paper
Association of renal systolic time intervals with brachial-ankle pulse wave velocity
Wen-Hsien Lee1,2,3,4, Po-Chao Hsu2,4, Chun-Yuan Chu2,4, Szu-Chia Chen1,3,4, Hung-Hao Lee2, Ying-Chih Chen2,3, Meng-Kuang Lee2,3, Chee-Siong Lee2,4, Hsueh-Wei Yen2,4, Tsung-Hsien Lin2,4, Wen-Chol Voon2,4, Wen-Ter Lai2,4, Sheng-Hsiung Sheu2,4, Po-Lin Kuo1, Ho-Ming Su2,3,4 ![]()
1. Graduate Institute of Clinical Medicine, College of Medicine, Kaohsiung Medical University, Kaohsiung, Taiwan
2. Division of Cardiology, Department of Internal Medicine, Kaohsiung Medical University Hospital, Kaohsiung Medical University, Kaohsiung, Taiwan
3. Department of Internal Medicine, Kaohsiung Municipal Hsiao-Kang Hospital, Kaohsiung Medical University, Kaohsiung, Taiwan
4. Faculty of Medicine, College of Medicine, Kaohsiung Medical University, Kaohsiung, Taiwan
Received 2017-12-19; Accepted 2018-3-2; Published 2018-7-30
Abstract
Aims: The renal systolic time intervals (STIs), including renal pre-ejection period (PEP), renal ejection time (ET), and renal PEP/renal ET measured by renal Doppler ultrasound, were associated with poor cardiac function and adverse cardiac outcomes. However, the relationship between renal hemodynamic parameters and arterial stiffness in terms of brachial-ankle pulse wave velocity (baPWV) has never been evaluated. The aim of this study was to assess the relationship between renal STIs and baPWV.
Methods: This cross-sectional study enrolled 230 patients. The renal hemodynamics was measured from Doppler ultrasonography and baPWV was measured from ABI-form device by an oscillometric method.
Results: Patients with baPWV ≧ 1672 cm/s had a higher value of renal resistive index (RI) and lower values of renal PEP and renal PEP/ET (all P< 0.001). In univariable analysis, baPWV was significantly associated with renal RI, renal PEP, and renal PEP/renal ET (all P< 0.001). In multivariable analysis, renal PEP (unstandardized coefficient β = -3.185; 95% confidence interval = -5.169 to -1.201; P = 0.002) and renal PEP/renal ET (unstandardized coefficient β = -5.605; 95% CI = -10.217 to -0.992; P = 0.018), but not renal RI, were still the independent determinants of baPWV.
Conclusion: Our results found that renal PEP and renal PEP/renal ET were independently associated with baPWV. Hence, renal STIs measured from renal echo may have a significant correlation with arterial stiffness.
Keywords: Systolic time intervals, renal Doppler, arterial stiffness, blood pressure, brachial-ankle pulse wave velocity
Introduction
The vascular stiffness estimated by a non-invasive measurement is a widely used clinical indicator for cardiovascular mobility and mortality [1,2]. In general, the brachial-ankle pulse wave velocity (baPWV) measured from a simple ABI-form device represents arterial stiffness and is associated with adverse cardiovascular events in patients with diabetes, coronary artery disease, hypertension, chronic kidney disease, end stage renal disease, atrial fibrillation, and so on [3-7]. The baPWV combined with other atherosclerotic indicators, such as ankle-brachial index, or carotid intima-media thickness increase accuracy of estimated macro-vascular damage and adverse cardiovascular outcomes [8-10].
Association of baPWV and consequence of micro-vascular injury like renal function deterioration have been studied in patients with arterial hypertension, chronic kidney disease, and atrial fibrillation [4,5,9]. In fact, renal micro-vascular disease is usually evaluated by a renal Doppler. Renal resistant index (RI) calculated as (peak systolic velocity - minimum diastolic velocity)/peak systolic velocity from Doppler wave form is a popular and useful hemodynamic tool for examination of renal arteriole injury and parenchyma pathological change [11,12]. Although high value of baPWV is associated with increased arterial stiffness, decreased estimated glomerular filtration rate (eGFR), and increased rate of renal function decline, the correlation between baPWV and renal RI is not always significant in previous studies [8,13]. Recently, we found renal systolic time intervals (STIs), including pre-ejection period (PEP), ejection time (ET), and PEP/ET, were significantly associated with left ventricular systolic function and adverse cardiac outcomes [14,15]. Renal PEP was measured from the initiation of the electrocardiographic QRS to the foot of the intra-renal arterial Doppler wave from. The physiologic meaning of renal PEP is the time duration from the beginning of left ventricular depolarization to the foot of intra-renal pulse. Because pulse wave velocity (PWV) is inversely correlated with time duration, we hypothesized that renal STIs were potentially associated with baPWV [14,16], so the aim of our study was to investigate the relationship between renal STIs and baPWV.
Methods
Study subjects and design
Based on this observational study, we enrolled 230 participants in a local regional hospital in Taiwan. Detailed inclusion and exclusion criteria have been described in our previous study [14]. In the present study, our patients received echocardiographic, renal Doppler, and baPWV examination.
Ethics statement
The study methods were carried out in accordance with the approved guidelines, and the study protocols were approved by the Institutional Review Board committee of the Kaohsiung Medical University Hospital (KMUHIRB-E(II)-20180149). Written informed consent was obtained from all subjects.
Renal Doppler ultrasonography study
Renal RI, renal PEP, and renal ET were measured from a CX50 machine (Philips Compact Xtreme System, USA) and measurement protocol was mentioned in our previous study [14,15]. Briefly, renal PEP was measured from the initiation of QRS to the beginning of renal arteriole Doppler wave form and renal ET was measured from the beginning to the dicrotic notch of renal arteriole Doppler wave form. Three measurements were acquired from each kidney, and the mean value for right and left kidney was recorded for further analysis.
Assessment of blood pressure and baPWV
Blood pressure and baPWV measurements were obtained after ultrasonic examination with the patient in the supine position and after a rest period of at least 10 minutes. Blood pressure and baPWV were automatically measured by an ABI-form device (VP1000; Colin Co. Ltd., Komaki, Japan) designed by an oscillometric method that simultaneously detects brachial and tibial waveforms in both the arms and ankles [4]. The blood pressure and baPWV were measured twice in each patient. Bilateral values of blood pressure and baPWV were obtained in both arms, and the mean value was used for further analyses.
Collection of demographic, medical, and laboratory data
Baseline medical history and laboratory test values were collected from medical records. The eGFR was calculated by the equation used in the Modification of Diet in Renal Disease study [17].
Statistical analysis
Baseline data were presented as percentage or mean ± standard deviation. The relationship between two continuous variables was analyzed by Pearson's correlation. Different groups were analyzed by Chi-square test for categorical variables or by independent t-test for continuous variables. For basic multivariable model, the significant variables in univariable analysis except renal RI, renal PEP, and renal PEP/renal ET were selected by stepwise multiple linear regression to identify the determinants of baPWV. The relationship among clinical variables, renal Doppler parameters, and baPWV were analyzed by four multivariable models, i.e. basic model, basic model plus renal RI, basic model plus renal PEP, and basic model plus renal PEP/renal ET. A P value less than 0.05 was considered statistically significant. Statistical analysis was performed using SPSS version 18.0 (SPSS Inc., Chicago, IL, USA).
Results
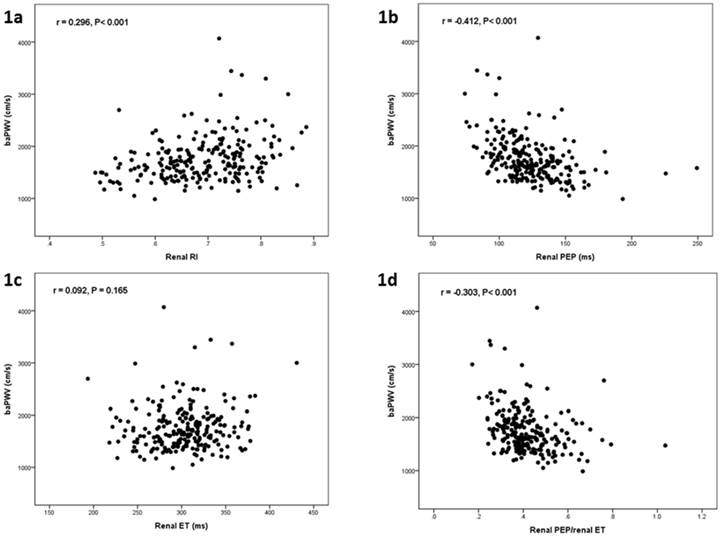
Table 1 shows the comparison of baseline characteristics between two groups divided by median value of baPWV (1672 cm/s) in all 230 participants. There was a significant difference in age, gender, diabetes mellitus, systolic blood pressure, diastolic blood pressure, heart rate, body mass index, eGRF, chronic kidney disease, hemoglobin, renal RI, renal PEP, and renal PEP/renal ET between groups. Figure 1 shows the scatter plots between baPWV and renal RI (Figure 1a), baPWV and renal PEP (Figure 1b), baPWV and renal ET (Figure 1c), and baPWV and renal PEP/renal ET (Figure 1d). Table 2 shows the determinants of baPWV according to univariable analysis in all study participants. Advanced age, diabetes mellitus, cerebrovascular disease, increased systolic blood pressure, diastolic blood pressure and renal RI, and decreased body mass index, eGFR, hemoglobin, renal PEP, and renal PEP/renal ET were associated with baPWV.
Comparison of baseline characteristics according to median value of brachial artery pulse wave velocity
| baPWV < 1672 cm/s n = 115 | baPWV ≧ 1672 cm/s n = 115 | P value | |
|---|---|---|---|
| Clinical characteristics | |||
| Age (year) | 58.8 ± 11.2 | 69.5 ± 10.8 | <0.001 |
| Male gender (%) | 71.3 | 52.2 | 0.003 |
| Diabetes mellitus (%) | 28.7 | 35.7 | 0.259 |
| Hypertension (%) | 73.0 | 73.0 | 1.000 |
| Coronary artery disease (%) | 17.4 | 15.7 | 0.723 |
| Cerebrovascular disease (%) | 7.0 | 15.7 | 0.037 |
| Congestive heart failure (%) | 16.5 | 16.5 | 1.000 |
| Systolic blood pressure (mmHg) | 126.3 ± 15.4 | 141.8 ± 19.0 | <0.001 |
| Diastolic blood pressure (mmHg) | 73.3 ± 10.2 | 78.6 ± 11.9 | <0.001 |
| Heart rate (min-1) | 67.1 ± 10.7 | 70.6 ± 12.5 | 0.020 |
| Body mass index (kg/m2) | 26.9 ± 3.7 | 25.9 ± 3.9 | 0.046 |
| Total cholesterol (mg/dL) | 196.5 ± 42.7 | 189.4 ± 42.9 | 0.246 |
| eGFR (mL/min/1.73 m2) | 64.7 ± 20.5 | 56.0 ± 20.3 | 0.002 |
| Chronic kidney disease (%) | 29.0 | 51.9 | 0.001 |
| Glucose (mg/dL) | 118.2 ± 36.2 | 126.6 ± 50.2 | 0.180 |
| Hemoglobin (g/dL) | 13.9 ± 2.1 | 13.0 ± 1.7 | 0.002 |
| Medications | |||
| ACEI use (%) | 21.7 | 14.8 | 0.172 |
| ARB use (%) | 43.5 | 43.5 | 1.000 |
| β-blocker use (%) | 47.0 | 40.9 | 0.425 |
| CCB use (%) | 46.1 | 45.2 | 1.000 |
| Diuretics use (%) | 27.0 | 38.3 | 0.091 |
| Renal Doppler ultrasound | |||
| Renal RI | 0.67 ± 0.09 | 0.71 ± 0.08 | <0.001 |
| Renal PEP (ms) | 132.2 ± 23.8 | 114.7 ± 19.9 | <0.001 |
| Renal ET (ms) | 299.5 ± 33.0 | 307.1 ± 39.5 | 0.118 |
| Renal PEP/renal ET | 0.45 ± 0.11 | 0.38 ± 0.11 | <0.001 |
| ABI-form device | |||
| baPWV (cm/s) | 1451.2 ± 146.7 | 2056.3 ± 398.4 | <0.001 |
| ABI | 1.17 ± 0.10 | 1.16 ± 0.10 | 0.529 |
Abbreviations. ABI, Ankle brachial index; ACEI: angiotensin converting enzyme inhibitor; ARB: angiotensin II receptor blocker; baPWV, brachial pulse wave velocity; eGFR: estimated glomerular filtration rate; ET, ejection time; ms, millisecond; PEP, pre-ejection period; PEP, pre-ejection period; RI, resistive index.
The scatter plot between brachial artery pulse wave velocity (baPWV) and renal resistive index (RI) (a), baPWV and renal pre-ejection period (PEP) (b), baPWV and renal ejection time (ET) (c), and baPWV and renal PEP/renal ET in all study patients.
Determinants of brachial artery pulse wave velocity by univariable analysis in all patients
| Unstandardized coefficient β | 95% confidence interval | P value | |
|---|---|---|---|
| Clinical characteristics | |||
| Age (per 1 year) | 15.549 | (11.468, 19.630) | <0.001 |
| Male gender | 81.726 | (-31.960, 195.412) | 0.158 |
| Diabetes mellitus | 127.555 | (9.927, 245.184) | 0.034 |
| Hypertension | 14.946 | (-110.106, 139.999) | 0.814 |
| Coronary artery disease | 2.383 | (-147.052, 151.818) | 0.975 |
| Cerebrovascular disease | 268.683 | (96.961, 440.404) | 0.002 |
| Congestive heart failure | 126.509 | (-22.012, 275.029) | 0.095 |
| Systolic blood pressure (per 1 mmHg) | 13.179 | (10.798, 15.560) | <0.001 |
| Diastolic blood pressure (per 1 mmHg) | 16.272 | (11.877, 20.666) | <0.001 |
| Heart rate (per 1 min-1) | 9.679 | (5.107, 14.252) | <0.001 |
| Body mass index (per 1 kg/m2) | -17.263 | (-31.623, -2.902) | 0.019 |
| Total cholesterol (per 1 mg/dL) | -0.530 | (-1.945, 0.884) | 0.461 |
| eGFR (per 1 mL/min/1.73 m2) | -5.421 | (-8.039, -2.803) | <0.001 |
| Chronic kidney disease | 239.557 | (129.269, 349.886) | <0.001 |
| Glucose (per 1 mg/dL) | 0.882 | (-0.509, 2.273) | 0.213 |
| Hemoglobin (per 1 g/dL) | -54.564 | (-84.587, -24.542) | <0.001 |
| Medications | |||
| ACEI use | -81.048 | (-224.303, 62.208) | 0.266 |
| ARB use | 44.650 | (-67.148, 156.449) | 0.432 |
| β-blocker use | -12.808 | (-124.621, 99.005) | 0.822 |
| CCB use | 14.299 | (-97.101, 125.699) | 0.801 |
| Diuretics use | 114.880 | (-2.553, 232.312) | 0.055 |
| Renal Doppler ultrasound | |||
| Renal RI (per 0.01) | 14.550 | (8.230, 20.871) | <0.001 |
| Renal PEP (per 1 ms) | -7.436 | (-9.585, -5.287) | <0.001 |
| Renal ET (per 1 ms) | 1.072 | (-0.444, 2.588) | 0.165 |
| Renal PEP/renal ET (per 0.01) | -11.265 | (-15.891, -6.640) | <0.001 |
| ABI-form device | |||
| ABI | -3.780 | (-9.217, 1.618) | 0.168 |
Abbreviations as in Table 1.
Table 3 shows the determinants of baPWV in four multivariable models. In the basic multivariable model (R-squared = 0.579), systolic blood pressure, age, heart rate, cerebrovascular disease, diastolic blood pressure, and diabetes mellitus were significantly associated with baPWV. Additionally, renal PEP (unstandardized coefficient β = -3.185; 95% CI = -5.169 to -1.201; P = 0.002) and renal PEP/renal ET (unstandardized coefficient β = -5.605; 95% CI = -10.217 to -0.992; P = 0.018) were independently associated with baPWV in the model consisting of the basic model plus renal PEP (R-squared = 0.601) and basic model plus renal PEP/renal ET (R-squared = 0.592) respectively. However, renal RI (P = 0.984) was not significantly associated with baPWV in the model consisting of basic model plus renal RI (R-squared = 0.579).
Determinants of brachial artery pulse wave velocity by four models of multivariable analyses in all patients
| Unstandardized coefficient β | 95% confidence interval | P value | |
|---|---|---|---|
| Basic model (R2 = 0.579) | |||
| Systolic blood pressure (per 1 mmHg) | 7.868 | (4.498, 11.237) | <0.001 |
| Age (per 1 year) | 14.898 | (11.040, 18.757) | <0.001 |
| Heart rate (per 1 min-1) | 9.745 | (5.756, 13.735) | <0.001 |
| Cerebrovascular disease | 127.089 | (5.461, 248.716) | 0.041 |
| Diastolic blood pressure (per 1 mmHg) | 6.598 | (0.624, 12.572) | 0.031 |
| Diabetes mellitus | 89.160 | (1.082, 177.238) | 0.047 |
| Basic model + RI (R2 = 0.579) | |||
| Renal RI | -7.987 | (-775.412, 759.438) | 0.984 |
| Basic model + renal PEP (R2 = 0.601) | |||
| Renal PEP | -3.185 | (-5.169, -1.201) | 0.002 |
| Basic model + renal PEP/renal ET (R2 = 0.592) | |||
| Renal PEP/renal ET | -5.605 | (-10.217, -0.992) | 0.018 |
Abbreviations. ET, ejection time; PEP, pre-ejection period; PEP, pre-ejection period; RI, resistive index.
Discussion
This is the first study investigating the relationship between renal STIs and baPWV. The main finding of our study was renal PEP and renal PEP/renal ET measured from renal Doppler were significantly associated with baPWV in the multivariable analysis.
The PWV reflects vascular stiffness and severity of atherosclerosis [18]. The PWV increase is associated with increment of propagation speed of the arterial wave and vascular stiffness [16]. According to the biomechanical model of the Moens-Korteweg equation, PWV2 = Eh/2rp, where E = elastic Young's modulus, h = wall thickness, r = vascular radius, and p = blood density, the PWV increases as vascular wall thickness increases and/or luminal diameter decreases [19]. The baPWV, carotid-femoral PWV, and aortic PWV measured from different non-invasive instruments were useful parameters of atherosclerosis and could be used to predict prognosis in general clinical practice [20]. Because PWV is calculated as the transmission distance of arterial pulse wave divided by its transmission time, its value is inversely proportional to pulse wave transmission time. Because renal PEP was measured as the transmission time from the initiation of QRS to the beginning of renal arteriole Doppler wave form, the renal PEP and its combination index, renal PEP/renal ET, should have a significantly negative correlation with PWV. In fact, we found renal PEP and renal PEP/renal ET were negatively associated with baPWV in our present study.
Renal RI measured from non-invasive Doppler ultrasound has been widely used to evaluate intra-renal hemodynamics for decades [21]. Renal RI is also a good prognostic indicator of renal function deterioration and cardiovascular mortality [22-24]. Recently, renal RI was also found to be correlated to the severity of carotid atherosclerosis and target organ damage in patients with hypertension [25-27]. Although renal RI chiefly reflected a local renal vascular resistance, its value was reported to be influenced by systemic blood pressure [26,28,29]. Several studies investigating the relationship between PWV and renal RI found renal RI was only correlated to PWV in univariable analysis, but the relationship disappeared in multivariable analysis [13,28,30,31]. Hashimoto et al. ever evaluated the relationship among central aortic blood pressure, aortic PWV, and renal RI in 133 patients with essential hypertension [28]. They demonstrated that aortic PWV was significantly correlated to renal RI in a multivariable model, but the significant correlation disappeared after adjusting aortic pulse pressure. Ohta et al. observed a relationship among arterial stiffness, renal pulsatility index, and RI measured from main renal arteries and inter-lobar arteries in 245 patients with diabetic nephropathy [31]. They found that PWV was significantly correlated to the renal pulsatility index and RI measured from the main renal arteries and inter-lobar arteries in univariable analysis, but PWV was only significantly correlated with the renal RI measured from main renal arteries (β = 0.004, P = 0.044), not measured from inter-lobar arteries (β = 0.003, P = 0.072) in multivariable analysis. In our present study, we consistently demonstrated renal RI was significantly associated with baPWV in univariable analysis, but this association became insignificant in multivariable analysis. Although systemic and renal vascular diseases share common atherosclerotic risk factors, the speed and degree of atherosclerotic change in systemic and renal vascular territories may be different. Hence, the association between renal RI and baPWV only existed in the univariable analysis, but not in the multivariable analysis in the present study.
Study limitations
There were some limitations in our study. First, the chronological change and relationship between arterial stiffness and renal Doppler parameters were limited in this cross-sectional observation study. Second, we did not measure renal RI from main renal arteries, so we could not evaluate the relationship between baPWV and hemodynamics of main renal arteries. Finally, most of our patients received antihypertensive treatment for their chronic conditions. For ethical reasons, we did not withdraw their medications, so the influence of antihypertensive agents on our findings could not be excluded.
Conclusions
Our results found that renal PEP and renal PEP/renal ET were independently associated with baPWV. Hence, renal STIs measured from renal echo may have a significant correlation with arterial stiffness.
Acknowledgements
This study was supported by a grant from Kaohsiung Municipal Hsiao-Kang Hospital (kmhk-106-010), Kaohsiung Medical University, Kaohsiung, Taiwan.
Competing Interests
The authors have declared that no competing interest exists.
References
1. McEniery CM, Yasmin, Hall IR. et al. Normal vascular aging: differential effects on wave reflection and aortic pulse wave velocity: the Anglo-Cardiff Collaborative Trial (ACCT). J Am Coll Cardiol. 2005;46:1753-1760
2. Nichols WW, Denardo SJ, Wilkinson IB. et al. Effects of arterial stiffness, pulse wave velocity, and wave reflections on the central aortic pressure waveform. J Clin Hypertens. 2008;10:295-303
3. Munakata M. Brachial-ankle pulse wave velocity in the measurement of arterial stiffness: recent evidence and clinical applications. Curr Hypertens Rev. 2014;10:49-57
4. Chen SC, Lee WH, Hsu PC. et al. Association of Brachial-Ankle Pulse Wave Velocity With Cardiovascular Events in Atrial Fibrillation. Am J Hypertens. 2016;29:348-356
5. Chen SC, Chang JM, Liu WC. et al. Brachial-ankle pulse wave velocity and rate of renal function decline and mortality in chronic kidney disease. Clin J Am Soc Nephrol. 2011;6:724-732
6. Joo HJ, Cho SA, Cho JY. et al. The Relationship between Pulse Wave Velocity and Coronary Artery Stenosis and Percutaneous Coronary Intervention: a retrospective observational study. BMC Cardiovasc Disord. 2017;17:45
7. Zhang M, Bai Y, Ye P. et al. Type 2 diabetes is associated with increased pulse wave velocity measured at different sites of the arterial system but not augmentation index in a Chinese population. Clin Cardiol. 2011;34:622-627
8. Calabia J, Torguet P, Garcia I. et al. The relationship between renal resistive index, arterial stiffness, and atherosclerotic burden: the link between macrocirculation and microcirculation. J Clin Hypertens. 2014;16:186-191
9. Mancia G, Fagard R, Narkiewicz K. et al. 2013 ESH/ESC Guidelines for the management of arterial hypertension: the Task Force for the management of arterial hypertension of the European Society of Hypertension (ESH) and of the European Society of Cardiology (ESC). J Hypertens. 2013;31:1281-1357
10. Su HM, Lin TH, Hsu PC. et al. Association of brachial-ankle pulse wave velocity, ankle-brachial index and ratio of brachial pre-ejection period to ejection time with left ventricular hypertrophy. Am J Med Sci. 2014;347:289-294
11. Bige N, Levy PP, Callard P. et al. Renal arterial resistive index is associated with severe histological changes and poor renal outcome during chronic kidney disease. BMC Nephrol. 2012;13:139
12. Toledo C, Thomas G, Schold JD. et al. Renal resistive index and mortality in chronic kidney disease. Hypertension. 2015;66:382-388
13. Geraci G, Mule G, Geraci C. et al. Association of renal resistive index with aortic pulse wave velocity in hypertensive patients. Eur J Prev Cardiol. 2015;22:415-422
14. Lee WH, Hsu PC, Chu CY. et al. Systolic time intervals derived from electrocardiographic gated intra-renal artery Doppler waveform associated with left ventricular systolic function. Scientific reports. 2016;6:29293
15. Lee WH, Hsu PC, Chu CY. et al. Renal systolic time intervals derived from intra-renal artery Doppler as a novel predictor of adverse cardiac outcomes. Scientific reports. 2017;7:43825
16. Tomiyama H, Matsumoto C, Shiina K. et al. Brachial-Ankle PWV: Current Status and Future Directions as a Useful Marker in the Management of Cardiovascular Disease and/or Cardiovascular Risk Factors. J Atheroscler Thromb. 2016;23:128-146
17. Levey AS, Coresh J, Bolton K. et al. K/DOQI clinical practice guidelines for chronic kidney disease: evaluation, classification, and stratification. Am J Kidney Dis. 2002;39:S1-266
18. van Popele NM, Grobbee DE, Bots ML. et al. Association between arterial stiffness and atherosclerosis: the Rotterdam Study. Stroke. 2001;32:454-460
19. Lehmann ED. Noninvasive measurements of aortic stiffness: methodological considerations. Pathol Biol. 1999;47:716-730
20. Lu Y, Zhu M, Bai B. et al. Comparison of Carotid-Femoral and Brachial-Ankle Pulse-Wave Velocity in Association With Target Organ Damage in the Community-Dwelling Elderly Chinese: The Northern Shanghai Study. J Am Heart Assoc. 2017;6:e004168
21. Tublin ME, Bude RO, Platt JF. Review. The resistive index in renal Doppler sonography: where do we stand? AJR Am J Roentgenol. 2003;180:885-892
22. Doi Y, Iwashima Y, Yoshihara F. et al. Renal resistive index and cardiovascular and renal outcomes in essential hypertension. Hypertension. 2012;60:770-777
23. Ciccone MM, Iacoviello M, Gesualdo L. et al. The renal arterial resistance index: a marker of renal function with an independent and incremental role in predicting heart failure progression. Eur J Heart Fail. 2014;16:210-216
24. Ennezat PV, Marechaux S, Six-Carpentier M. et al. Renal resistance index and its prognostic significance in patients with heart failure with preserved ejection fraction. Nephrol Dial Transplant. 2011;26:3908-3913
25. Doi Y, Iwashima Y, Yoshihara F. et al. Association of Renal Resistive Index With Target Organ Damage in Essential Hypertension. Am J Hypertens. 2012;12:1292-1298
26. Geraci G, Mule G, Costanza G. et al. Relationship Between Carotid Atherosclerosis and Pulse Pressure with Renal Hemodynamics in Hypertensive Patients. Am J Hypertens. 2016;29:519-527
27. Geraci G, Mule G, Mogavero M. et al. Renal haemodynamics and severity of carotid atherosclerosis in hypertensive patients with and without impaired renal function. Nutr Metab Cardiovasc Dis. 2015;25:160-166
28. Hashimoto J, Ito S. Central pulse pressure and aortic stiffness determine renal hemodynamics: pathophysiological implication for microalbuminuria in hypertension. Hypertension. 2011;58:839-846
29. Lee MK, Hsu PC, Chu CY. et al. Significant Correlation between Brachial Pulse Pressure Index and Renal Resistive Index. Acta Cardiol Sin. 2015;31:98-105
30. Morreale M, Mule G, Ferrante A. et al. Association of Renal Resistive Index with Markers of Extrarenal Vascular Changes in Patients with Systemic Lupus Erythematosus. Ultrasound Med Biol. 2016;42:1103-1110
31. Ohta Y, Fujii K, Arima H. et al. Increased renal resistive index in atherosclerosis and diabetic nephropathy assessed by Doppler sonography. J Hypertens. 2005;23:1905-1911
Author contact
![]() Corresponding author: Ho-Ming Su, MD, Department of Internal Medicine, Kaohsiung Municipal Hsiao-Kang Hospital, Kaohsiung Medical University, 482, Shan-Ming Rd., Hsiao-Kang Dist., 812 Kaohsiung, Taiwan. TEL: 886- 7- 8036783 - 3441, FAX: 886- 7- 8063346; E-mail: cobeshmnet.tw
Corresponding author: Ho-Ming Su, MD, Department of Internal Medicine, Kaohsiung Municipal Hsiao-Kang Hospital, Kaohsiung Medical University, 482, Shan-Ming Rd., Hsiao-Kang Dist., 812 Kaohsiung, Taiwan. TEL: 886- 7- 8036783 - 3441, FAX: 886- 7- 8063346; E-mail: cobeshmnet.tw